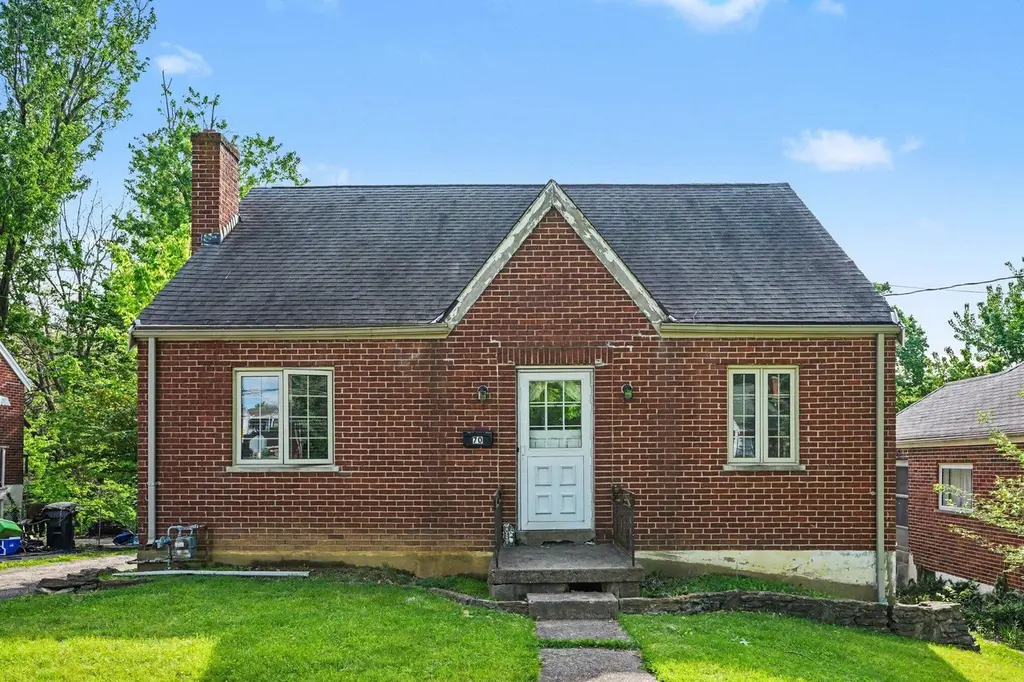
70 Eastern Ave · Elsmere, KY
Flood risk 1/10 · Minimal
- FEMA flood zone
- X (unshaded)
- Chance of flooding over 30 yrs
- 0.0%
- Est. flood insurance / yr
- $507 – $1,088
Fire risk 1/10 · Minimal
- Est. fire insurance / yr
- $839 – $1,559
Heat risk 4/10 · Minor
- Hot days now (above 101°F)
- 7 days/yr
- Hot days in 30 yrs
- 18 days/yr
Wind risk 2/10 · Minimal
- Chance of severe wind over 30 yrs
- 1.0%
Air-quality risk 2/10 · Minimal
- Unhealthy air days now
- 1 days/yr
- Unhealthy air days in 30 yrs
- 3 days/yr
Risk factors via First Street. Map © Google.
Why this score? — see what drove the D grade
The composite is a weighted blend of 9 inputs, each scored 0–100. Each bar is that input's sub-score; the figure is the points it added to the 100-point composite (weight × sub-score).
- Cash flow +12.7/30.0
- ARV discount +10.9/15.0
- DSCR +3.8/10.0
- Rent growth +3.6/5.0
- Livability +3.6/5.0
- 1% rule +3.0/10.0
- Condition / age +2.5/5.0
- Schools +2.3/10.0
- Appreciation +0.0/10.0
$187,500
🖨 Deal sheet (PDF) 📄 Offer letter ✓ Due diligence
Listing remarks
Charming 3-bedroom, 1-bath Cape Cod located in Elsmere, KY- Just minutes from shopping, dining and the interstate for an easy commute. This home offers great potential with two upstairs bedrooms ready to be finished to the new buyers personal style and needs. A fantastic opportunity to add value and make it your own! Sellers are providing $500 home warranty for added peace of mind.
Key facts
- 0.35 acre lot
- Parking
- Built 1950
Property features AI
Finance
- Financial info: Home warranty included
Exterior
- Parking: Driveway; Off-street parking; On-street parking
- Utilities: Public water; Public sewer; Cable available
- Home design: Single family house; Two levels; Shingle roof; Built in 1950
- Construction: Brick construction; Poured concrete foundation
- Exterior features: Cleared, sloped lot; Shed(s); Paved road frontage on a city street
Interior
- Kitchen: Electric range; Microwave; Refrigerator
- Bedrooms: Primary Bedroom about 11 x 11; Bedroom 2 about 14 x 12; Bedroom 3 about 12 x 11
- Bathrooms: 1 full bathroom; Primary bath about 7 x 6
- Heating & cooling: Central air conditioning; Forced air heating
- Interior features: Full basement; Has view
- Laundry & utility: Washer; Dryer located in basement
Neighborhood map
What this means for you Summary
Snapshot
- This is a 3-bed/1.0-bath single-family listed at $188k.
Deal economics
- At list price, monthly cash flow is $-21 ($-248/yr) — negative.
- To cash-flow at today's rent, offer at most $184k (1.9% below list).
- To meet the 1% rule (rent ≥ 1% of price), the offer needs to be $150k (20.0% below list).
- Recommended offer: $150k (20.0% below list) — sets the bar for 1% rule.
- Cap rate 6.2% vs local median 5.0% in Elsmere — meaningfully above typical; check what's discounted (condition, days-on-market, listing class) to confirm the premium yield is real.
Location & tenants
- Location reads 72/100 on livability (#121 in KY) — a middle-class / working-renter tenant base. Strengths: crime A+, cost of living A+, housing A+; Watch: commute C-, amenities F, health & safety F.
- Erlanger-Elsmere Independent (suburban): math 21% / reading 32% proficiency, ranked #128 of 165 in KY (top 78%) — low school quality limits family demand, transient renter base, plan for 1-2y turnover.
- Zoned schools: Miles Elementary School (math 27% / reading 22%, grade F, #489 of 676 statewide, top 76%, 230 students, 50% FRL); Tichenor Middle School (math 19% / reading 38%, grade F, #161 of 217 statewide, top 75%, 539 students, 54% FRL); Lloyd High School (math 22% / reading 32%, grade F, #158 of 254 statewide, top 68%, 697 students, 57% FRL) — zoned schools at 53% FRL track the district average.
- Market conditions: Rents rising fast (+4.2%/yr); 124 active listings in the ZIP; 13 comparable units currently listed for rent nearby; rentals leasing fast (median 10d on market — plan ~1-2 weeks tenant-placement turnaround); 699 units permitted in Kenton County in 2024 (287 in 5+ unit buildings).
Forward outlook
- Local home prices are declining (-3.0%/yr); year-one equity from $1k of loan paydown is wiped out by about $6k of value loss. Plan a longer hold.
- Kenton County population projected at +5% by 2050 — modest demand growth; plan on rents tracking national, not racing it.
Negotiation context
- Only 5 days on market — expect competitive offers; lowballing is unlikely to land.
Risks & watch-outs
- Watch-outs: built in 1950 — expect roof / HVAC / electrical / plumbing capex.
Questions for the listing agent
- What do current leases actually rent for vs. the listed asking? Can we see a recent rent roll and the last 12 months of T-12 income?
- Built in 1950 — when were the roof, HVAC, electrical panel, plumbing, and water heater last replaced?
- Is there a deadline driving the sale (1031 exchange, divorce, estate, relocation)? That informs how much negotiation room exists.
- Schools are F-rated, which usually means shorter tenancies and higher turnover. Who's the typical renter profile here, and what's been the actual vacancy rate?
- The area grade is low — what's the realistic commute time and amenity access for the typical tenant pool here? Any planned neighborhood developments (good or bad) we should know about?
- What's the average days-on-market for RENTAL listings here right now (not sales)? A rising rental-DOM trend means longer vacancies and softer asking-rent achievability than the comps imply.
- What's the recent tenant-quality profile in this submarket — average credit score on applications, eviction rate, late-payment / NSF rate, and stable-employment percentage? A property-management company in the area should have these aggregated.
- How much new for-sale + rental construction is in the pipeline within 1–3 miles? Heavy new supply typically softens prices + rents 12–24 months out; constrained supply supports both.
Investment metrics
- 1% rule
- 0.80% ✗
- Cap rate
- 6.16%
- Cash-on-cash
- -0.47%
- DSCR
- 0.98
- GRM
- 10.4
CMA / ARV
- ARV (median comp)
- $202,798
- List price
- $187,500
- Delta
- -7.54%
- Verdict
- FAIR
- Comps
- 20 within 1.0 mi
Show comp detail 12 sales within ~0.75 mi
| Address | Dist | Beds/Ba | Sqft | Sold | Price | $/sf | Match |
|---|---|---|---|---|---|---|---|
| 86 Goodridge Dr | 0.24mi | 3/1.0 | 1,222 (-3%) | 2mo | $240,000 | $196 | 82 |
| 9 Park Ave | 0.32mi | 4/2.0 (+1) | 1,263 (+0%) | 2mo | $257,500 | $204 | 74 |
| 1230 Central Row Rd | 0.53mi | 3/1.5 | 1,271 (+1%) | 0mo | $209,000 | $164 | 71 |
| 451 Fox | 0.58mi | 3/1.0 | 1,260 (0%) | 2mo | $170,000 | $135 | 71 |
| 409 Lytle Ave | 0.46mi | 3/2.0 | 1,225 (-3%) | 1mo | $199,500 | $163 | 69 |
| 411 Swan Cir | 0.20mi | 4/2.5 (+1) | 1,368 (+9%) | 1mo | $262,500 | $192 | 65 |
| 712 Bedinger St | 0.48mi | 2/1.0 (-1) | 1,197 (-5%) | 2mo | $227,000 | $190 | 63 |
| 914 Central Row Rd | 0.56mi | 2/1.0 (-1) | 1,330 (+6%) | 2mo | $72,500 | $55 | 58 |
| 119 Honeysuckle Dr | 0.68mi | 4/1.5 (+1) | 1,236 (-2%) | 3mo | $269,000 | $218 | 56 |
| 1400 Central Row Rd | 0.58mi | 2/1.5 (-1) | 1,418 (+12%) | 0mo | $230,000 | $162 | 45 |
| 126 Honeysuckle Dr | 0.69mi | 3/2.0 | 1,102 (-12%) | 2mo | $265,000 | $240 | 41 |
| 9 Rosebud Ave | 0.69mi | 2/2.0 (-1) | 1,088 (-14%) | 1mo | $140,000 | $129 | 35 |
Match score weights: distance 35% · size 25% · config 20% · recency 20%. Top-matched comps best support the ARV.
Projected returns pro-forma
-3.0% appreciation · 4.22% rent growth · sell at horizon
- IRR
- -15.8%
- Equity multiple
- 0.43×
- Total profit
- $-29,865
- Equity at exit
- $27,957
- IRR
- -5.6%
- Equity multiple
- 0.62×
- Total profit
- $-19,986
- Equity at exit
- $16,212
Cash invested: $52,500 (down + closing). Projections, not guarantees.
Landlord ↔ Tenant lean methodology
- Overall (STATE)
- 83 Strongly Landlord-Friendly
- State Kentucky
- 83 Strongly Landlord-Friendly · R+16
- County
- — inherits STATE
- City
- — inherits STATE
ZIP-level market 41018
- Rents YoY
- 4.2%
- Active inventory
- 124
- Price-to-rent
- 10.4×
Monthly cashflow live
- Estimated rent
- $1,501 high interval (Pro) →
- Mortgage (P&I)
- −$983
- Tax from tax record
- −$145 /mo · $1,739/yr
- Insurance
- −$78
- HOA
- −$0
- Vacancy / Maint / Mgmt
- −$315
- Net cashflow
- $-21
Break-even live
Sensitivity live
| Price | -10% $86 | -5% $32 | +0% $-21 | +5% $-74 | +10% $-127 |
|---|---|---|---|---|---|
| Rent | -10% $-139 | -5% $-80 | +0% $-21 | +5% $39 | +10% $98 |
| Rate | -1.0pp $74 | -0.5pp $27 | base $-21 | +0.5pp $-69 | +1.0pp $-119 |
UW: 25.0% down · 7.5% · 30yr · 1.5% tax · 5.0% vac · 8.0% maint · 8.0% mgmt
Financing live
Cash to close
- Down payment
- $46,875
- Closing costs
- $5,625
- Reserves months
- —
- Total cash needed
- —
Loan-product check · same deal, 3 products live
Conventional
25% down · 7.5% · 30yr
- Down + closing
- —
- Monthly P&I
- —
- Monthly cashflow
- —
- DSCR
- —
- Eligible?
- —
Personal DTI + credit; lowest rate.
DSCR
20% down · 8.5% · 30yr
- Down + closing
- —
- Monthly P&I
- —
- Monthly cashflow
- —
- DSCR
- —
- Eligible?
- —
No personal income docs; deal must DSCR.
Hard money
10% down · 12.0% · 12mo
- Down + closing
- —
- Monthly P&I
- —
- Monthly cashflow
- —
- DSCR
- —
- Eligible?
- —
Short-term bridge; refi at stabilization.
Rent comps 13 comps
| Address | Beds | Baths | Sqft | Rent | $/sqft | DOM | Units | Dist |
|---|---|---|---|---|---|---|---|---|
| 9 Eagle Dr Elsmere, KY | 3.0 | 2.0 | 960 | $1,328 | $1.38 | 25d | 1 | 0.33mi |
| 109 Dove Dr Elsmere, KY | 3.0 | 2.0 | 960 | $1,328 | $1.38 | 3d | 1 | 0.33mi |
| 64 Eagle Dr Elsmere, KY | 3.0 | 2.0 | 960 | $1,328 | $1.38 | 9d | 1 | 0.40mi |
| 104 Dove Dr Elsmere, KY | 3.0 | 2.0 | 924 | $1,295 | $1.40 | 16d | 1 | 0.46mi |
| 43 Banklick St Florence, KY | 2.0 | 2.0 | 1265 | $1,355 | $1.07 | 5d | 3 | 0.60mi |
| 159 Green River Dr Erlanger, KY | 2.0 | 2.0 | 1278 | $1,595 | $1.25 | 3d | 1 | 0.73mi |
| 121 Carlisle St Elsmere, KY | 3.0 | 2.0 | 1650 | $2,000 | $1.21 | 16d | 1 | 0.73mi |
| 7222 Isaac Ln Florence, KY | 3.0 | 2.0 | 1400 | $1,795 | $1.28 | 18d | 1 | 0.74mi |
| 6805 Sebree Dr Florence, KY | 1.0–3.0 | 1.0–1.5 | 901 | $1,718 | $1.91 | 3d | 14 | 0.80mi |
| 868 Virginiabradford Ct Elsmere, KY | 3.0 | 2.5 | 974 | $3,500 | $3.59 | 3d | 1 | 0.87mi |
| 3610 Concord Dr Erlanger, KY | 3.0 | 1.5 | 1064 | $1,700 | $1.60 | 45d | 1 | 1.10mi |
| 101 Pinehurst Dr Florence, KY | 1.0–2.0 | 1.0 | 815 | $1,399 | $1.72 | 25d | 6 | 1.11mi |
| 3904 Lori Dr Erlanger, KY | 1.0–2.0 | 1.0–1.5 | 722 | $1,335 | $1.85 | 3d | 12 | 1.31mi |
Listing history 2 events
-
2026-05-05status Pending 386-char remark
-
2026-04-30$187,500 Active 386-char remark
ⓘ Source: listings_history table (triggers on properties + properties_extension) + one-shot
backfill from property_details.listing_events for pre-trigger history.
Tax reassessment forecast KY · Resets to sale price
- Current annual tax
- $1,739 · $145/mo
- Projected year-2 tax
- $1,739 · $145/mo
- Expected delta
- $0/yr ($0/mo · 0.0%)
ⓘ Screening estimate from a state-policy table — verify with the county assessor before closing.
Climate risk First Street
- Flood 1/10 Low FEMA zone X (unshaded) · 0% chance over 30 yrs
- Wildfire 1/10 Low
- Heat 4/10 Moderate 7 d/yr ≥101°F today · 18 d/yr by 30 yrs out
- Wind 2/10 Low 100% chance of damaging wind over 30 yrs
- Air quality 2/10 Low 1 unhealthy d/yr today · 3 by 30 yrs out
Nearby sold comps map
Loading sold comps map…
Walkable amenities ~0.75 mi
Loading nearby amenities…
Taxation est. · year 1
- Rental income
- $18,010
- − Mortgage interest
- −$10,503
- − Property taxes
- −$1,739
- − Insurance
- −$938
- − Repairs & maintenance
- −$1,441
- − Management
- −$1,441
- − Depreciation
- −$5,455
- Taxable loss
- −$3,505
- Est. tax savings @ 24.0%
- +$841
- After-tax cash flow
- $594/yr
For passive investors: Depreciation is non-cash, so a rental often shows a tax loss while cash-flowing — sheltering income. Rental losses are passive: they offset passive income freely, and up to $25,000/yr can offset ordinary (W-2) income if you actively participate and your MAGI is under $100k (phasing out to $0 by $150k); unused losses carry forward. On sale, claimed depreciation is recaptured at up to 25%, and gains may owe capital-gains tax (a 1031 exchange can defer both). Figures are a year-1 estimate at your 24.0% rate — not tax advice; consult a CPA.
Schools (NCES district)
- District
- Erlanger-Elsmere Independent
- NCES district ID
- 2101740
- Math proficiency
- 21% ▼ -10.00%
- Reading proficiency
- 32% ▼ -11.00%
- Median HH income
- $47,377
- Composite
- 23.01/100
- National rank
- #7975
- State rank
- #128 of 165 in KY
Livability — Elsmere
- Score
- 72/100
- State rank
- #121
- US rank
- #5733
Category grades
Schools grade is shown separately in the Schools card above.
Census & demographics
- Census place
- Elsmere, KY
- County
- Kenton County · 142,881 people
- City population
- 28,707
- Metro
- Cincinnati, OH-KY-IN
- Population (ZIP)
- 28,940
- Household income
- $68,605
- Rent vs Own
- Severe rent burden
- 678.0
Population outlook (Kenton County) Hauer SSP2
- Today (2025)
- 174,205 people
- By 2030
- 177,897 · +2.1%
- By 2040
- 182,671 · +4.9%
- By 2050
- 183,543 · +5.4%
- By 2075
- 178,977 · +2.7%
- By 2100
- 159,920 · -8.2%
Race, ethnicity, and origin ACS 2023
- Neighborhood character
- Predominantly White (83%)
- Race & ethnicity
- White 83% Two or more races 7% Hispanic / Latino 5% Black 5% Asian 1%
- Hispanic origin (detail)
- Mexican 3%
- Common ancestry
- Slovak 3% Italian 2% Lithuanian 1%
- Foreign-born
- 4% · Canada, Vietnam
- Languages at home
- 94% English-only · Spanish 4%
Political lean MEDSL · Kenton
- 2024 margin
- Strong R (+21.7) · D 38.2% · R 59.9% · Other 1.9%
- 2008→2024 swing
- -0.9pp no change · 2008: -20.9pp · 2024: -21.7pp
- All cycles
- 2024: R+21.7 2020: R+19.3 2016: R+26.1 2012: R+24.3 2008: R+20.9
Not yet ingested
- Civics
- —
Market trends
- HPI YoY
- ▼ -211.57%
- Current HPI
- 215.9599
- Rent YoY
- ▲ 4.22%
- Metro
- Cincinnati, OH-KY-IN
- State GDP YoY
- ▲ 1.81%
- F500 in state
- 4
Industry mix (Fortune 500 HQ in KY)
| Industry | F500 HQs | Revenue |
|---|---|---|
| Healthcare | 1 | $118B |
|
||
| Food / Beverage | 1 | $7B |
|
||
Price history
2 events — show timeline
- 2026-05-05 Pending — NKMLS
- 2026-04-30 Listed $187,500 NKMLS
Property tax history
+1.9%/yrLatest (2025): $1,739 · -3.3% YoY. Source: county tax records.
Cash-flow waterfall
monthlySold comps — $/sqft
last 12 mo · ≤1 miLoading sold comps…