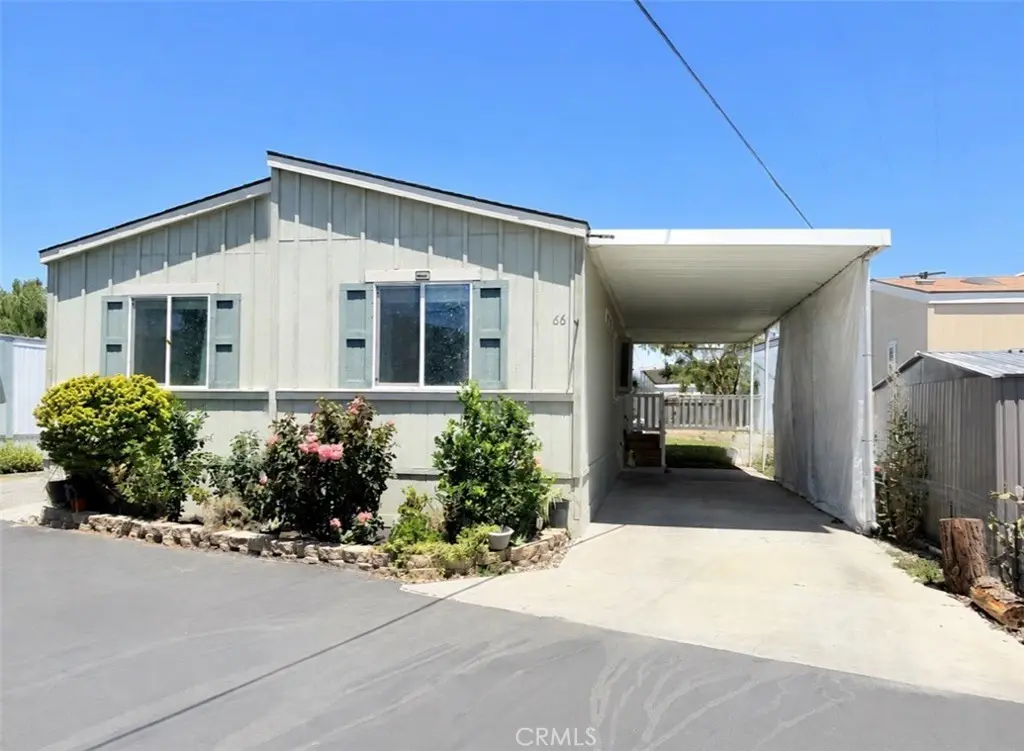
220 S Elk #66 · Hemet, CA
Flood risk 1/10 · Minimal
- FEMA flood zone
- X (unshaded)
- Chance of flooding over 30 yrs
- 0.0%
- Est. flood insurance / yr
- $507 – $1,088
Fire risk 2/10 · Minimal
- Est. fire insurance / yr
- $659 – $1,223
Heat risk 7/10 · Major
- Hot days now (above 104°F)
- 7 days/yr
- Hot days in 30 yrs
- 19 days/yr
Wind risk 1/10 · Minimal
- Chance of severe wind over 30 yrs
- —
Air-quality risk 6/10 · Moderate
- Unhealthy air days now
- 9 days/yr
- Unhealthy air days in 30 yrs
- 11 days/yr
Risk factors via First Street. Map © Google.
Why this score? — see what drove the C+ grade
The composite is a weighted blend of 9 inputs, each scored 0–100. Each bar is that input's sub-score; the figure is the points it added to the 100-point composite (weight × sub-score).
- Cash flow +30.0/30.0
- 1% rule +10.0/10.0
- DSCR +10.0/10.0
- Rent growth +2.9/5.0
- ARV discount +2.7/15.0
- Livability +2.6/5.0
- Schools +2.5/10.0
- Condition / age +2.5/5.0
- Appreciation +0.0/10.0
$110,000
🖨 Deal sheet 📄 Offer letter ✓ Due diligence
Listing remarks
Welcome home to this affordable and well-maintained 2014 manufactured home located in the gated community of Mirage Estates. Offering 3 bedrooms and 2 bathrooms, this inviting home features an open and functional floor plan perfect for families or anyone seeking comfortable living. The kitchen comes equipped with all appliances, and the sale includes the refrigerator, stove, microwave, dishwasher, washer, and dryer for added convenience. Enjoy covered carport parking and access to fantastic community amenities including a sparkling pool and spa, BBQ area, playground, and beautifully maintained common pool area. Conveniently located near shopping, dining, schools, and everyday services, this
Key facts
- Gated community
- Move-in ready
- Community amenities
Tags
Property features AI
Finance
- Other: Manager approval required for residency; Pets allowed
- HOA & community: Land lease: $792 per month; Park amenities include pool and park
Exterior
- Parking: Located in Mirage Estates park
- Security: Gated community
- Utilities: Public sewer; District/public water
- Home design: Single-story; Entry on level 1; Model: Community series; Mobile home remains on site
- Construction: 22 ft wide by 46 ft long mobile unit; Year built source: Assessor
- Exterior features: Awning; Community pool
Interior
- Kitchen: Dishwasher
- Bedrooms: All bedrooms on main level
- Flooring: Vinyl
- Bathrooms: 2 full bathrooms
- Heating & cooling: Central furnace heating
- Interior features: Ceiling fan; Open floor plan; Gated community; Community spa
- Laundry & utility: Inside laundry with washer and dryer included
Neighborhood map
What this means for you Summary
Snapshot
- This is a 2-bed/2.0-bath manufactured listed at $110k.
Deal economics
- At list price, monthly cash flow is $777 ($9k/yr) — positive.
- The deal already cash-flows at list — no discount required.
- Meets the 1% rule at list price ($2k rent vs $110k).
- Cap rate 14.8% vs local median 4.9% in Hemet — top-decile yield for the area; either an underpriced asset or a hidden risk that comps aren't pricing in. Stress-test before assuming the spread holds.
Location & tenants
- Location reads 51/100 on livability (#1,056 in CA) — a working-class tenant base; expect higher turnover. Strengths: housing A+; Watch: crime D+, schools F, amenities F.
- Hemet Unified (suburban): math 19% / reading 41% proficiency, ranked #360 of 517 in CA (top 70%) — families likely to look elsewhere, expect single-tenant / working-renter base with shorter leases; 66% free/reduced lunch — lower-income household profile, screen leases tightly.
- Market conditions: Rents rising (+1.8%/yr); 264 active listings in the ZIP; 40 comparable units currently listed for rent nearby; rentals at typical pace (median 24d on market — plan ~3-4 weeks tenant-placement turnaround); 9,195 units permitted in Riverside County in 2024 (1,512 in 5+ unit buildings).
- This rent runs 44% of the median local income ($49k/yr) — at the standard rent-burdened threshold; future hikes will face affordability resistance.
Forward outlook
- Local home prices are declining (-3.0%/yr); year-one equity from $761 of loan paydown is wiped out by about $3k of value loss. Plan a longer hold.
- Riverside County population projected at +22% by 2050 — long-run rental-demand tailwind backs the buy-and-hold thesis.
- At projected returns (-3.0% appreciation + 1.8% rent growth), your $31k cash investment doubles in ~5 years — after that, you're playing with house money.
Negotiation context
- Only 13 days on market — expect competitive offers; lowballing is unlikely to land.
- 2 sale attempts since 15y ago with the ask held roughly flat each time — persistent listings suggest the price (not the market) is what's stuck; bring a comps-based counter.
Risks & watch-outs
- Climate carrying-cost: extreme-heat days projected 7→19/yr by 2055 (HVAC capex compounding) — expect insurance premiums to compound above CPI over the hold.
Questions for the listing agent
- Is there a deadline driving the sale (1031 exchange, divorce, estate, relocation)? That informs how much negotiation room exists.
- Schools are F-rated, which usually means shorter tenancies and higher turnover. Who's the typical renter profile here, and what's been the actual vacancy rate?
- Crime grade is D in this area — have there been break-ins, vandalism, or insurance claims at this property in the last 3 years? What carrier currently insures it and at what premium?
- What's the average days-on-market for RENTAL listings here right now (not sales)? A rising rental-DOM trend means longer vacancies and softer asking-rent achievability than the comps imply.
- What's the recent tenant-quality profile in this submarket — average credit score on applications, eviction rate, late-payment / NSF rate, and stable-employment percentage? A property-management company in the area should have these aggregated.
- How much new for-sale + rental construction is in the pipeline within 1–3 miles? Heavy new supply typically softens prices + rents 12–24 months out; constrained supply supports both.
Investment metrics
- 1% rule
- 1.66% ✓
- Cap rate
- 14.77%
- Cash-on-cash
- 30.29%
- DSCR
- 2.35
- GRM
- 5.0
CMA / ARV
- ARV (on-the-fly)
- $99,360
- Comps found
- 12
Show comp detail 12 sales within ~0.75 mi
| Address | Dist | Beds/Ba | Sqft | Sold | Price | $/sf | Match |
|---|---|---|---|---|---|---|---|
| 1445 W Florida Ave #85 | 0.20mi | 2/2.0 | 1,040 (-4%) | 2mo | $96,000 | $92 | 84 |
| 1895 W Devonshire Ave #27 | 0.56mi | 2/2.0 | 1,040 (-4%) | 3mo | $45,000 | $43 | 65 |
| 360 Santa Clara Cir | 0.61mi | 2/2.0 | 1,120 (+4%) | 3mo | $224,000 | $200 | 63 |
| 190 Santa Lucia | 0.69mi | 2/2.0 | 1,040 (-4%) | 4mo | $179,000 | $172 | 59 |
| 220 San Carlos Dr | 0.64mi | 2/1.0 | 1,020 (-6%) | 2mo | $127,000 | $125 | 55 |
| 1380 Cabrillo | 0.70mi | 2/2.0 | 1,152 (+7%) | 2mo | $260,000 | $226 | 54 |
| 431 San Mateo Cir | 0.70mi | 3/2.0 (+1) | 1,040 (-4%) | 3mo | $118,000 | $113 | 54 |
| 770 S Lyon | 0.73mi | 2/2.0 | 1,152 (+7%) | 3mo | $78,900 | $68 | 52 |
| 430 N Palm #102 | 0.60mi | 2/1.5 | 1,200 (+11%) | 2mo | $45,000 | $38 | 50 |
| 575 S Lyon #110 | 0.57mi | 2/2.0 | 940 (-13%) | 2mo | $52,500 | $56 | 50 |
| 675 W Oakland Ave Unit G15 | 0.73mi | 2/2.0 | 960 (-11%) | 0mo | $70,000 | $73 | 47 |
| 460 San Mateo Cir | 0.71mi | 2/1.0 | 940 (-13%) | 3mo | $85,000 | $90 | 38 |
Match score weights: distance 35% · size 25% · config 20% · recency 20%. Top-matched comps best support the ARV.
Projected returns pro-forma
-3.0% appreciation · 1.76% rent growth · sell at horizon
- IRR
- 23.6%
- Equity multiple
- 1.95×
- Total profit
- $29,408
- Equity at exit
- $16,401
- IRR
- 30.7%
- Equity multiple
- 3.60×
- Total profit
- $80,226
- Equity at exit
- $9,511
Cash invested: $30,800 (down + closing). Projections, not guarantees.
Landlord ↔ Tenant lean methodology
- Overall (STATE)
- 18 Strongly Tenant-Friendly
- State California
- 18 Strongly Tenant-Friendly · D+13
- County
- — inherits STATE
- City
- — inherits STATE
ZIP-level market 92543
- Home prices YoY
- -26.7%
- Rents YoY
- 1.8%
- Active inventory
- 264
- Price-to-rent
- 5.0×
Monthly cashflow live
- Estimated rent
- $1,829 high interval (Pro) →
- Mortgage (P&I)
- −$577
- Tax from tax record
- −$45 /mo · $538/yr
- Insurance
- −$46
- HOA
- −$0
- Vacancy / Maint / Mgmt
- −$384
- Net cashflow
- $777
Break-even live
UW: 25.0% down · 7.5% · 30yr · 1.5% tax · 5.0% vac · 8.0% maint · 8.0% mgmt
Financing live
Cash to close
- Down payment
- $27,500
- Closing costs
- $3,300
- Reserves months
- —
- Total cash needed
- —
Loan-product check · same deal, 3 products live
Conventional
25% down · 7.5% · 30yr
- Down + closing
- —
- Monthly P&I
- —
- Monthly cashflow
- —
- DSCR
- —
- Eligible?
- —
Personal DTI + credit; lowest rate.
DSCR
20% down · 8.5% · 30yr
- Down + closing
- —
- Monthly P&I
- —
- Monthly cashflow
- —
- DSCR
- —
- Eligible?
- —
No personal income docs; deal must DSCR.
Hard money
10% down · 12.0% · 12mo
- Down + closing
- —
- Monthly P&I
- —
- Monthly cashflow
- —
- DSCR
- —
- Eligible?
- —
Short-term bridge; refi at stabilization.
Rent comps 40 comps
| Address | Beds | Baths | Sqft | Rent | $/sqft | DOM | Units | Dist |
|---|---|---|---|---|---|---|---|---|
| 1315 W Latham Ave Hemet, CA | 3.0 | 2.5 | 1340 | $2,550 | $1.90 | 43d | 1 | 0.26mi |
| 165 N Hamilton Ave Unit 3 Hemet, CA | 1.0 | 1.0 | 768 | $1,450 | $1.89 | 5d | 1 | 0.28mi |
| 165 N Hamilton Ave Unit 4 Hemet, CA | 1.0 | 1.0 | 768 | $1,525 | $1.99 | 21d | 1 | 0.28mi |
| 250 N Elk St Hemet, CA | 2.0 | 1.0 | 900 | $1,625 | $1.81 | 13d | 1 | 0.36mi |
| 1850 Amberwood Dr Hemet, CA | 2.0 | 2.0 | 1170 | $1,561 | $1.33 | 43d | 1 | 0.36mi |
| 1461 W Mayberry Ave Hemet, CA | 2.0 | 2.0 | 1044 | $1,750 | $1.68 | 43d | 1 | 0.38mi |
| 471 S Simpson Ave Unit D Hemet, CA | 2.0 | 2.0 | 900 | $1,750 | $1.94 | 43d | 1 | 0.39mi |
| 471 Whitney Dr Hemet, CA | 2.0 | 2.0 | 1085 | $1,800 | $1.66 | 5d | 1 | 0.40mi |
| 363 S Gilbert St Unit B Hemet, CA | 3.0 | 2.0 | 1200 | $1,900 | $1.58 | 13d | 1 | 0.48mi |
| 363 S Gilbert St Hemet, CA | 3.0 | 2.0 | 1200 | $1,900 | $1.58 | 3d | 1 | 0.48mi |
| 611 S Palm Ave Unit K Hemet, CA | 2.0 | 2.0 | 1254 | $1,895 | $1.51 | 7d | 1 | 0.49mi |
| 2098 W Acacia Ave Hemet, CA | 1.0–3.0 | 1.0–2.0 | 895 | $2,035 | $2.27 | 1d | 1 | 0.54mi |
| 1270 Rosalia Ave Unit 1 Hemet, CA | 2.0 | 1.0 | 900 | $1,800 | $2.00 | 43d | 1 | 0.56mi |
| 1521 W Westmont Ave Hemet, CA | 2.0 | 2.0 | 1197 | $2,000 | $1.67 | 43d | 1 | 0.58mi |
| 876 W Whittier Ave Unit 878 Hemet, CA | 2.0 | 2.0 | 1127 | $2,150 | $1.91 | 24d | 1 | 0.61mi |
| 446 N Elk St Unit D Hemet, CA | 2.0 | 1.0 | 980 | $1,675 | $1.71 | 24d | 1 | 0.63mi |
| 1887 Calle Amargosa Hemet, CA | 2.0 | 1.0 | 827 | $1,545 | $1.87 | 24d | 1 | 0.68mi |
| 101 San Mateo Cir Hemet, CA | 2.0 | 2.0 | 1152 | $1,725 | $1.50 | 16d | 1 | 0.70mi |
| 341 Calle Nogales Hemet, CA | 2.0 | 1.0 | 827 | $1,395 | $1.69 | 43d | 1 | 0.71mi |
| 120 Santa Lucia Dr Hemet, CA | 2.0 | 2.0 | 1197 | $1,600 | $1.34 | 43d | 1 | 0.73mi |
| 2403 W Acacia Ave Hemet, CA | 2.0 | 2.0 | 910 | $1,995 | $2.19 | 7d | 1 | 0.74mi |
| 2469 W Acacia Ave Hemet, CA | 2.0 | 2.0 | 910 | $1,750 | $1.92 | 24d | 1 | 0.76mi |
| 1862 Pueblo Dr Hemet, CA | 2.0 | 2.0 | 977 | $1,900 | $1.94 | 43d | 1 | 0.76mi |
| 1862 Pueblo Dr Unit 1862 Hemet, CA | 2.0 | 2.0 | 977 | $1,750 | $1.79 | 24d | 1 | 0.76mi |
| 735 S Gilbert St Hemet, CA | 3.0 | 2.0 | 1202 | $2,400 | $2.00 | 43d | 1 | 0.77mi |
| 2054 Avenida Olivos Hemet, CA | 2.0 | 1.0 | 820 | $1,500 | $1.83 | 43d | 1 | 0.79mi |
| 750 Santa Clara Cir Hemet, CA | 2.0 | 2.0 | 800 | $1,400 | $1.75 | 14d | 1 | 0.82mi |
| 663 Mariposa Dr Hemet, CA | 2.0 | 2.0 | 1440 | $1,500 | $1.04 | 24d | 1 | 0.82mi |
| 1964 W Oakland Ave Hemet, CA | 2.0 | 2.0 | 977 | $1,695 | $1.73 | 17d | 1 | 0.82mi |
| 893 S Palm Ave Hemet, CA | 2.0 | 2.0 | 720 | $1,375 | $1.91 | 4d | 1 | 0.83mi |
| 2120 San Bernardo Ave Hemet, CA | 2.0 | 1.0 | 827 | $2,100 | $2.54 | 43d | 1 | 0.84mi |
| 716 Robert Dr Hemet, CA | 3.0 | 2.0 | 1450 | $2,300 | $1.59 | 5d | 1 | 0.85mi |
| 627 Solano Dr Hemet, CA | 2.0 | 2.0 | 882 | $1,800 | $2.04 | 18d | 1 | 0.86mi |
| 2269 San Bernardo Ave Hemet, CA | 2.0 | 1.0 | 827 | $1,650 | $2.00 | 43d | 1 | 0.90mi |
| 683 Jonquil St Hemet, CA | 3.0 | 2.0 | 1150 | $2,448 | $2.13 | 24d | 1 | 0.94mi |
| 528 San Marino St Hemet, CA | 2.0 | 1.0 | 827 | $1,900 | $2.30 | 43d | 1 | 0.96mi |
| 1931 Nuevo St Hemet, CA | 2.0 | 1.0 | 820 | $1,600 | $1.95 | 43d | 1 | 0.96mi |
| 1933 Nuevo St Hemet, CA | 2.0 | 1.0 | 827 | $1,700 | $2.06 | 24d | 1 | 0.97mi |
| 1005 S Gilbert St Hemet, CA | 2.0 | 1.5 | 975 | $1,825 | $1.87 | 24d | 2 | 1.01mi |
| 529 E Latham Ave Hemet, CA | 3.0 | 1.0 | 1226 | $1,950 | $1.59 | 19d | 1 | 1.05mi |
Listing history 9 events
-
2026-06-18days on market $110,000 Active 13 DOM
-
2026-06-17days on market $110,000 Active 12 DOM
-
2026-06-16days on market $110,000 Active 11 DOM
-
2026-06-15days on market $110,000 Active 10 DOM
-
2026-06-13days on market $110,000 Active 8 DOM
-
2026-06-09days on market $110,000 Active 4 DOM
-
2026-06-08days on market $110,000 Active 3 DOM
-
2026-06-07remarks 699-char remark
-
2026-06-07$110,000 Active 2 DOM
ⓘ Source: listings_history table (triggers on properties + properties_extension) + one-shot
backfill from property_details.listing_events for pre-trigger history.
Tax reassessment forecast CA · Resets to sale price
- Current annual tax
- $538 · $45/mo
- Projected year-2 tax
- $836 · $70/mo
- Expected delta
- +$298/yr (+$25/mo · 55.3%)
ⓘ Screening estimate from a state-policy table — verify with the county assessor before closing.
Climate risk First Street
- Flood 1/10 Low FEMA zone X (unshaded) · 0% chance over 30 yrs
- Wildfire 2/10 Low
- Heat 7/10 Severe 7 d/yr ≥104°F today · 19 d/yr by 30 yrs out
- Wind 1/10 Low
- Air quality 6/10 Major 9 unhealthy d/yr today · 11 by 30 yrs out
Nearby sold comps map
Loading sold comps map…
Walkable amenities ~0.75 mi
Loading nearby amenities…
Taxation est. · year 1
- Rental income
- $21,949
- − Mortgage interest
- −$6,162
- − Property taxes
- −$538
- − Insurance
- −$550
- − Repairs & maintenance
- −$1,756
- − Management
- −$1,756
- − Depreciation
- −$3,200
- Taxable income
- $7,987
- Est. tax owed @ 24.0%
- −$1,917
- After-tax cash flow
- $7,412/yr
For passive investors: Depreciation is non-cash, so a rental often shows a tax loss while cash-flowing — sheltering income. Rental losses are passive: they offset passive income freely, and up to $25,000/yr can offset ordinary (W-2) income if you actively participate and your MAGI is under $100k (phasing out to $0 by $150k); unused losses carry forward. On sale, claimed depreciation is recaptured at up to 25%, and gains may owe capital-gains tax (a 1031 exchange can defer both). Figures are a year-1 estimate at your 24.0% rate — not tax advice; consult a CPA.
Schools (NCES district)
- District
- Hemet Unified
- NCES district ID
- 0616920
- Math proficiency
- 19% ▼ -3.00%
- Reading proficiency
- 41% ▲ 4.00%
- Median HH income
- $39,962
- Composite
- 25.16/100
- National rank
- #7517
- State rank
- #360 of 517 in CA
Livability — Hemet
- Score
- 51/100
- State rank
- #1056
- US rank
- #25208
Category grades
Schools grade is shown separately in the Schools card above.
Census & demographics
- Census place
- Hemet, CA
- County
- Riverside County · 2,287,001 people
- City population
- 137,670
- Metro
- Riverside-San Bernardino-Ontario, CA
- Population (ZIP)
- 39,937
- Household income
- $49,396
- Rent vs Own
- Severe rent burden
- 2144.0
Population outlook (Riverside County) Hauer SSP2
- Today (2025)
- 2,664,475 people
- By 2030
- 2,802,692 · +5.2%
- By 2040
- 3,050,904 · +14.5%
- By 2050
- 3,256,783 · +22.2%
- By 2075
- 3,655,058 · +37.2%
- By 2100
- 3,766,594 · +41.4%
Race, ethnicity, and origin ACS 2023
- Neighborhood character
- Diverse neighborhood (Simpson 0.61)
- Race & ethnicity
- Hispanic / Latino 54% White 30% Two or more races 18% Black 10% Native American 2% Asian 2%
- Hispanic origin (detail)
- Mexican 48% Puerto Rican 1%
- Common ancestry
- Slovak 1% Romanian 1% Portuguese 1%
- Foreign-born
- 21% · Canada
- Languages at home
- 59% English-only · Spanish 38% Arabic 1% Tagalog/Filipino 1%
Political lean MEDSL · Riverside
- 2024 margin
- Toss-up / Even · D 48.0% · R 49.3% · Other 2.6%
- 2008→2024 swing
- -3.6pp toward R · 2008: 2.3pp · 2024: -1.3pp
- All cycles
- 2024: R+1.3 2020: D+8.0 2016: D+4.3 2012: R+0.4 2008: D+2.3
Not yet ingested
- Civics
- —
Market trends
- HPI YoY
- ▼ -147.46%
- Current HPI
- 405.1277
- Rent YoY
- ▲ 1.76%
- Metro
- Riverside-San Bernardino-Ontario, CA
- State GDP YoY
- ▲ 3.21%
- F500 in state
- 116
Industry mix (Fortune 500 HQ in CA)
| Industry | F500 HQs | Revenue |
|---|---|---|
| Technology | 27 | $1,492B |
|
||
| Financial Services | 3 | $174B |
|
||
| Retail | 3 | $44B |
|
||
| Insurance | 3 | $26B |
|
||
| Media / Entertainment | 2 | $115B |
|
||
| Pharmaceuticals / Biotech | 2 | $62B |
|
||
Price history
+124.5% since first listed3 events — show timeline
- 2026-06-05 Listed $110,000 CRMLS
- 2011-09-22 Listing Removed — CRMLS
- 2011-06-28 Listed $49,000 CRMLS
Property tax history
-1.9%/yrLatest (2025): $538 · +2.0% YoY. Source: county tax records.
Cash-flow waterfall
monthlySold comps — $/sqft
last 12 mo · ≤1 miLoading sold comps…