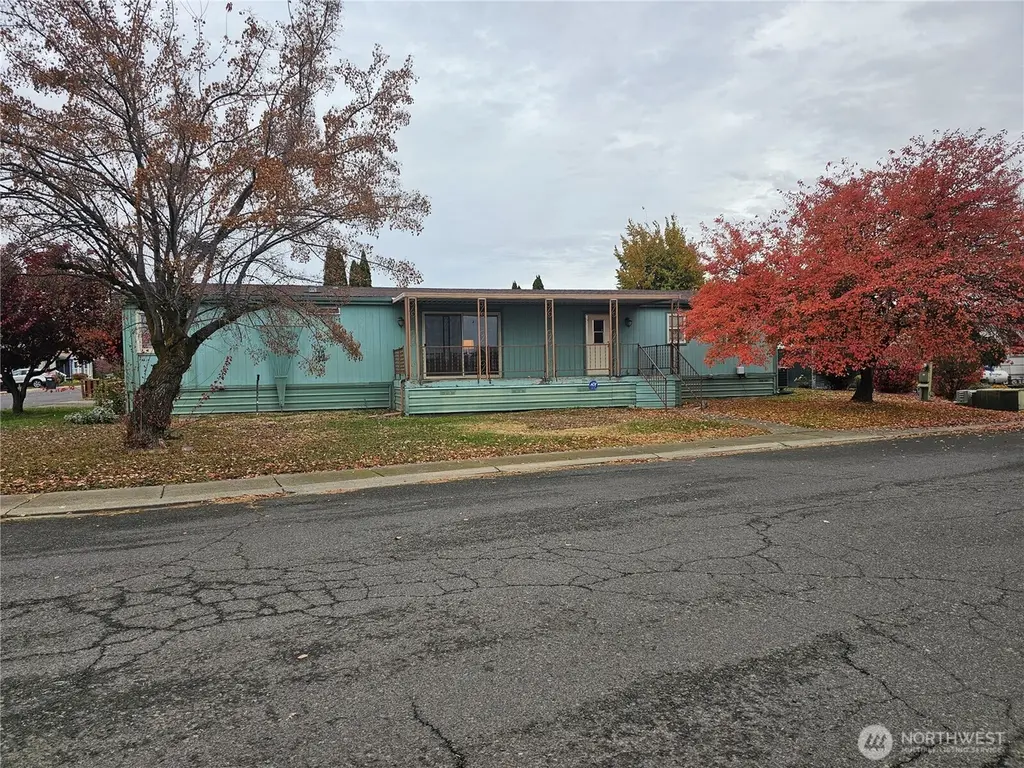
923 NE Belroy · College Place, WA
Flood risk 1/10 · Minimal
- FEMA flood zone
- —
- Chance of flooding over 30 yrs
- 0.0%
- Est. flood insurance / yr
- —
Fire risk 3/10 · Minor
- Est. fire insurance / yr
- $604 – $1,122
Heat risk 4/10 · Minor
- Hot days now (above 98°F)
- 7 days/yr
- Hot days in 30 yrs
- 15 days/yr
Wind risk 1/10 · Minimal
- Chance of severe wind over 30 yrs
- —
Air-quality risk 8/10 · Major
- Unhealthy air days now
- 11 days/yr
- Unhealthy air days in 30 yrs
- 14 days/yr
Risk factors via First Street. Map © Google.
Why this score? — see what drove the C grade
The composite is a weighted blend of 9 inputs, each scored 0–100. Each bar is that input's sub-score; the figure is the points it added to the 100-point composite (weight × sub-score).
- Cash flow +26.1/30.0
- DSCR +8.8/10.0
- 1% rule +6.9/10.0
- Schools +4.1/10.0
- Livability +4.1/5.0
- Rent growth +2.5/5.0
- Condition / age +2.5/5.0
- ARV discount +1.0/15.0
- Appreciation +0.0/10.0
$152,000
🖨 Deal sheet 📄 Offer letter ✓ Due diligence
Listing remarks
This triple wide mobile home will truly amaze you with the room it provides you. There is ample space in the living room for all your furniture and a big TV plus sliding doors off to covered deck, and a dining room big enough for your table. Kitchen seats several at the island in the middle of the room and has a door off to another deck to catch that summer breeze. A nice sized shed sits outside the kitchen door for easy access to your storage space. Yard is fenced around shed and has ample room for a garden and a pet. Driveway has 1 covered space and 1 uncovered. New HVAC-AC system installed just last July. This a must see.
Key facts
- Covered deck
- New hvac-ac system
- Fenced yard
Tags
Neighborhood map
What this means for you Summary
Snapshot
- This is a 3-bed/2.0-bath manufactured listed at $152k.
Deal economics
- At list price, monthly cash flow is $384 ($5k/yr) — positive.
- The deal already cash-flows at list — no discount required.
- Meets the 1% rule at list price ($2k rent vs $152k).
- Recommended offer: $143k (6.0% below list) — sets the bar for market timing.
- Cap rate 9.3% vs local median 2.5% in College Place — top-decile yield for the area; either an underpriced asset or a hidden risk that comps aren't pricing in. Stress-test before assuming the spread holds.
Location & tenants
- Location reads 82/100 on livability (#71 in WA, #1,277 nationally) — a professional / high-income tenant draw. Strengths: commute A+, housing A+, health & safety A+; Watch: employment D, amenities D-.
- Walla Walla Public Schools (urban): math 41% / reading 50% proficiency, ranked #179 of 291 in WA (top 62%) — families likely to look elsewhere, expect single-tenant / working-renter base with shorter leases.
- Market conditions: 103 active listings in the ZIP; 17 comparable units currently listed for rent nearby; rentals lingering (median 44d on market — plan ~5-8 weeks vacancy on turnover, expect pricing pressure); 100% of comp listings sitting > 30 days — soft ceiling on asking rent; 206 units permitted in Walla Walla County in 2024 (50 in 5+ unit buildings).
- This rent runs 35% of the median local income ($63k/yr) — at the standard rent-burdened threshold; future hikes will face affordability resistance.
Forward outlook
- Local home prices are declining (-3.0%/yr); year-one equity from $1k of loan paydown is wiped out by about $5k of value loss. Plan a longer hold.
- Walla Walla County population projected at +8% by 2050 — modest demand growth; plan on rents tracking national, not racing it.
- At projected returns (-3.0% appreciation + 3.0% rent growth), your $43k cash investment doubles in ~10 years — after that, you're playing with house money.
Negotiation context
- It's been on market 76 days — a 6% lower offer ($143k) is reasonable based on typical stale-listing flexibility.
- 3 sale attempts since 12y ago; this cycle's ask has dropped $8k (5%) from the opening price — seller is motivated, your offer sets the floor, not the list.
- Current owner paid $50k; list at $152k implies a 204% gain — meaningful room to come down on a strong offer.
Questions for the listing agent
- It's been on market 76 days. Have you received any prior offers? Is the seller open to a 6% concession, seller financing, or rate buy-down credit?
- Why hasn't it sold? Are there any deal-killer items the seller is aware of (foundation, flood, title, zoning, code violations)?
- Is there a deadline driving the sale (1031 exchange, divorce, estate, relocation)? That informs how much negotiation room exists.
- What's the average days-on-market for RENTAL listings here right now (not sales)? A rising rental-DOM trend means longer vacancies and softer asking-rent achievability than the comps imply.
- What's the recent tenant-quality profile in this submarket — average credit score on applications, eviction rate, late-payment / NSF rate, and stable-employment percentage? A property-management company in the area should have these aggregated.
- How much new for-sale + rental construction is in the pipeline within 1–3 miles? Heavy new supply typically softens prices + rents 12–24 months out; constrained supply supports both.
Investment metrics
- 1% rule
- 1.19% ✓
- Cap rate
- 9.33%
- Cash-on-cash
- 10.84%
- DSCR
- 1.48
- GRM
- 7.0
CMA / ARV
- ARV (median comp)
- $132,765
- List price
- $152,000
- Delta
- 14.49%
- Verdict
- OVERPRICED
- Comps
- 10 within 1.0 mi
Show comp detail 7 sales within ~0.75 mi
| Address | Dist | Beds/Ba | Sqft | Sold | Price | $/sf | Match |
|---|---|---|---|---|---|---|---|
| 1333 Rancho Villa | 0.05mi | 3/2.0 | 1,248 (-4%) | 6mo | $137,350 | $110 | 86 |
| 545 NE Troutdale Ave | 0.10mi | 3/2.0 | 1,406 (+8%) | 9mo | $130,000 | $92 | 74 |
| 925 NE Chelan | 0.04mi | 3/2.0 | 1,344 (+4%) | 23mo | $130,000 | $97 | 72 |
| 67 Jade St | 0.62mi | 3/2.0 | 1,344 (+4%) | 2mo | $107,000 | $80 | 63 |
| 1346 Rancho Villa Dr | 0.06mi | 3/2.0 | 1,432 (+10%) | 24mo | $170,000 | $119 | 60 |
| 840 NE Karol Loop | 0.54mi | 3/2.0 | 1,148 (-11%) | 4mo | $126,000 | $110 | 53 |
| 831 NE Dawson St | 0.25mi | 2/2.0 (-1) | 1,116 (-14%) | 16mo | $32,000 | $29 | 47 |
Match score weights: distance 35% · size 25% · config 20% · recency 20%. Top-matched comps best support the ARV.
Projected returns pro-forma
-3.0% appreciation · 3.0% rent growth · sell at horizon
- IRR
- -0.1%
- Equity multiple
- 1.00×
- Total profit
- $-117
- Equity at exit
- $22,664
- IRR
- 9.6%
- Equity multiple
- 1.74×
- Total profit
- $31,539
- Equity at exit
- $13,142
Cash invested: $42,560 (down + closing). Projections, not guarantees.
Landlord ↔ Tenant lean methodology
- Overall (STATE)
- 28 Tenant-Leaning
- State Washington
- 28 Tenant-Leaning · D+8
- County
- — inherits STATE
- City
- — inherits STATE
ZIP-level market 99324
- Home prices YoY
- -17.6%
- Active inventory
- 103
- Price-to-rent
- 7.0×
Monthly cashflow live
- Estimated rent
- $1,816 high interval (Pro) →
- Mortgage (P&I)
- −$797
- Tax est. 1.5%
- −$190 /mo · $2,280/yr
- Insurance
- −$63
- HOA
- −$0
- Vacancy / Maint / Mgmt
- −$381
- Net cashflow
- $384
Break-even live
UW: 25.0% down · 7.5% · 30yr · 1.5% tax · 5.0% vac · 8.0% maint · 8.0% mgmt
Financing live
Cash to close
- Down payment
- $38,000
- Closing costs
- $4,560
- Reserves months
- —
- Total cash needed
- —
Loan-product check · same deal, 3 products live
Conventional
25% down · 7.5% · 30yr
- Down + closing
- —
- Monthly P&I
- —
- Monthly cashflow
- —
- DSCR
- —
- Eligible?
- —
Personal DTI + credit; lowest rate.
DSCR
20% down · 8.5% · 30yr
- Down + closing
- —
- Monthly P&I
- —
- Monthly cashflow
- —
- DSCR
- —
- Eligible?
- —
No personal income docs; deal must DSCR.
Hard money
10% down · 12.0% · 12mo
- Down + closing
- —
- Monthly P&I
- —
- Monthly cashflow
- —
- DSCR
- —
- Eligible?
- —
Short-term bridge; refi at stabilization.
Rent comps 17 comps
| Address | Beds | Baths | Sqft | Rent | $/sqft | DOM | Units | Dist |
|---|---|---|---|---|---|---|---|---|
| 942 NE Spitzenburg St Apt B104 College Place, WA | 2.0 | 1.5 | 975 | $1,530 | $1.57 | 43d | 1 | 0.30mi |
| 255 Elder Pl #3 College Place, WA | 2.0 | 1.0 | 889 | $1,415 | $1.59 | 43d | 1 | 0.54mi |
| 22 NE Hadley Way #1 College Place, WA | 2.0 | 2.5 | 1150 | $2,095 | $1.82 | 43d | 1 | 0.56mi |
| 265 Avery St Walla Walla, WA | 3.0 | 2.5 | 1268 | $1,995 | $1.57 | 43d | 1 | 0.62mi |
| 70 NE Rose St Unit B College Place, WA | 3.0 | 1.0 | 1500 | $1,300 | $0.87 | 43d | 1 | 0.63mi |
| 218 E Whitman Dr Unit 1 College Place, WA | 4.0 | 2.5 | 1485 | $2,240 | $1.51 | 43d | 1 | 0.78mi |
| 310 SE 3rd St Unit 4 College Place, WA | 2.0 | 1.0 | 1300 | $1,300 | $1.00 | 43d | 1 | 0.93mi |
| 23 NW Earl Ln College Place, WA | 3.0 | 2.5 | 1600 | $1,845 | $1.15 | 43d | 1 | 1.04mi |
| 24 SE 4th St College Place, WA | 3.0 | 1.0 | 1270 | $2,045 | $1.61 | 43d | 1 | 1.06mi |
| 512 S College Ave #1 College Place, WA | 3.0 | 1.0 | 1328 | $1,785 | $1.34 | 43d | 1 | 1.15mi |
| 623 W Whitman Dr Unit 623 Whitman College Place, WA | 2.0 | 1.5 | 900 | $1,575 | $1.75 | 43d | 1 | 1.25mi |
| 418 SW 4th St Unit C College Place, WA | 2.0 | 1.5 | 1150 | $1,595 | $1.39 | 43d | 1 | 1.28mi |
| 806 S College Ave College Place, WA | 1.0–2.0 | 1.0–2.0 | 738 | $1,750 | $2.37 | 43d | 3 | 1.30mi |
| 309 SW 6th St Apt 1 College Place, WA | 4.0 | 2.0 | 1350 | $1,739 | $1.29 | 43d | 1 | 1.32mi |
| 103 SW 9th St College Place, WA | 4.0 | 2.5 | 1616 | $2,095 | $1.30 | 43d | 1 | 1.38mi |
| 1005 SW Puff Ln College Place, WA | 2.0 | 1.0 | 890 | $1,100 | $1.24 | 43d | 1 | 1.42mi |
| 425 N 7th Ave Apt 2 Walla Walla, WA | 4.0 | 2.5 | 1697 | $1,795 | $1.06 | 43d | 1 | 1.46mi |
Listing history 8 events
-
2026-05-02status Pending
-
2026-03-27price $152,000
-
2026-02-15$160,000 Active
-
2020-07-08soldstatus $50,000
-
2020-04-03$54,900
-
2015-04-28soldstatus $35,000
-
2014-09-26$39,900
-
2006-03-24soldstatus $35,000
ⓘ Source: listings_history table (triggers on properties + properties_extension) + one-shot
backfill from property_details.listing_events for pre-trigger history.
Climate risk First Street
- Flood 1/10 Low 0% chance over 30 yrs
- Wildfire 3/10 Moderate
- Heat 4/10 Moderate 7 d/yr ≥98°F today · 15 d/yr by 30 yrs out
- Wind 1/10 Low
- Air quality 8/10 Severe 11 unhealthy d/yr today · 14 by 30 yrs out
Nearby sold comps map
Loading sold comps map…
Walkable amenities ~0.75 mi
Loading nearby amenities…
Taxation est. · year 1
- Rental income
- $21,796
- − Mortgage interest
- −$8,514
- − Property taxes
- −$2,280
- − Insurance
- −$760
- − Repairs & maintenance
- −$1,744
- − Management
- −$1,744
- − Depreciation
- −$4,422
- Taxable income
- $2,332
- Est. tax owed @ 24.0%
- −$560
- After-tax cash flow
- $4,054/yr
For passive investors: Depreciation is non-cash, so a rental often shows a tax loss while cash-flowing — sheltering income. Rental losses are passive: they offset passive income freely, and up to $25,000/yr can offset ordinary (W-2) income if you actively participate and your MAGI is under $100k (phasing out to $0 by $150k); unused losses carry forward. On sale, claimed depreciation is recaptured at up to 25%, and gains may owe capital-gains tax (a 1031 exchange can defer both). Figures are a year-1 estimate at your 24.0% rate — not tax advice; consult a CPA.
Schools (NCES district)
- District
- Walla Walla Public Schools
- NCES district ID
- 5309450
- Math proficiency
- 41% ▲ 3.00%
- Reading proficiency
- 50% ▼ -1.00%
- Median HH income
- $46,207
- Composite
- 40.88/100
- National rank
- #7531
- State rank
- #179 of 291 in WA
Livability — College Place
- Score
- 82/100
- State rank
- #71
- US rank
- #1277
Category grades
Schools grade is shown separately in the Schools card above.
Census & demographics
- Census place
- College Place, WA
- County
- Walla Walla County · 52,990 people
- City population
- 10,137
- Metro
- Walla Walla, WA
- Population (ZIP)
- 10,137
- Household income
- $62,839
- Rent vs Own
- Severe rent burden
- 400.0
Population outlook (Walla Walla County) Hauer SSP2
- Today (2025)
- 63,088 people
- By 2030
- 64,417 · +2.1%
- By 2040
- 66,563 · +5.5%
- By 2050
- 68,337 · +8.3%
- By 2075
- 73,235 · +16.1%
- By 2100
- 74,878 · +18.7%
Race, ethnicity, and origin ACS 2023
- Neighborhood character
- Predominantly White (72%)
- Race & ethnicity
- White 72% Hispanic / Latino 20% Two or more races 8% Asian 3%
- Hispanic origin (detail)
- Mexican 16%
- Common ancestry
- Italian 6% Lithuanian 4% Portuguese 4%
- Foreign-born
- 9% · Canada, China
- Languages at home
- 84% English-only · Spanish 12% French/Haitian/Cajun 1% Other Asian/Pacific 1%
Political lean MEDSL · Walla Walla
- 2024 margin
- Lean R (+8.1) · D 44.6% · R 52.7% · Other 2.7%
- 2008→2024 swing
- +8.5pp toward D · 2008: -16.6pp · 2024: -8.1pp
- All cycles
- 2024: R+8.1 2020: R+8.7 2016: R+16.4 2012: R+22.3 2008: R+16.6
Not yet ingested
- Civics
- —
Market trends
- HPI YoY
- ▼ -69.73%
- Current HPI
- 326.0923
- Rent YoY
- —
- Metro
- Walla Walla, WA
- State GDP YoY
- ▲ 4.65%
- F500 in state
- 22
Industry mix (Fortune 500 HQ in WA)
| Industry | F500 HQs | Revenue |
|---|---|---|
| Retail | 2 | $269B |
|
||
| Technology / Retail | 1 | $638B |
|
||
| Technology | 1 | $245B |
|
||
| Telecommunications | 1 | $38B |
|
||
| Food / Beverage | 1 | $36B |
|
||
| Automotive / Trucks | 1 | $34B |
|
||
Price history
+334.3% since first listed8 events — show timeline
- 2026-05-02 Pending — NWMLS as Distributed by MLS Grid
- 2026-03-27 Price Changed $152,000 NWMLS as Distributed by MLS Grid
- 2026-02-15 Listed $160,000 NWMLS as Distributed by MLS Grid
- 2020-07-08 Sold (MLS) $50,000 NWMLS as Distributed by MLS Grid
- 2020-04-03 Listed $54,900 NWMLS as Distributed by MLS Grid
- 2015-04-28 Sold (MLS) $35,000 NWMLS as Distributed by MLS Grid
- 2014-09-26 Listed $39,900 NWMLS as Distributed by MLS Grid
- 2006-03-24 Sold (Public Records) $35,000 Public Records
Property tax history
+17.4%/yrLatest (2026): $7 · +5.8% YoY. Source: county tax records.
Cash-flow waterfall
monthlySold comps — $/sqft
last 12 mo · ≤1 miLoading sold comps…