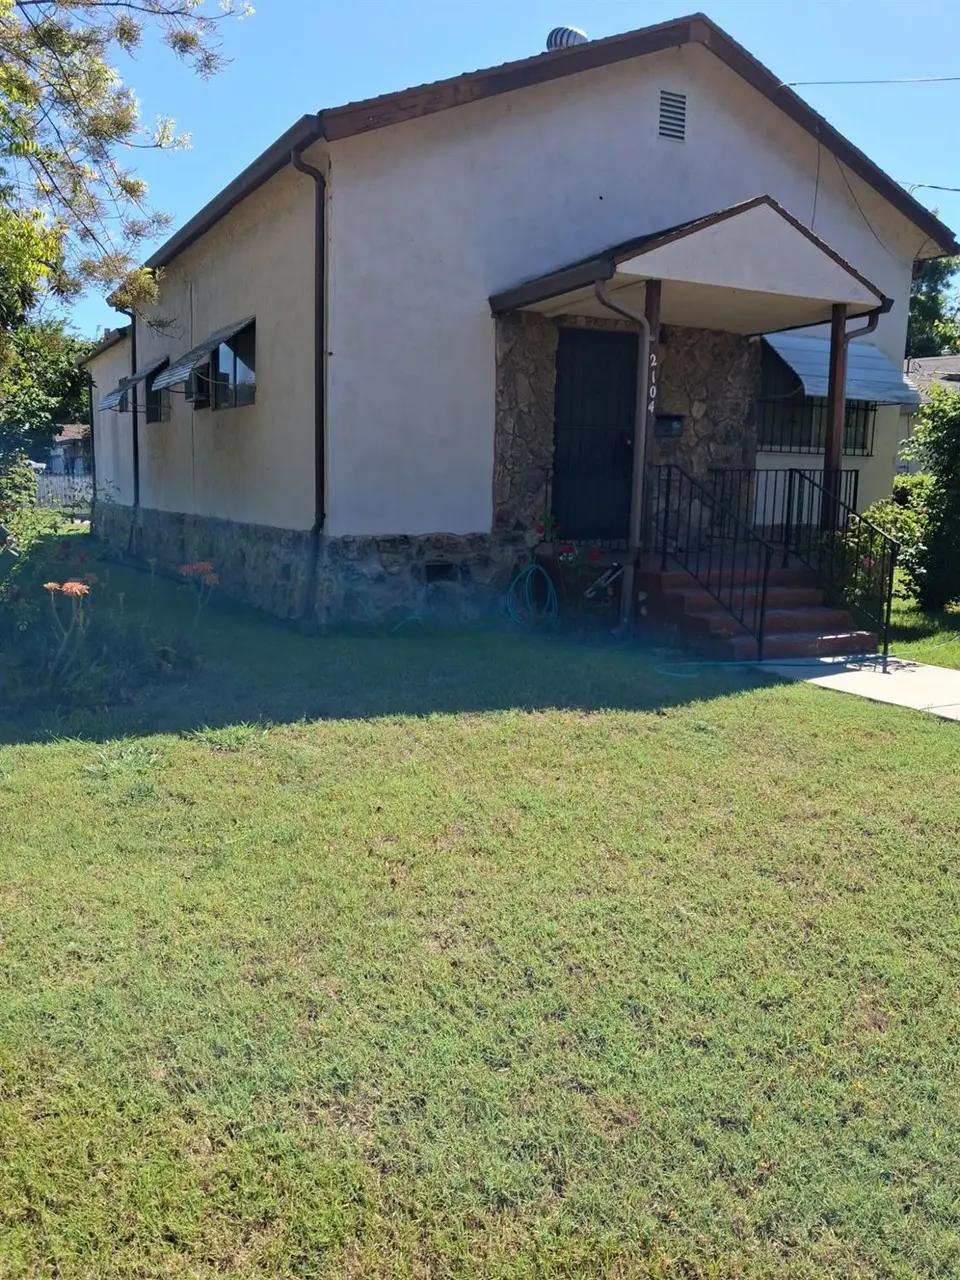
2104 S Union St · Stockton, CA
Flood risk 5/10 · Moderate
- FEMA flood zone
- X (shaded)
- Chance of flooding over 30 yrs
- 0.26%
- Est. flood insurance / yr
- $507 – $1,088
Fire risk 1/10 · Minimal
- Est. fire insurance / yr
- $659 – $1,223
Heat risk 7/10 · Major
- Hot days now (above 103°F)
- 7 days/yr
- Hot days in 30 yrs
- 15 days/yr
Wind risk 1/10 · Minimal
- Chance of severe wind over 30 yrs
- —
Air-quality risk 10/10 · Severe
- Unhealthy air days now
- 25 days/yr
- Unhealthy air days in 30 yrs
- 26 days/yr
Risk factors via First Street. Map © Google.
Why this score? — see what drove the D grade
The composite is a weighted blend of 9 inputs, each scored 0–100. Each bar is that input's sub-score; the figure is the points it added to the 100-point composite (weight × sub-score).
- ARV discount +15.0/15.0
- Cash flow +11.5/30.0
- DSCR +3.4/10.0
- 1% rule +3.3/10.0
- Schools +2.9/10.0
- Livability +2.9/5.0
- Condition / age +2.5/5.0
- Rent growth +2.4/5.0
- Appreciation +0.0/10.0
$235,950
🖨 Deal sheet (PDF) 📄 Offer letter ✓ Due diligence
Listing remarks
Plenty of parking here. Bring your boat or RV. This could be a great starter home. Close to schools and shopping.
Key facts
- Close to schools
- Plenty of parking
- Close to shopping
Tags
Neighborhood map
What this means for you Summary
Snapshot
- This is a 2-bed/1.0-bath single-family listed at $236k.
Deal economics
- At list price, monthly cash flow is $-76 ($-907/yr) — negative.
- To cash-flow at today's rent, offer at most $225k (4.6% below list).
- To meet the 1% rule (rent ≥ 1% of price), the offer needs to be $197k (16.6% below list).
- Recommended offer: $197k (16.6% below list) — sets the bar for 1% rule.
- Cap rate 5.9% vs local median 3.6% in Stockton — top-decile yield for the area; either an underpriced asset or a hidden risk that comps aren't pricing in. Stress-test before assuming the spread holds.
Location & tenants
- Location reads 57/100 on livability (#734 in CA) — a working-class tenant base; expect higher turnover. Strengths: housing A+, health & safety A, amenities A-; Watch: employment C-, crime F, commute F.
- Stockton Unified (urban): math 23% / reading 46% proficiency, ranked #295 of 517 in CA (top 57%) — families likely to look elsewhere, expect single-tenant / working-renter base with shorter leases; 78% free/reduced lunch — lower-income household profile, screen leases tightly.
- Zoned schools: Alexander Hamilton Elementary (719 students, 85% FRL); Edison High (math 20% / reading 41%, grade F, #710 of 1,170 statewide, top 61%, 2,558 students, 74% FRL) — zoned schools at 79% FRL track the district average.
- Market conditions: Rents soft (-0.6%/yr); 139 active listings in the ZIP; 5 comparable units currently listed for rent nearby; rentals at typical pace (median 25d on market — plan ~3-4 weeks tenant-placement turnaround); solid renter incomes; 3,779 units permitted in San Joaquin County in 2024 (0 in 5+ unit buildings).
Forward outlook
- Local home prices are declining (-3.0%/yr); year-one equity from $2k of loan paydown is wiped out by about $7k of value loss. Plan a longer hold.
- San Joaquin County population projected at +17% by 2050 — long-run rental-demand tailwind backs the buy-and-hold thesis.
Negotiation context
- It's been on market 76 days — a 6% lower offer ($222k) is reasonable based on typical stale-listing flexibility.
Risks & watch-outs
- Watch-outs: built in 1905 — expect roof / HVAC / electrical / plumbing capex.
- Climate carrying-cost: moderate flood risk; extreme-heat days projected 7→15/yr by 2055 (HVAC capex compounding) — expect insurance premiums to compound above CPI over the hold.
Questions for the listing agent
- What do current leases actually rent for vs. the listed asking? Can we see a recent rent roll and the last 12 months of T-12 income?
- It's been on market 76 days. Have you received any prior offers? Is the seller open to a 17% concession, seller financing, or rate buy-down credit?
- Built in 1905 — when were the roof, HVAC, electrical panel, plumbing, and water heater last replaced?
- Why hasn't it sold? Are there any deal-killer items the seller is aware of (foundation, flood, title, zoning, code violations)?
- Is there a deadline driving the sale (1031 exchange, divorce, estate, relocation)? That informs how much negotiation room exists.
- Schools are D-rated, which usually means shorter tenancies and higher turnover. Who's the typical renter profile here, and what's been the actual vacancy rate?
- Crime grade is F in this area — have there been break-ins, vandalism, or insurance claims at this property in the last 3 years? What carrier currently insures it and at what premium?
- The area grade is low — what's the realistic commute time and amenity access for the typical tenant pool here? Any planned neighborhood developments (good or bad) we should know about?
- What's the average days-on-market for RENTAL listings here right now (not sales)? A rising rental-DOM trend means longer vacancies and softer asking-rent achievability than the comps imply.
- What's the recent tenant-quality profile in this submarket — average credit score on applications, eviction rate, late-payment / NSF rate, and stable-employment percentage? A property-management company in the area should have these aggregated.
- How much new for-sale + rental construction is in the pipeline within 1–3 miles? Heavy new supply typically softens prices + rents 12–24 months out; constrained supply supports both.
Investment metrics
- 1% rule
- 0.83% ✗
- Cap rate
- 5.91%
- Cash-on-cash
- -1.37%
- DSCR
- 0.94
- GRM
- 10.0
CMA / ARV
- ARV (median comp)
- $336,687
- List price
- $235,950
- Delta
- -29.92%
- Verdict
- UNDERPRICED
- Comps
- 20 within 1.0 mi
Show comp detail 12 sales within ~0.75 mi
| Address | Dist | Beds/Ba | Sqft | Sold | Price | $/sf | Match |
|---|---|---|---|---|---|---|---|
| 2319 S Union St | 0.20mi | 2/1.0 | 986 (-6%) | 2mo | $318,000 | $323 | 80 |
| 2131 S Sacramento St | 0.09mi | 3/1.5 (+1) | 1,072 (+2%) | 9mo | $363,000 | $339 | 78 |
| 719 Hyde Ct | 0.29mi | 3/1.0 (+1) | 1,000 (-4%) | 4mo | $329,900 | $330 | 71 |
| 2020 S American St | 0.37mi | 2/1.0 | 962 (-8%) | 2mo | $320,000 | $333 | 68 |
| 1926 S San Joaquin St | 0.60mi | 3/2.0 (+1) | 1,011 (-3%) | 6mo | $448,000 | $443 | 52 |
| 2251 S American St | 0.39mi | 3/2.0 (+1) | 1,153 (+10%) | 8mo | $375,000 | $325 | 49 |
| 1743 S American St | 0.50mi | 2/1.0 | 1,164 (+11%) | 12mo | $329,000 | $283 | 48 |
| 1912 S Sutter St | 0.54mi | 2/1.0 | 1,167 (+12%) | 9mo | $325,000 | $278 | 48 |
| 2121 Scribner St | 0.55mi | 3/1.0 (+1) | 1,183 (+13%) | 2mo | $345,000 | $292 | 45 |
| 2012 S American St | 0.37mi | 3/1.0 (+1) | 893 (-15%) | 10mo | $360,000 | $403 | 45 |
| 2041 Superior St | 0.49mi | 3/1.0 (+1) | 1,199 (+14%) | 4mo | $240,000 | $200 | 44 |
| 2147 S San Joaquin St | 0.61mi | 3/1.0 (+1) | 1,132 (+8%) | 11mo | $326,000 | $288 | 44 |
Match score weights: distance 35% · size 25% · config 20% · recency 20%. Top-matched comps best support the ARV.
Projected returns pro-forma
-3.0% appreciation · 0.0% rent growth · sell at horizon
- IRR
- -22.0%
- Equity multiple
- 0.26×
- Total profit
- $-48,787
- Equity at exit
- $35,181
- IRR
- -25.6%
- Equity multiple
- -0.07×
- Total profit
- $-70,854
- Equity at exit
- $20,401
Cash invested: $66,066 (down + closing). Projections, not guarantees.
Landlord ↔ Tenant lean methodology
- Overall (STATE)
- 18 Strongly Tenant-Friendly
- State California
- 18 Strongly Tenant-Friendly · D+13
- County
- — inherits STATE
- City
- — inherits STATE
ZIP-level market 95206
- Rents YoY
- -0.6%
- Active inventory
- 139
- Price-to-rent
- 10.0×
Monthly cashflow live
- Estimated rent
- $1,968 high interval (Pro) →
- Mortgage (P&I)
- −$1,237
- Tax est. 1.5%
- −$295 /mo · $3,539/yr
- Insurance
- −$98
- HOA
- −$0
- Vacancy / Maint / Mgmt
- −$413
- Net cashflow
- $-76
Break-even live
Sensitivity live
| Price | -10% $87 | -5% $6 | +0% $-76 | +5% $-157 | +10% $-239 |
|---|---|---|---|---|---|
| Rent | -10% $-231 | -5% $-153 | +0% $-76 | +5% $2 | +10% $80 |
| Rate | -1.0pp $43 | -0.5pp $-16 | base $-76 | +0.5pp $-137 | +1.0pp $-199 |
UW: 25.0% down · 7.5% · 30yr · 1.5% tax · 5.0% vac · 8.0% maint · 8.0% mgmt
Financing live
Cash to close
- Down payment
- $58,988
- Closing costs
- $7,078
- Reserves months
- —
- Total cash needed
- —
Loan-product check · same deal, 3 products live
Conventional
25% down · 7.5% · 30yr
- Down + closing
- —
- Monthly P&I
- —
- Monthly cashflow
- —
- DSCR
- —
- Eligible?
- —
Personal DTI + credit; lowest rate.
DSCR
20% down · 8.5% · 30yr
- Down + closing
- —
- Monthly P&I
- —
- Monthly cashflow
- —
- DSCR
- —
- Eligible?
- —
No personal income docs; deal must DSCR.
Hard money
10% down · 12.0% · 12mo
- Down + closing
- —
- Monthly P&I
- —
- Monthly cashflow
- —
- DSCR
- —
- Eligible?
- —
Short-term bridge; refi at stabilization.
Rent comps 5 comps
| Address | Beds | Baths | Sqft | Rent | $/sqft | DOM | Units | Dist |
|---|---|---|---|---|---|---|---|---|
| 1446 S Aurora St Stockton, CA | 2.0 | 1.0 | 827 | $1,900 | $2.30 | 5d | 1 | 0.61mi |
| 114 E 4th St Stockton, CA | 2.0 | 1.0 | 950 | $1,750 | $1.84 | 25d | 1 | 0.79mi |
| 17 W 6th St Stockton, CA | 2.0 | 1.0 | 720 | $1,850 | $2.57 | 5d | 1 | 0.80mi |
| 137 W 3rd St Stockton, CA | 2.0 | 1.0 | 833 | $1,795 | $2.15 | 25d | 1 | 0.99mi |
| 521 S Sutter St Stockton, CA | 2.0 | 1.0 | 810 | $1,195 | $1.48 | 45d | 1 | 1.37mi |
Listing history 15 events
-
2026-06-21days on market $235,950 Active 76 DOM
-
2026-06-18days on market $235,950 Active 73 DOM
-
2026-06-17days on market $235,950 Active 72 DOM
-
2026-06-16pricedays on market $235,950 Active 71 DOM
-
2026-06-15days on market $240,000 Active 70 DOM
-
2026-06-14days on market $240,000 Active 68 DOM
-
2026-06-10days on market $240,000 Active 65 DOM
-
2026-06-09days on market $240,000 Active 64 DOM
-
2026-06-08days on market $240,000 Active 63 DOM
-
2026-06-07days on market $240,000 Active 62 DOM
-
2026-06-05days on market $240,000 Active 59 DOM
-
2026-06-03days on market $240,000 Active 58 DOM
-
2026-06-03days on market $240,000 Active 57 DOM
-
2026-06-01days on market $240,000 Active 56 DOM
-
2026-05-31days on market $240,000 Active 55 DOM
ⓘ Source: listings_history table (triggers on properties + properties_extension) + one-shot
backfill from property_details.listing_events for pre-trigger history.
Climate risk First Street
- Flood 5/10 Major FEMA zone X (shaded) · 26% chance over 30 yrs
- Wildfire 1/10 Low
- Heat 7/10 Severe 7 d/yr ≥103°F today · 15 d/yr by 30 yrs out
- Wind 1/10 Low
- Air quality 10/10 Extreme 25 unhealthy d/yr today · 26 by 30 yrs out
Nearby sold comps map
Loading sold comps map…
Walkable amenities ~0.75 mi
Loading nearby amenities…
Taxation est. · year 1
- Rental income
- $23,620
- − Mortgage interest
- −$13,217
- − Property taxes
- −$3,539
- − Insurance
- −$1,180
- − Repairs & maintenance
- −$1,890
- − Management
- −$1,890
- − Depreciation
- −$6,864
- Taxable loss
- −$4,959
- Est. tax savings @ 24.0%
- +$1,190
- After-tax cash flow
- $283/yr
For passive investors: Depreciation is non-cash, so a rental often shows a tax loss while cash-flowing — sheltering income. Rental losses are passive: they offset passive income freely, and up to $25,000/yr can offset ordinary (W-2) income if you actively participate and your MAGI is under $100k (phasing out to $0 by $150k); unused losses carry forward. On sale, claimed depreciation is recaptured at up to 25%, and gains may owe capital-gains tax (a 1031 exchange can defer both). Figures are a year-1 estimate at your 24.0% rate — not tax advice; consult a CPA.
Schools (NCES district)
- District
- Stockton Unified
- NCES district ID
- 0638010
- Math proficiency
- 23% ▲ 2.00%
- Reading proficiency
- 46% ▲ 16.00%
- Median HH income
- $37,563
- Composite
- 28.65/100
- National rank
- #6701
- State rank
- #295 of 517 in CA
Livability — Stockton
- Score
- 57/100
- State rank
- #734
- US rank
- #21638
Category grades
Schools grade is shown separately in the Schools card above.
Census & demographics
- Census place
- Stockton, CA
- County
- San Joaquin County · 729,570 people
- City population
- 332,006
- Metro
- Stockton, CA
- Population (ZIP)
- 68,558
- Household income
- $83,432
- Rent vs Own
- Severe rent burden
- 1459.0
Population outlook (San Joaquin County) Hauer SSP2
- Today (2025)
- 796,965 people
- By 2030
- 828,849 · +4.0%
- By 2040
- 885,611 · +11.1%
- By 2050
- 929,798 · +16.7%
- By 2075
- 994,578 · +24.8%
- By 2100
- 971,291 · +21.9%
Race, ethnicity, and origin ACS 2023
- Neighborhood character
- Diverse neighborhood (Simpson 0.59)
- Race & ethnicity
- Hispanic / Latino 60% Two or more races 20% Asian 18% Black 11% White 7% Native American 1%
- Hispanic origin (detail)
- Mexican 55%
- Common ancestry
- Swiss 1% Russian 1% Lithuanian 1%
- Foreign-born
- 35% · Canada, China, Vietnam
- Languages at home
- 39% English-only · Spanish 46% Tagalog/Filipino 6% Other Asian/Pacific 4%
Political lean MEDSL · San Joaquin
- 2024 margin
- Toss-up / Even · D 48.0% · R 48.9% · Other 3.0%
- 2008→2024 swing
- -11.6pp toward R · 2008: 10.7pp · 2024: -0.9pp
- All cycles
- 2024: R+0.9 2020: D+13.9 2016: D+12.9 2012: D+8.9 2008: D+10.7
Not yet ingested
- Civics
- —
Market trends
- HPI YoY
- ▼ -228.27%
- Current HPI
- 357.6069
- Rent YoY
- ▼ -0.55%
- Metro
- Stockton, CA
- State GDP YoY
- ▲ 3.21%
- F500 in state
- 116
Industry mix (Fortune 500 HQ in CA)
| Industry | F500 HQs | Revenue |
|---|---|---|
| Technology | 27 | $1,492B |
|
||
| Financial Services | 3 | $174B |
|
||
| Retail | 3 | $44B |
|
||
| Insurance | 3 | $26B |
|
||
| Media / Entertainment | 2 | $115B |
|
||
| Pharmaceuticals / Biotech | 2 | $62B |
|
||
Property tax history
+1.1%/yrLatest (2025): $326 · -19.2% YoY. Source: county tax records.
Cash-flow waterfall
monthlySold comps — $/sqft
last 12 mo · ≤1 miLoading sold comps…