 Fourplex
414 SW I St · Grants Pass, OR
Flood risk No data
- FEMA flood zone
- —
- Chance of flooding over 30 yrs
- —
- Est. flood insurance / yr
- —
Fire risk No data
- Est. fire insurance / yr
- —
Heat risk No data
- Hot days now (above threshold)
- —
- Hot days in 30 yrs
- —
Wind risk No data
- Chance of severe wind over 30 yrs
- —
Air-quality risk No data
- Unhealthy air days now
- —
- Unhealthy air days in 30 yrs
- —
Risk factors via First Street. Map © Google.
Why this score? — see what drove the F grade
The composite is a weighted blend of 9 inputs, each scored 0–100. Each bar is that input's sub-score; the figure is the points it added to the 100-point composite (weight × sub-score).
- Cash flow +7.9/30.0
- ARV discount +7.5/15.0
- Schools +4.2/10.0
- Livability +3.5/5.0
- Rent growth +3.0/5.0
- Condition / age +2.5/5.0
- 1% rule +2.4/10.0
- DSCR +2.0/10.0
- Appreciation +0.0/10.0
$675,000
🖨 Deal sheet 📄 Offer letter ✓ Due diligence
Multi-family units
County records classify this as Multi-Family (2-4 Unit). Listing-text estimate: 4 units. confirmed
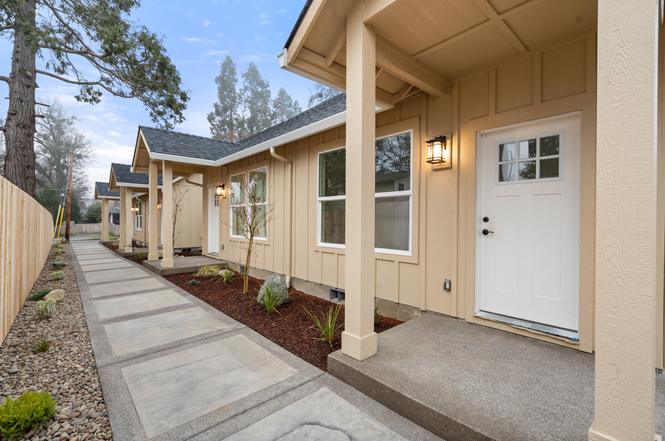
Listing remarks
New Construction 4-plex in Grants Pass This brand-new, meticulously built 4-plex offers a perfect blend of modern amenities and thoughtful design. Each unit features vaulted ceilings with oversized windows, creating an open and airy atmosphere, while granite countertops in the kitchen provide a sleek, contemporary touch. 100% waterproof luxury flooring throughout—perfect for durability and low-maintenance living and providing a true wood like look. Each unit features 1 bedroom and 1 bath, these homes are ideal for those seeking comfort and convenience only a short distance to downtown. Enjoy the outdoors with a large private back patio. The units are designed with high-quality finish
Key facts
- New construction
- Private back patio
- Vaulted ceilings
Tags
Neighborhood map
What this means for you Summary
Snapshot
- This is a 4 × 1-bed/1.0-bath units multifamily listed at $675k.
Deal economics
- At list price, monthly cash flow is $-705 ($-8k/yr) — negative. Per door: $-176/mo.
- To cash-flow at today's rent, offer at most $573k (15.1% below list).
- To meet the 1% rule (rent ≥ 1% of price), the offer needs to be $501k (25.7% below list).
- Recommended offer: $501k (25.7% below list) — sets the bar for 1% rule.
- Cap rate 5.0% vs local median 3.2% in Grants Pass — top-decile yield for the area; either an underpriced asset or a hidden risk that comps aren't pricing in. Stress-test before assuming the spread holds.
Location & tenants
- Location reads 70/100 on livability (#137 in OR) — a middle-class / working-renter tenant base. Strengths: amenities A+, health & safety A+, housing A-; Watch: employment D, crime F, commute F.
- Grants Pass SD 7 (urban): math 39% / reading 56% proficiency, ranked #66 of 183 in OR (top 36%) — families likely to look elsewhere, expect single-tenant / working-renter base with shorter leases.
- Zoned schools: Riverside Elementary School (math 24% / reading 24%, grade F, #320 of 412 statewide, top 82%, 403 students, 69% FRL); North Middle School (math 75% / reading 75%, grade A, #6 of 128 statewide, top 4%, 710 students, 69% FRL); Grants Pass High School (1,722 students, 68% FRL) — zoned schools average 68% FRL vs 53% district-wide (16 pts higher); higher-poverty schools than district average — tighter screening recommended.
- Market conditions: Rents rising (+2.0%/yr); 160 active listings in the ZIP; 223 units permitted in Josephine County in 2024 (5 in 5+ unit buildings).
- At $5,012/mo this rent would consume 99% of the median local household income ($61k/yr) (locally 1407% of renters already pay >50% of income on rent) — very limited rent-growth headroom before tenants either downsize or default.
Forward outlook
- Local home prices are declining (-3.0%/yr); year-one equity from $5k of loan paydown is wiped out by about $20k of value loss. Plan a longer hold.
- Josephine County population projected at +3% by 2050 — modest demand growth; plan on rents tracking national, not racing it.
Negotiation context
- It's been on market 153 days — a 12% lower offer ($594k) is reasonable based on typical stale-listing flexibility.
- 2 sale attempts; this cycle's ask is 48287% above the opening price — seller raised mid-cycle; expect resistance to lowballs.
Questions for the listing agent
- What do current leases actually rent for vs. the listed asking? Can we see a recent rent roll and the last 12 months of T-12 income?
- It's been on market 153 days. Have you received any prior offers? Is the seller open to a 26% concession, seller financing, or rate buy-down credit?
- Can we see the unit-by-unit rent roll, current vacancy, and any below-market leases? What's the average tenancy length?
- What capital expenditures (roof, boiler, parking lot, exteriors) have been made in the last 5 years, and what's planned in the next 2?
- Why hasn't it sold? Are there any deal-killer items the seller is aware of (foundation, flood, title, zoning, code violations)?
- Is there a deadline driving the sale (1031 exchange, divorce, estate, relocation)? That informs how much negotiation room exists.
- Schools are D-rated, which usually means shorter tenancies and higher turnover. Who's the typical renter profile here, and what's been the actual vacancy rate?
- Crime grade is F in this area — have there been break-ins, vandalism, or insurance claims at this property in the last 3 years? What carrier currently insures it and at what premium?
- The area grade is low — what's the realistic commute time and amenity access for the typical tenant pool here? Any planned neighborhood developments (good or bad) we should know about?
- What's the average days-on-market for RENTAL listings here right now (not sales)? A rising rental-DOM trend means longer vacancies and softer asking-rent achievability than the comps imply.
- What's the recent tenant-quality profile in this submarket — average credit score on applications, eviction rate, late-payment / NSF rate, and stable-employment percentage? A property-management company in the area should have these aggregated.
- How much new apartment / multifamily construction is in the pipeline within 1–3 miles? Heavy new supply (>2% of stock underway) typically softens rents 12–24 months out; light construction supports rent growth.
Investment metrics
- 1% rule
- 0.74% ✗
- Cap rate
- 5.04%
- Cash-on-cash
- -4.48%
- DSCR
- 0.80
- GRM
- 11.2
CMA / ARV
No comps found within radius.
Projected returns pro-forma
-3.0% appreciation · 2.04% rent growth · sell at horizon
- IRR
- -24.9%
- Equity multiple
- 0.16×
- Total profit
- $-159,020
- Equity at exit
- $100,645
- IRR
- -23.8%
- Equity multiple
- -0.14×
- Total profit
- $-215,308
- Equity at exit
- $58,362
Cash invested: $189,000 (down + closing). Projections, not guarantees.
Landlord ↔ Tenant lean methodology
- Overall (STATE)
- 28 Tenant-Leaning
- State Oregon
- 28 Tenant-Leaning · D+6
- County
- — inherits STATE
- City
- — inherits STATE
ZIP-level market 97526
- Rents YoY
- 2.0%
- Active inventory
- 160
- Price-to-rent
- 44.9×
Monthly cashflow live
- Estimated rent
- $5,012 medium interval (Pro) →
- Mortgage (P&I)
- −$3,540
- Tax est. 1.5%
- −$844 /mo · $10,125/yr
- Insurance
- −$281
- HOA
- −$0
- Vacancy / Maint / Mgmt
- −$1,053
- Net cashflow
- $-705
Break-even live
4-unit breakdown (identical units grouped — click to expand)
| Units | Beds | Baths | Est. rent |
|---|---|---|---|
| 4× units | 1 | 1 | $5,012 |
| #1 | 1 | 1 | $1,253 |
| #2 | 1 | 1 | $1,253 |
| #3 | 1 | 1 | $1,253 |
| #4 | 1 | 1 | $1,253 |
| Total (4 units) | $5,012 | ||
UW: 25.0% down · 7.5% · 30yr · 1.5% tax · 5.0% vac · 8.0% maint · 8.0% mgmt
Financing live
Cash to close
- Down payment
- $168,750
- Closing costs
- $20,250
- Reserves months
- —
- Total cash needed
- —
Loan-product check · same deal, 3 products live
Conventional
25% down · 7.5% · 30yr
- Down + closing
- —
- Monthly P&I
- —
- Monthly cashflow
- —
- DSCR
- —
- Eligible?
- —
Personal DTI + credit; lowest rate.
DSCR
20% down · 8.5% · 30yr
- Down + closing
- —
- Monthly P&I
- —
- Monthly cashflow
- —
- DSCR
- —
- Eligible?
- —
No personal income docs; deal must DSCR.
Hard money
10% down · 12.0% · 12mo
- Down + closing
- —
- Monthly P&I
- —
- Monthly cashflow
- —
- DSCR
- —
- Eligible?
- —
Short-term bridge; refi at stabilization.
Listing history 11 events
-
2026-04-26status Pending
-
2026-04-07price $675,000
-
2026-03-09historical $1,325
-
2026-02-18price $699,000
-
2026-02-06price $1,295
-
2026-02-04price $719,000
-
2026-02-01price $1,345
-
2026-01-20$1,395
-
2026-01-04price $720,000
-
2025-12-12price $725,000
-
2025-11-24$735,000 Active
ⓘ Source: listings_history table (triggers on properties + properties_extension) + one-shot
backfill from property_details.listing_events for pre-trigger history.
Nearby sold comps map
Loading sold comps map…
Walkable amenities ~0.75 mi
Loading nearby amenities…
Taxation est. · year 1
- Rental income
- $60,144
- − Mortgage interest
- −$37,810
- − Property taxes
- −$10,125
- − Insurance
- −$3,375
- − Repairs & maintenance
- −$4,812
- − Management
- −$4,812
- − Depreciation
- −$19,636
- Taxable loss
- −$20,426
- Est. tax savings @ 24.0%
- +$4,902
- After-tax cash flow
- $-3,561/yr
For passive investors: Depreciation is non-cash, so a rental often shows a tax loss while cash-flowing — sheltering income. Rental losses are passive: they offset passive income freely, and up to $25,000/yr can offset ordinary (W-2) income if you actively participate and your MAGI is under $100k (phasing out to $0 by $150k); unused losses carry forward. On sale, claimed depreciation is recaptured at up to 25%, and gains may owe capital-gains tax (a 1031 exchange can defer both). Figures are a year-1 estimate at your 24.0% rate — not tax advice; consult a CPA.
Schools (NCES district)
- District
- Grants Pass SD 7
- NCES district ID
- 4105910
- Math proficiency
- 39% ▲ 1.00%
- Reading proficiency
- 56% ▬ 0.00%
- Median HH income
- $36,433
- Composite
- 41.5/100
- National rank
- #7281
- State rank
- #66 of 183 in OR
Livability — Grants Pass
- Score
- 70/100
- State rank
- #137
- US rank
- #7900
Category grades
Schools grade is shown separately in the Schools card above.
Census & demographics
- Census place
- Grants Pass, OR
- County
- Josephine County · 73,366 people
- City population
- 73,366
- Metro
- Grants Pass, OR
- Population (ZIP)
- 36,036
- Household income
- $61,019
- Rent vs Own
- Severe rent burden
- 1407.0
Population outlook (Josephine County) Hauer SSP2
- Today (2025)
- 87,883 people
- By 2030
- 89,055 · +1.3%
- By 2040
- 90,396 · +2.9%
- By 2050
- 90,801 · +3.3%
- By 2075
- 89,880 · +2.3%
- By 2100
- 81,252 · -7.5%
Race, ethnicity, and origin ACS 2023
- Neighborhood character
- Predominantly White (84%)
- Race & ethnicity
- White 84% Two or more races 8% Hispanic / Latino 8%
- Hispanic origin (detail)
- Mexican 6%
- Common ancestry
- Portuguese 3% Slovak 3% Italian 2%
- Foreign-born
- 3% · Canada
- Languages at home
- 96% English-only · Spanish 2%
Political lean MEDSL · Josephine
- 2024 margin
- Strong R (+29.1) · D 34.2% · R 63.3% · Other 2.5%
- 2008→2024 swing
- -15.8pp toward R · 2008: -13.2pp · 2024: -29.1pp
- All cycles
- 2024: R+29.1 2020: R+25.8 2016: R+31.4 2012: R+21.9 2008: R+13.2
Not yet ingested
- Civics
- —
Market trends
- HPI YoY
- ▼ -257.77%
- Current HPI
- 326.3247
- Rent YoY
- ▲ 2.04%
- Metro
- Grants Pass, OR
- State GDP YoY
- ▲ 2.05%
- F500 in state
- 2
Industry mix (Fortune 500 HQ in OR)
| Industry | F500 HQs | Revenue |
|---|---|---|
| Consumer Goods | 1 | $51B |
|
||
Price history
-8.2% since first listed11 events — show timeline
- 2026-04-26 Pending — MLSCO
- 2026-04-07 Price Changed $675,000 MLSCO
- 2026-03-09 Rental Removed $1,325 RENTALBEAST
- 2026-02-18 Price Changed $699,000 MLSCO
- 2026-02-06 Price Changed $1,295 RENTALBEAST
- 2026-02-04 Price Changed $719,000 MLSCO
- 2026-02-01 Price Changed $1,345 RENTALBEAST
- 2026-01-20 Listed for Rent $1,395 RENTALBEAST
- 2026-01-04 Price Changed $720,000 MLSCO
- 2025-12-12 Price Changed $725,000 MLSCO
- 2025-11-24 Listed $735,000 MLSCO
Cash-flow waterfall
monthlySold comps — $/sqft
last 12 mo · ≤1 miLoading sold comps…