10489 Heber Springs Rd · Concord, AR
Flood risk 1/10 · Minimal
- FEMA flood zone
- X (unshaded)
- Chance of flooding over 30 yrs
- 0.0%
- Est. flood insurance / yr
- $507 – $1,088
Fire risk 4/10 · Minor
- Est. fire insurance / yr
- $1,499 – $2,785
Heat risk 4/10 · Minor
- Hot days now (above 105°F)
- 7 days/yr
- Hot days in 30 yrs
- 19 days/yr
Wind risk 3/10 · Minor
- Chance of severe wind over 30 yrs
- 4.0%
Air-quality risk 2/10 · Minimal
- Unhealthy air days now
- 0 days/yr
- Unhealthy air days in 30 yrs
- 1 days/yr
Risk factors via First Street. Map © Google.
Why this score? — see what drove the B grade
The composite is a weighted blend of 9 inputs, each scored 0–100. Each bar is that input's sub-score; the figure is the points it added to the 100-point composite (weight × sub-score).
- Cash flow +30.0/30.0
- 1% rule +10.0/10.0
- DSCR +10.0/10.0
- ARV discount +7.5/15.0
- Appreciation +5.0/10.0
- Schools +3.0/10.0
- Livability +2.8/5.0
- Rent growth +2.5/5.0
- Condition / age +2.5/5.0
$35,000
🖨 Deal sheet 📄 Offer letter ✓ Due diligence
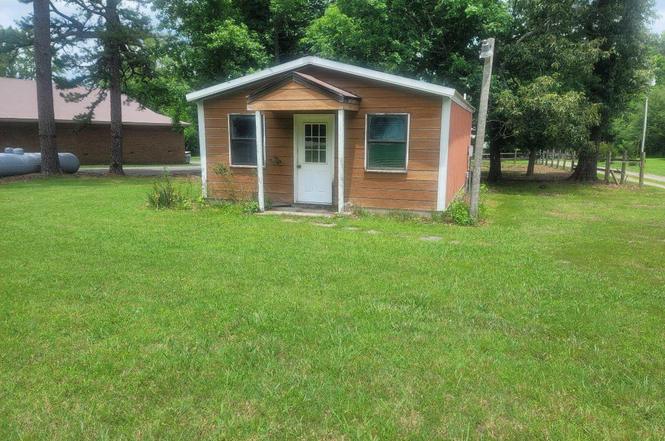
Listing remarks MLS
Potential for a good storage shed on a flat . 14 (+/-) lot with road frontage. It is hooked up to water, and it will need an electric meter put in but it is wired. There could be multiple uses for this property. Bring your ideas and an offer.
Key facts
- Wired
- Road frontage
- Hooked up to water
Tags
Property features AI
Exterior
- Parking: 2-car parking
- Utilities: Utilities: other (see remarks)
- Home design: Single-story property
- Construction: Metal/Vinyl siding; Metal roof; Slab foundation; Built on approximately 0.14 acre lot
- Exterior features: Level, cleared lot; Gravel and paved road access
Interior
- Flooring: Vinyl
- Bathrooms: One half bathroom
- Heating & cooling: No central heating; No central cooling
- Interior features: Vinyl flooring
Neighborhood map
What this means for you Summary
Snapshot
- This is a 1-bed/2.0-bath single-family listed at $35k.
Deal economics
- At list price, monthly cash flow is $415 ($5k/yr) — positive.
- The deal already cash-flows at list — no discount required.
- Meets the 1% rule at list price ($958 rent vs $35k).
Location & tenants
- Location reads 56/100 on livability (#386 in AR) — a working-class tenant base; expect higher turnover. Strengths: cost of living A+, housing A+; Watch: schools D, crime F, amenities F.
- Concord School District (rural): math 39% / reading 33% proficiency, ranked #114 of 238 in AR (top 48%) — families likely to look elsewhere, expect single-tenant / working-renter base with shorter leases.
- Market conditions: 6 active listings in the ZIP; 13 units permitted in Cleburne County in 2024 (0 in 5+ unit buildings).
Forward outlook
- In year one you build about $1k of equity ($242 loan paydown + $1k appreciation (3.0% local appreciation)).
- Cleburne County population projected at -18% by 2050 — secular population decline; favor cash flow + early exit over multi-decade hold.
- At projected returns (3.0% appreciation + 3.0% rent growth), your $10k cash investment doubles in ~2 years — after that, you're playing with house money.
Negotiation context
- Only 11 days on market — expect competitive offers; lowballing is unlikely to land.
- 5 sale attempts since 9y ago with the ask held roughly flat each time — persistent listings suggest the price (not the market) is what's stuck; bring a comps-based counter.
Risks & watch-outs
- Watch-outs: property tax is 4.9% of price.
Questions for the listing agent
- Property tax is high relative to price — has the assessment been appealed recently, and will the sale trigger a re-assessment?
- Is there a deadline driving the sale (1031 exchange, divorce, estate, relocation)? That informs how much negotiation room exists.
- Schools are D-rated, which usually means shorter tenancies and higher turnover. Who's the typical renter profile here, and what's been the actual vacancy rate?
- Crime grade is F in this area — have there been break-ins, vandalism, or insurance claims at this property in the last 3 years? What carrier currently insures it and at what premium?
- What's the average days-on-market for RENTAL listings here right now (not sales)? A rising rental-DOM trend means longer vacancies and softer asking-rent achievability than the comps imply.
- What's the recent tenant-quality profile in this submarket — average credit score on applications, eviction rate, late-payment / NSF rate, and stable-employment percentage? A property-management company in the area should have these aggregated.
- How much new for-sale + rental construction is in the pipeline within 1–3 miles? Heavy new supply typically softens prices + rents 12–24 months out; constrained supply supports both.
Investment metrics
- 1% rule
- 2.74% ✓
- Cap rate
- 20.53%
- Cash-on-cash
- 50.84%
- DSCR
- 3.26
- GRM
- 3.0
CMA / ARV
No comps found within radius.
Projected returns pro-forma
3.0% appreciation · 3.0% rent growth · sell at horizon
- IRR
- 56.0%
- Equity multiple
- 4.14×
- Total profit
- $30,736
- Equity at exit
- $15,738
- IRR
- 55.7%
- Equity multiple
- 8.39×
- Total profit
- $72,465
- Equity at exit
- $24,253
Cash invested: $9,800 (down + closing). Projections, not guarantees.
Landlord ↔ Tenant lean methodology
- Overall (STATE)
- 92 Strongly Landlord-Friendly
- State Arkansas
- 92 Strongly Landlord-Friendly · R+14
- County
- — inherits STATE
- City
- — inherits STATE
ZIP-level market 72523
- Active inventory
- 6
- Price-to-rent
- 3.0×
Monthly cashflow live
- Estimated rent
- $958 medium interval (Pro) →
- Mortgage (P&I)
- −$184
- Tax from tax record
- −$143 /mo · $1,720/yr
- Insurance
- −$15
- HOA
- −$0
- Vacancy / Maint / Mgmt
- −$201
- Net cashflow
- $415
Break-even live
UW: 25.0% down · 7.5% · 30yr · 1.5% tax · 5.0% vac · 8.0% maint · 8.0% mgmt
Financing live
Cash to close
- Down payment
- $8,750
- Closing costs
- $1,050
- Reserves months
- —
- Total cash needed
- —
Loan-product check · same deal, 3 products live
Conventional
25% down · 7.5% · 30yr
- Down + closing
- —
- Monthly P&I
- —
- Monthly cashflow
- —
- DSCR
- —
- Eligible?
- —
Personal DTI + credit; lowest rate.
DSCR
20% down · 8.5% · 30yr
- Down + closing
- —
- Monthly P&I
- —
- Monthly cashflow
- —
- DSCR
- —
- Eligible?
- —
No personal income docs; deal must DSCR.
Hard money
10% down · 12.0% · 12mo
- Down + closing
- —
- Monthly P&I
- —
- Monthly cashflow
- —
- DSCR
- —
- Eligible?
- —
Short-term bridge; refi at stabilization.
Listing history 9 events
-
2026-06-19days on market $35,000 Active 11 DOM
-
2026-06-18days on market $35,000 Active 10 DOM
-
2026-06-17days on market $35,000 Active 9 DOM
-
2026-06-16days on market $35,000 Active 8 DOM
-
2026-06-15statusdays on market $35,000 Active 7 DOM
-
2026-06-14days on market $35,000 New Listing 5 DOM
-
2026-06-12days on market $35,000 New Listing 4 DOM
-
2026-06-09remarks 242-char remark
-
2026-06-09$35,000 New Listing 1 DOM
ⓘ Source: listings_history table (triggers on properties + properties_extension) + one-shot
backfill from property_details.listing_events for pre-trigger history.
Tax reassessment forecast AR · Resets to sale price
- Current annual tax
- $1,720 · $143/mo
- Projected year-2 tax
- $1,720 · $143/mo
- Expected delta
- $0/yr ($0/mo · 0.0%)
ⓘ Screening estimate from a state-policy table — verify with the county assessor before closing.
Climate risk First Street
- Flood 1/10 Low FEMA zone X (unshaded) · 0% chance over 30 yrs
- Wildfire 4/10 Moderate
- Heat 4/10 Moderate 7 d/yr ≥105°F today · 19 d/yr by 30 yrs out
- Wind 3/10 Moderate 4% chance of damaging wind over 30 yrs
- Air quality 2/10 Low 0 unhealthy d/yr today · 1 by 30 yrs out
Nearby sold comps map
Loading sold comps map…
Walkable amenities ~0.75 mi
Loading nearby amenities…
Taxation est. · year 1
- Rental income
- $11,494
- − Mortgage interest
- −$1,961
- − Property taxes
- −$1,720
- − Insurance
- −$175
- − Repairs & maintenance
- −$920
- − Management
- −$920
- − Depreciation
- −$1,018
- Taxable income
- $4,781
- Est. tax owed @ 24.0%
- −$1,147
- After-tax cash flow
- $3,835/yr
For passive investors: Depreciation is non-cash, so a rental often shows a tax loss while cash-flowing — sheltering income. Rental losses are passive: they offset passive income freely, and up to $25,000/yr can offset ordinary (W-2) income if you actively participate and your MAGI is under $100k (phasing out to $0 by $150k); unused losses carry forward. On sale, claimed depreciation is recaptured at up to 25%, and gains may owe capital-gains tax (a 1031 exchange can defer both). Figures are a year-1 estimate at your 24.0% rate — not tax advice; consult a CPA.
Schools (NCES district)
- District
- Concord School District
- NCES district ID
- 0504560
- Math proficiency
- 39% ▼ -11.00%
- Reading proficiency
- 33% ▼ -9.00%
- Median HH income
- $35,870
- Composite
- 29.86/100
- National rank
- #6404
- State rank
- #114 of 238 in AR
Livability — Concord
- Score
- 56/100
- State rank
- #386
- US rank
- #22727
Category grades
Schools grade is shown separately in the Schools card above.
Census & demographics
- Census place
- Concord, AR
- Population (ZIP)
- 793
Population outlook (Cleburne County) Hauer SSP2
- Today (2025)
- 24,198 people
- By 2030
- 23,324 · -3.6%
- By 2040
- 21,566 · -10.9%
- By 2050
- 19,916 · -17.7%
- By 2075
- 16,744 · -30.8%
- By 2100
- 13,303 · -45.0%
Race, ethnicity, and origin ACS 2023
- Neighborhood character
- Predominantly White (93%)
- Race & ethnicity
- White 93% Two or more races 5% Asian 2%
- Common ancestry
- Iranian 1% Serbian 1% Italian 1%
Political lean MEDSL · Cleburne
- 2024 margin
- Solid R (+67.9) · D 15.2% · R 83.2% · Other 1.6%
- 2008→2024 swing
- -23.7pp toward R · 2008: -44.2pp · 2024: -67.9pp
- All cycles
- 2024: R+67.9 2020: R+65.8 2016: R+61.4 2012: R+52.2 2008: R+44.2
Not yet ingested
- Civics
- —
Market trends
- HPI YoY
- —
- Current HPI
- —
- Rent YoY
- —
- Metro
- —
- State GDP YoY
- ▲ 3.80%
- F500 in state
- 10
Industry mix (Fortune 500 HQ in AR)
| Industry | F500 HQs | Revenue |
|---|---|---|
| Retail | 1 | $681B |
|
||
| Food / Agriculture | 1 | $53B |
|
||
| Retail / Energy | 1 | $22B |
|
||
| Transportation / Logistics | 1 | $12B |
|
||
| Energy | 1 | $4B |
|
||
Price history
-70.8% since first listed13 events — show timeline
- 2026-06-05 Listed $35,000 WRVBOR
- 2026-06-05 Listed $35,000 CARMLS
- 2026-06-05 Listed $35,000 NWARMLS
- 2017-10-20 Sold (MLS) $87,900 CARMLS
- 2017-07-27 Pending — CARMLS
- 2017-07-12 Price Changed $88,900 CARMLS
- 2017-07-03 Relisted — CARMLS
- 2017-07-03 Listing Removed — CARMLS
- 2017-06-08 Price Changed $89,900 CARMLS
- 2017-05-04 Price Changed $94,900 CARMLS
- 2017-05-01 Price Changed $99,900 CARMLS
- 2017-03-31 Price Changed $109,900 CARMLS
- 2017-02-26 Listed $119,900 CARMLS
Property tax history
+14.4%/yrLatest (2025): $1,720 · +61.7% YoY. Source: county tax records.
Cash-flow waterfall
monthlySold comps — $/sqft
last 12 mo · ≤1 miLoading sold comps…