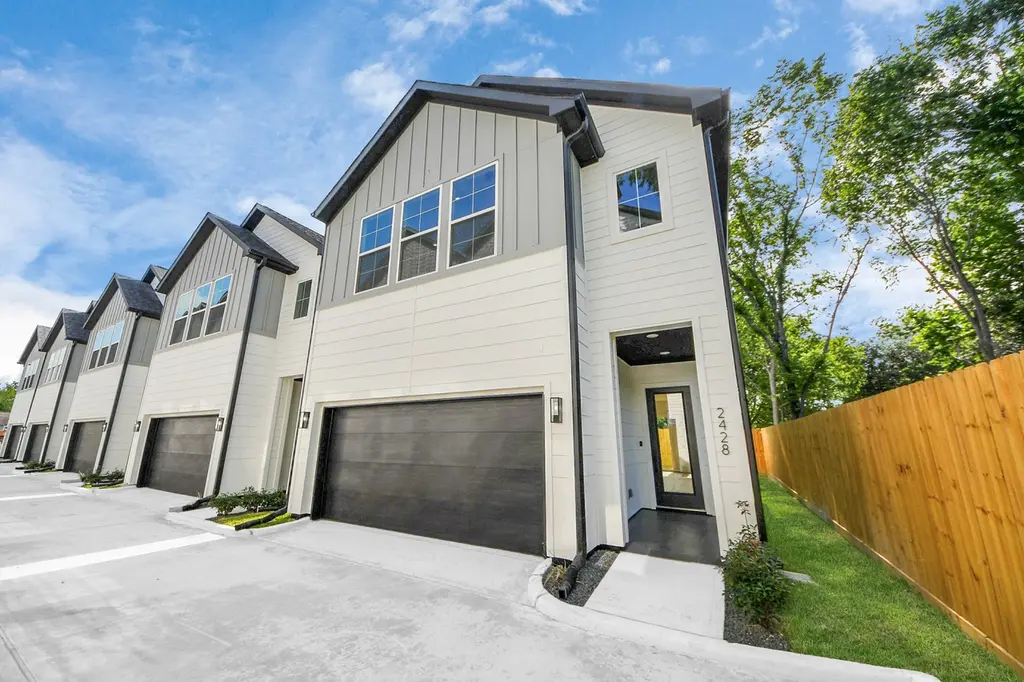
2428 Harrington St · Houston, TX
Flood risk 6/10 · Moderate
- FEMA flood zone
- X (unshaded)
- Chance of flooding over 30 yrs
- 0.73%
- Est. flood insurance / yr
- $507 – $1,088
Fire risk 1/10 · Minimal
- Est. fire insurance / yr
- $1,222 – $2,270
Heat risk 9/10 · Severe
- Hot days now (above 109°F)
- 7 days/yr
- Hot days in 30 yrs
- 21 days/yr
Wind risk 9/10 · Severe
- Chance of severe wind over 30 yrs
- 99.0%
Air-quality risk 3/10 · Minor
- Unhealthy air days now
- 2 days/yr
- Unhealthy air days in 30 yrs
- 3 days/yr
Risk factors via First Street. Map © Google.
Why this score? — see what drove the D grade
The composite is a weighted blend of 9 inputs, each scored 0–100. Each bar is that input's sub-score; the figure is the points it added to the 100-point composite (weight × sub-score).
- ARV discount +11.6/15.0
- Cash flow +6.9/30.0
- Appreciation +6.9/10.0
- Condition / age +4.8/5.0
- Livability +3.7/5.0
- Rent growth +3.3/5.0
- Schools +2.7/10.0
- 1% rule +2.5/10.0
- DSCR +1.1/10.0
$325,000
🖨 Deal sheet (PDF) 📄 Offer letter ✓ Due diligence
Listing remarks MLS
CASH COW INVESTMENT OPPORTUNITY! Welcome to CARR CITY VIEWS! NINE Gorgeous BRAND NEW freestanding homes in a fully gated community located in NORTH DOWNTOWN w/ 3 bedrooms, 3.5 baths. The 2-story floor plan offers a backyard just off the living room, luxury vinyl plank flooring, and OVERSIZED windows throughout! Perfect for entertaining, the gourmet kitchen features stainless steel appliances, quartz countertops, stylish two-tone cabinetry, elegant champagne bronze finishes, and a stunning farmhouse sink. Upstairs boasts a spacious owner’s suite with BIG WINDOWS, a walk-in closet, and an ensuite owner’s bathroom with a soaking tub and upgraded double vanity. Secondary bedrooms also on the 3rd floor WITH bathrooms. Minutes from DOWNTOWN HOUSTON, EAST RIVER, and major dining and entertainment! HOME IS OCCUPIED @ $2,850/MONTH WITH ATLAS MANAGEMENT! ALL APPLIANCES INCLUDED! CALL NOW FOR A PRIVATE TOUR!
Key facts
- 1,938 sq ft lot
- 2 garage spots
- Built 2025
Neighborhood map
What this means for you Summary
Snapshot
- This is a 3-bed/3.5-bath single-family listed at $325k. Condition is rated excellent.
Deal economics
- At list price, monthly cash flow is $-487 ($-6k/yr) — negative.
- To cash-flow at today's rent, offer at most $239k (26.5% below list).
- To meet the 1% rule (rent ≥ 1% of price), the offer needs to be $245k (24.7% below list).
- Recommended offer: $239k (26.5% below list) — sets the bar for cash-flow.
- Cap rate 4.5% vs local median 3.2% in Houston — top-decile yield for the area; either an underpriced asset or a hidden risk that comps aren't pricing in. Stress-test before assuming the spread holds.
Location & tenants
- Location reads 74/100 on livability (#184 in TX, #4,771 nationally) — a middle-class / working-renter tenant base. Strengths: amenities A+, cost of living A+, housing A+; Watch: crime F.
- Houston ISD (urban): math 27% / reading 35% proficiency, ranked #593 of 826 in TX (top 72%) — families likely to look elsewhere, expect single-tenant / working-renter base with shorter leases; 71% free/reduced lunch — lower-income household profile, screen leases tightly.
- Zoned schools: Sherman El (math 22% / reading 22%, grade F, #3,333 of 4,322 statewide, top 80%, 528 students, 99% FRL); Fleming Middle (math 10% / reading 15%, grade F, #1,616 of 1,662 statewide, top 97%, 384 students, 97% FRL); Northside H S (math 15% / reading 26%, grade F, #1,389 of 1,632 statewide, top 86%, 1,168 students, 94% FRL) — zoned schools average 97% FRL vs 71% district-wide (26 pts higher); higher-poverty schools than district average — tighter screening recommended.
- Zoned-school proficiency averages 18% at this address vs 31% district-wide (-13 pts) — the specific schools serving this property underperform the Houston ISD average; the district grade overstates school quality for this exact location.
- Market conditions: Rents rising (+3.1%/yr); 448 active listings in the ZIP; 40 comparable units currently listed for rent nearby; rentals at typical pace (median 15d on market — plan ~3-4 weeks tenant-placement turnaround); 40% of comp listings sitting > 30 days — soft ceiling on asking rent; lower-income renter base — watch delinquency; 29,883 units permitted in Harris County in 2024 (8,621 in 5+ unit buildings).
- At $2,447/mo this rent would consume 75% of the median local household income ($39k/yr) (locally 1531% of renters already pay >50% of income on rent) — very limited rent-growth headroom before tenants either downsize or default.
Forward outlook
- In year one you build about $15k of equity ($2k loan paydown + $13k appreciation (3.9% local appreciation)).
- Harris County population projected at +47% by 2050 — long-run rental-demand tailwind backs the buy-and-hold thesis.
- By year 3, paydown + projected appreciation supports a ~$37k cash-out refi (75% LTV) — recoverable capital for the next deal without selling this one.
Negotiation context
- It's been on market 76 days — a 6% lower offer ($306k) is reasonable based on typical stale-listing flexibility.
Risks & watch-outs
- Climate carrying-cost: major flood risk; severe wind risk, 99% chance of damaging wind over 30y; extreme-heat days projected 7→21/yr by 2055 (HVAC capex compounding) — expect insurance premiums to compound above CPI over the hold.
Questions for the listing agent
- What do current leases actually rent for vs. the listed asking? Can we see a recent rent roll and the last 12 months of T-12 income?
- It's been on market 76 days. Have you received any prior offers? Is the seller open to a 26% concession, seller financing, or rate buy-down credit?
- What does the HOA fee cover, when was the last increase, and are there any pending special assessments or reserve-fund shortfalls?
- Why hasn't it sold? Are there any deal-killer items the seller is aware of (foundation, flood, title, zoning, code violations)?
- Is there a deadline driving the sale (1031 exchange, divorce, estate, relocation)? That informs how much negotiation room exists.
- Schools are D-rated, which usually means shorter tenancies and higher turnover. Who's the typical renter profile here, and what's been the actual vacancy rate?
- Crime grade is F in this area — have there been break-ins, vandalism, or insurance claims at this property in the last 3 years? What carrier currently insures it and at what premium?
- The area grade is low — what's the realistic commute time and amenity access for the typical tenant pool here? Any planned neighborhood developments (good or bad) we should know about?
- What's the average days-on-market for RENTAL listings here right now (not sales)? A rising rental-DOM trend means longer vacancies and softer asking-rent achievability than the comps imply.
- What's the recent tenant-quality profile in this submarket — average credit score on applications, eviction rate, late-payment / NSF rate, and stable-employment percentage? A property-management company in the area should have these aggregated.
- How much new for-sale + rental construction is in the pipeline within 1–3 miles? Heavy new supply typically softens prices + rents 12–24 months out; constrained supply supports both.
Investment metrics
- 1% rule
- 0.75% ✗
- Cap rate
- 4.49%
- Cash-on-cash
- -6.42%
- DSCR
- 0.71
- GRM
- 11.1
CMA / ARV
- ARV (median comp)
- $357,717
- List price
- $325,000
- Delta
- -9.15%
- Verdict
- FAIR
- Comps
- 20 within 1.0 mi
Show comp detail 12 sales within ~0.75 mi
| Address | Dist | Beds/Ba | Sqft | Sold | Price | $/sf | Match |
|---|---|---|---|---|---|---|---|
| 1913 West St | 0.21mi | 3/2.5 | 1,750 (+0%) | 0mo | $387,000 | $221 | 85 |
| 1715 Mary St | 0.11mi | 3/3.5 | 1,877 (+8%) | 2mo | $369,900 | $197 | 80 |
| 2814 Mills St | 0.25mi | 3/3.5 | 1,972 (+13%) | 1mo | $389,900 | $198 | 66 |
| 2812 Mills St | 0.25mi | 3/3.5 | 1,972 (+13%) | 1mo | $369,900 | $188 | 66 |
| 711 Schwartz St | 0.64mi | 3/3.5 | 1,692 (-3%) | 2mo | $309,000 | $183 | 64 |
| 3605 New Orleans St | 0.70mi | 3/2.5 | 1,884 (+8%) | 1mo | $374,900 | $199 | 49 |
| 3409 Stonewall St | 0.63mi | 3/2.5 | 1,969 (+13%) | 1mo | $349,900 | $178 | 44 |
| 3415 Stonewall St | 0.64mi | 3/2.5 | 1,969 (+13%) | 1mo | $369,000 | $187 | 44 |
| 3209 Baer St Unit A | 0.74mi | 3/3.5 | 1,990 (+14%) | 1mo | $464,900 | $234 | 41 |
| 3209 Baer St Unit B | 0.74mi | 3/3.5 | 1,996 (+14%) | 1mo | $464,900 | $233 | 40 |
| 2710 Jensen Creek Ln | 0.71mi | 3/2.5 | 1,508 (-14%) | 0mo | $299,900 | $199 | 40 |
| 1619 Chapman St | 0.52mi | 2/1.5 (-1) | 1,976 (+13%) | 1mo | $299,000 | $151 | 40 |
Match score weights: distance 35% · size 25% · config 20% · recency 20%. Top-matched comps best support the ARV.
Projected returns pro-forma
3.89% appreciation · 3.08% rent growth · sell at horizon
- IRR
- 4.4%
- Equity multiple
- 1.26×
- Total profit
- $24,091
- Equity at exit
- $162,747
- IRR
- 7.3%
- Equity multiple
- 2.22×
- Total profit
- $111,172
- Equity at exit
- $264,576
Cash invested: $91,000 (down + closing). Projections, not guarantees.
Landlord ↔ Tenant lean methodology
- Overall (STATE)
- 87 Strongly Landlord-Friendly
- State Texas
- 87 Strongly Landlord-Friendly · R+5
- County
- — inherits STATE
- City
- — inherits STATE
ZIP-level market 77026
- Home prices YoY
- 1.5%
- Rents YoY
- 3.1%
- Active inventory
- 448
- Price-to-rent
- 11.1×
Monthly cashflow live
- Estimated rent
- $2,447 high interval (Pro) →
- Mortgage (P&I)
- −$1,704
- Tax from tax record
- −$480 /mo · $5,765/yr
- Insurance
- −$135
- HOA
- −$100
- Vacancy / Maint / Mgmt
- −$514
- Net cashflow
- $-487
Break-even live
Sensitivity live
| Price | -10% $-303 | -5% $-395 | +0% $-487 | +5% $-579 | +10% $-671 |
|---|---|---|---|---|---|
| Rent | -10% $-680 | -5% $-584 | +0% $-487 | +5% $-390 | +10% $-294 |
| Rate | -1.0pp $-323 | -0.5pp $-404 | base $-487 | +0.5pp $-571 | +1.0pp $-657 |
UW: 25.0% down · 7.5% · 30yr · 1.5% tax · 5.0% vac · 8.0% maint · 8.0% mgmt
Financing live
Cash to close
- Down payment
- $81,250
- Closing costs
- $9,750
- Reserves months
- —
- Total cash needed
- —
Loan-product check · same deal, 3 products live
Conventional
25% down · 7.5% · 30yr
- Down + closing
- —
- Monthly P&I
- —
- Monthly cashflow
- —
- DSCR
- —
- Eligible?
- —
Personal DTI + credit; lowest rate.
DSCR
20% down · 8.5% · 30yr
- Down + closing
- —
- Monthly P&I
- —
- Monthly cashflow
- —
- DSCR
- —
- Eligible?
- —
No personal income docs; deal must DSCR.
Hard money
10% down · 12.0% · 12mo
- Down + closing
- —
- Monthly P&I
- —
- Monthly cashflow
- —
- DSCR
- —
- Eligible?
- —
Short-term bridge; refi at stabilization.
Rent comps 40 comps
| Address | Beds | Baths | Sqft | Rent | $/sqft | DOM | Units | Dist |
|---|---|---|---|---|---|---|---|---|
| 1714 Mary St Houston, TX | 2.0 | 2.0 | 1100 | $2,400 | $2.18 | 45d | 1 | 0.12mi |
| 1307 Bayou St Unit B Houston, TX | 3.0 | 3.0 | 1814 | $2,400 | $1.32 | 9d | 1 | 0.48mi |
| 1550 Leona St Houston, TX | 1.0–2.0 | 1.0–2.0 | 835 | $1,905 | $2.28 | 3d | 19 | 0.49mi |
| 1303 Bayou St Unit C Houston, TX | 3.0 | 3.0 | 1869 | $3,200 | $1.71 | 45d | 1 | 0.49mi |
| 3300 Lyons Ave Unit 304 Houston, TX | 4.0 | 2.0 | 1393 | $1,460 | $1.05 | 45d | 1 | 0.49mi |
| 1550 Leona St Unit 1587 Houston, TX | 2.0 | 2.0 | 1131 | $1,942 | $1.72 | 45d | 1 | 0.54mi |
| 1513 Cage St Houston, TX | 3.0 | 2.0 | 1467 | $1,550 | $1.06 | 45d | 1 | 0.59mi |
| 1550 Burnett St Houston, TX | 1.0–2.0 | 1.0–2.0 | 877 | $2,108 | $2.40 | 0d | 36 | 0.61mi |
| 2905 Baer St Unit 1047953P Houston, TX | 3.0 | 2.5 | 1991 | $2,922 | $1.47 | 0d | 1 | 0.61mi |
| 1250 Leona St Houston, TX | 2.0 | 1.0–2.0 | 885 | $1,990 | $2.25 | 0d | 15 | 0.62mi |
| 611 Sydnor St Houston, TX | 3.0 | 4.0 | 2157 | $2,400 | $1.11 | 45d | 1 | 0.69mi |
| 3730 Lyons Ave Unit 216 Houston, TX | 3.0 | 2.0 | 1107 | $1,300 | $1.17 | 45d | 1 | 0.77mi |
| 650 McKee St Unit 3112 Houston, TX | 3.0 | 2.0 | 1136 | $2,074 | $1.83 | 0d | 1 | 0.78mi |
| 650 McKee St Unit 683 Houston, TX | 3.0 | 2.0 | 1136 | $2,125 | $1.87 | 45d | 1 | 0.78mi |
| 650 McKee St Unit 3174 Houston, TX | 3.0 | 2.0 | 1136 | $2,114 | $1.86 | 12d | 1 | 0.78mi |
| 3410 Baer St Houston, TX | 3.0 | 4.0 | 2040 | $3,500 | $1.72 | 45d | 1 | 0.82mi |
| 3419 Gillespie St Houston, TX | 3.0 | 3.5 | 2168 | $2,300 | $1.06 | 45d | 1 | 0.84mi |
| 308 Grove St Houston, TX | 3.0 | 3.0 | 1701 | $2,350 | $1.38 | 9d | 1 | 0.88mi |
| 91 Jensen Dr Houston, TX | 2.0 | 1.0–2.0 | 872 | $3,094 | $3.55 | 22d | 16 | 0.88mi |
| 91 Jensen Dr Houston, TX | 3.0 | 1.0–2.5 | 970 | $3,420 | $3.52 | 0d | 67 | 0.88mi |
| 2706 Cochran St Houston, TX | 3.0 | 3.5 | 1791 | $2,700 | $1.51 | 21d | 1 | 0.96mi |
| 1625 N Main St Houston, TX | 3.0 | 1.0–3.0 | 994 | $2,354 | $2.37 | 0d | 41 | 0.96mi |
| 4109 Hare St Unit A Houston, TX | 4.0 | 2.5 | 1913 | $6,950 | $3.63 | 45d | 1 | 1.02mi |
| 4109 Hare St Unit 1019559P Houston, TX | 4.0 | 2.5 | 1905 | $6,852 | $3.60 | 9d | 1 | 1.02mi |
| 2115 Runnels St Houston, TX | 2.0 | 2.0 | 1053 | $1,775 | $1.69 | 45d | 1 | 1.04mi |
| 2115 Runnels St Unit 3187 Houston, TX | 3.0 | 2.0 | 1839 | $3,005 | $1.63 | 0d | 1 | 1.05mi |
| 2115 Runnels St Unit 2148 Houston, TX | 3.0 | 2.0 | 1839 | $3,045 | $1.66 | 13d | 1 | 1.05mi |
| 2115 Runnels St Unit 3174 Houston, TX | 3.0 | 2.0 | 1839 | $3,056 | $1.66 | 13d | 1 | 1.05mi |
| 2115 Runnels St Unit 3174 Houston, TX | 3.0 | 2.0 | 1839 | $3,056 | $1.66 | 0d | 1 | 1.05mi |
| 2016 N Main St Houston, TX | 2.0 | 2.0 | 1169 | $2,200 | $1.88 | 45d | 1 | 1.05mi |
| 6 N Main St Houston, TX | 2.0 | 2.0 | 1248 | $2,453 | $1.97 | 45d | 1 | 1.08mi |
| 6 N Main St Houston, TX | 2.0 | 2.0 | 1248 | $2,453 | $1.97 | 22d | 1 | 1.08mi |
| 4300 Lyons Ave Unit 304 Houston, TX | 4.0 | 2.0 | 1393 | $1,460 | $1.05 | 45d | 1 | 1.09mi |
| 410 James St Unit 1031793P Houston, TX | 3.0 | 2.0 | 1593 | $5,668 | $3.56 | 0d | 1 | 1.10mi |
| 410 James St Houston, TX | 3.0 | 2.0 | 1602 | $6,750 | $4.21 | 45d | 1 | 1.10mi |
| 412 Paschall St Unit 1316398P Houston, TX | 3.0 | 2.0 | 1130 | $4,840 | $4.28 | 14d | 1 | 1.14mi |
| 2315 Navigation Blvd Houston, TX | 1.0–2.0 | 1.0–2.5 | 943 | $3,500 | $3.71 | 0d | 62 | 1.15mi |
| 800 Middle St Houston, TX | 1.0–4.0 | 1.0–2.0 | 1003 | $1,593 | $1.59 | 7d | 1 | 1.16mi |
| 10 Crawford St Houston, TX | 2.0 | 1.0–2.0 | 813 | $2,265 | $2.79 | 4d | 168 | 1.16mi |
| 15 N Chenevert St Houston, TX | 2.0 | 1.0–2.0 | 1351 | $4,000 | $2.96 | 0d | 16 | 1.17mi |
HOA detail
- Monthly dues
- $100 · $1,200/yr
- Likely covers
- security
Listing history 13 events
-
2026-06-21days on market $325,000 Active 76 DOM
-
2026-06-18days on market $325,000 Active 73 DOM
-
2026-06-17days on market $325,000 Active 72 DOM
-
2026-06-16days on market $325,000 Active 71 DOM
-
2026-06-15days on market $325,000 Active 70 DOM
-
2026-06-13days on market $325,000 Active 68 DOM
-
2026-06-10days on market $325,000 Active 64 DOM
-
2026-06-08days on market $325,000 Active 63 DOM
-
2026-06-07days on market $325,000 Active 62 DOM
-
2026-06-04days on market $325,000 Active 59 DOM
-
2026-06-01days on market $325,000 Active 56 DOM
-
2026-05-31days on market $325,000 Active 55 DOM
-
2026-04-06$325,000 Active 922-char remark
Show marketing remark (922 chars)
CASH COW INVESTMENT OPPORTUNITY! Welcome to CARR CITY VIEWS! NINE Gorgeous BRAND NEW freestanding homes in a fully gated community located in NORTH DOWNTOWN w/ 3 bedrooms, 3.5 baths. The 2-story floor plan offers a backyard just off the living room, luxury vinyl plank flooring, and OVERSIZED windows throughout! Perfect for entertaining, the gourmet kitchen features stainless steel appliances, quartz countertops, stylish two-tone cabinetry, elegant champagne bronze finishes, and a stunning farmhouse sink. Upstairs boasts a spacious owner’s suite with BIG WINDOWS, a walk-in closet, and an ensuite owner’s bathroom with a soaking tub and upgraded double vanity. Secondary bedrooms also on the 3rd floor WITH bathrooms. Minutes from DOWNTOWN HOUSTON, EAST RIVER, and major dining and entertainment! HOME IS OCCUPIED @ $2,850/MONTH WITH ATLAS MANAGEMENT! ALL APPLIANCES INCLUDED! CALL NOW FOR A PRIVATE TOUR!
ⓘ Source: listings_history table (triggers on properties + properties_extension) + one-shot
backfill from property_details.listing_events for pre-trigger history.
Tax reassessment forecast TX · Resets to sale price
- Current annual tax
- $5,765 · $480/mo
- Projected year-2 tax
- $5,948 · $496/mo
- Expected delta
- +$183/yr (+$15/mo · 3.2%)
ⓘ Screening estimate from a state-policy table — verify with the county assessor before closing.
Climate risk First Street
- Flood 6/10 Major FEMA zone X (unshaded) · 73% chance over 30 yrs
- Wildfire 1/10 Low
- Heat 9/10 Extreme 7 d/yr ≥109°F today · 21 d/yr by 30 yrs out
- Wind 9/10 Extreme 99% chance of damaging wind over 30 yrs
- Air quality 3/10 Moderate 2 unhealthy d/yr today · 3 by 30 yrs out
Nearby sold comps map
Loading sold comps map…
Walkable amenities ~0.75 mi
Loading nearby amenities…
Taxation est. · year 1
- Rental income
- $29,364
- − Mortgage interest
- −$18,205
- − Property taxes
- −$5,765
- − Insurance
- −$1,625
- − Repairs & maintenance
- −$2,349
- − Management
- −$2,349
- − HOA
- −$1,200
- − Depreciation
- −$9,455
- Taxable loss
- −$11,583
- Est. tax savings @ 24.0%
- +$2,780
- After-tax cash flow
- $-3,064/yr
For passive investors: Depreciation is non-cash, so a rental often shows a tax loss while cash-flowing — sheltering income. Rental losses are passive: they offset passive income freely, and up to $25,000/yr can offset ordinary (W-2) income if you actively participate and your MAGI is under $100k (phasing out to $0 by $150k); unused losses carry forward. On sale, claimed depreciation is recaptured at up to 25%, and gains may owe capital-gains tax (a 1031 exchange can defer both). Figures are a year-1 estimate at your 24.0% rate — not tax advice; consult a CPA.
Condition & rehab AI · 3 photos
This brand-new single-family home in a fully gated community offers modern amenities and a move-in-ready condition, making it an excellent investment opportunity.
Value-add opportunities
- Both Landscaping improvements — Enhanced curb appeal and increased property value.
- Both Add smart home features — Modernizes the home and attracts tech-savvy buyers/renters.
- Both Install smart thermostat — Saves energy and appeals to eco-conscious buyers/renters.
- Both Add smart lighting system — Enhances home's ambiance and energy efficiency.
- Both Install smart security system — Enhances safety and attracts buyers/renters who value security.
Renovation cost estimate screening
Value-add ROI direction
- Both Landscaping improvements — Enhanced curb appeal and increased property value. ↑
- Both Add smart home features — Modernizes the home and attracts tech-savvy buyers/renters. ↑
- Both Install smart thermostat — Saves energy and appeals to eco-conscious buyers/renters. ↑
- Both Add smart lighting system — Enhances home's ambiance and energy efficiency. ↑
- Both Install smart security system — Enhances safety and attracts buyers/renters who value security. ↑
ⓘ Cost ranges are severity-bucket heuristics (US national rule-of-thumb). Get contractor quotes + a written scope before underwriting a rehab budget.
Schools (NCES district)
- District
- Houston ISD
- NCES district ID
- 4823640
- Math proficiency
- 27% ▼ -18.00%
- Reading proficiency
- 35% ▼ -6.00%
- Median HH income
- $46,054
- Composite
- 26.63/100
- National rank
- #7173
- State rank
- #593 of 826 in TX
Livability — Houston
- Score
- 74/100
- State rank
- #184
- US rank
- #4771
Category grades
Schools grade is shown separately in the Schools card above.
Census & demographics
- Census place
- Houston, TX
- County
- Harris County · 4,702,590 people
- City population
- 3,226,434
- Metro
- Houston-The Woodlands-Sugar Land, TX
- Population (ZIP)
- 21,981
- Household income
- $39,211
- Rent vs Own
- Severe rent burden
- 1531.0
Population outlook (Harris County) Hauer SSP2
- Today (2025)
- 5,571,493 people
- By 2030
- 6,089,821 · +9.3%
- By 2040
- 7,142,806 · +28.2%
- By 2050
- 8,185,864 · +46.9%
- By 2075
- 10,574,329 · +89.8%
- By 2100
- 12,109,958 · +117.4%
Race, ethnicity, and origin ACS 2023
- Neighborhood character
- Diverse neighborhood (Simpson 0.56)
- Race & ethnicity
- Black 49% Hispanic / Latino 44% Two or more races 18% White 5% Native American 1%
- Hispanic origin (detail)
- Mexican 34%
- Common ancestry
- Lithuanian 1%
- Foreign-born
- 15% · Canada
- Languages at home
- 61% English-only · Spanish 39%
Political lean MEDSL · Harris
- 2024 margin
- Lean D (+5.5) · D 52.0% · R 46.4% · Other 1.6%
- 2008→2024 swing
- +3.9pp toward D · 2008: 1.6pp · 2024: 5.5pp
- All cycles
- 2024: D+5.5 2020: D+13.3 2016: D+12.4 2012: D+0.1 2008: D+1.6
Not yet ingested
- Civics
- —
Market trends
- HPI YoY
- ▲ 3.89%
- Current HPI
- 267.5995
- Rent YoY
- ▲ 3.08%
- Metro
- Houston-The Woodlands-Sugar Land, TX
- State GDP YoY
- ▲ 3.95%
- F500 in state
- 110
Industry mix (Fortune 500 HQ in TX)
| Industry | F500 HQs | Revenue |
|---|---|---|
| Energy | 16 | $1,198B |
|
||
| Technology | 5 | $198B |
|
||
| Engineering / Construction | 4 | $72B |
|
||
| Energy Services | 3 | $60B |
|
||
| Utilities | 3 | $41B |
|
||
| Healthcare | 2 | $330B |
|
||
Price history
1 event — show timeline
- 2026-04-06 Listed $325,000 HARMLS
Property tax history
+226.8%/yrLatest (2025): $5,765 · +928.4% YoY. Source: county tax records.
Cash-flow waterfall
monthlySold comps — $/sqft
last 12 mo · ≤1 miLoading sold comps…