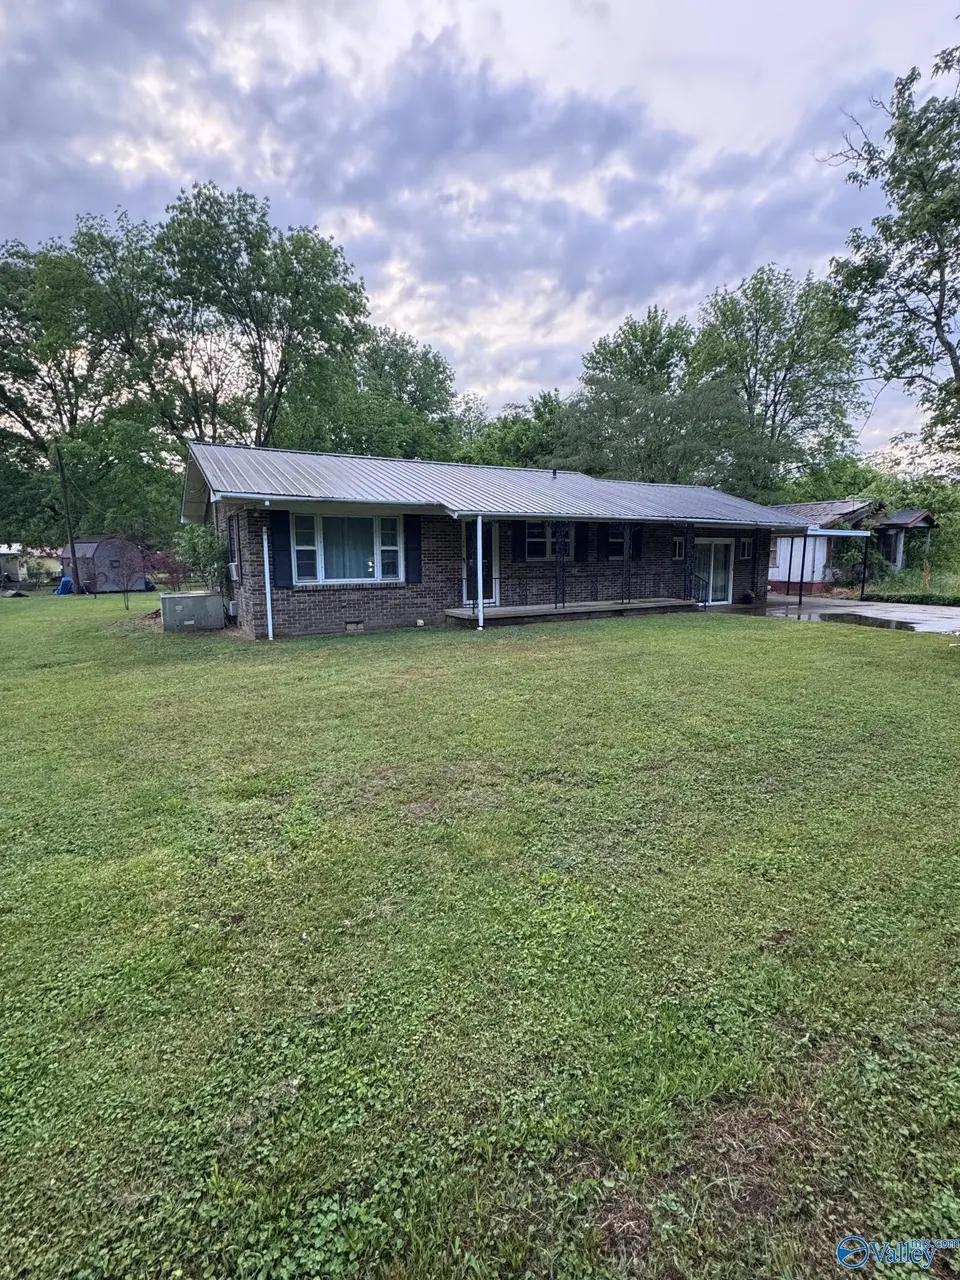
106 Brewer St · Scottsboro, AL
Flood risk 1/10 · Minimal
- FEMA flood zone
- X (unshaded)
- Chance of flooding over 30 yrs
- 0.0%
- Est. flood insurance / yr
- $473 – $860
Fire risk 4/10 · Minor
- Est. fire insurance / yr
- $916 – $1,700
Heat risk 6/10 · Moderate
- Hot days now (above 107°F)
- 7 days/yr
- Hot days in 30 yrs
- 20 days/yr
Wind risk 4/10 · Minor
- Chance of severe wind over 30 yrs
- 16.0%
Air-quality risk 1/10 · Minimal
- Unhealthy air days now
- 0 days/yr
- Unhealthy air days in 30 yrs
- 0 days/yr
Risk factors via First Street. Map © Google.
Why this score? — see what drove the C grade
The composite is a weighted blend of 9 inputs, each scored 0–100. Each bar is that input's sub-score; the figure is the points it added to the 100-point composite (weight × sub-score).
- Cash flow +21.3/30.0
- ARV discount +12.7/15.0
- DSCR +6.8/10.0
- 1% rule +4.5/10.0
- Livability +3.7/5.0
- Schools +3.4/10.0
- Rent growth +2.5/5.0
- Condition / age +2.5/5.0
- Appreciation +0.0/10.0
$164,900
🖨 Deal sheet 📄 Offer letter ✓ Due diligence
Listing remarks
Great investment opportunity or great first time home! 3 bedroom/1 full bath home with large carport conveniently located in the city limits of Scottsboro. The bedrooms and living room have refinished original hardwood flooring with fresh paint throughout. The home also has an over-sized family room with large laundry room/office space.
Key facts
- 0.28 acre lot
- Built 1970
- Listed 51 days
Property features AI
Finance
- Other: Residential property; Living area approximately 1,312 square feet; Lot about 0.28 acres
- HOA & community: No homeowners association; Subdivision: Westlawn
Exterior
- Parking: Attached carport
- Utilities: Public sewer; Public water
- Home design: Single-family residence; One-story; Built in 1970; Brick construction
- Construction: Brick construction; Built in 1970; Crawl space foundation
- Exterior features: Public water
Interior
- Bathrooms: 1 full bathroom
- Heating & cooling: Central heating; Wall furnace; Central air conditioning; Window air conditioning
- Interior features: Crawl space basement
Neighborhood map
What this means for you Summary
Snapshot
- This is a 3-bed/1.0-bath single-family listed at $165k.
Deal economics
- At list price, monthly cash flow is $241 ($3k/yr) — positive.
- The deal already cash-flows at list — no discount required.
- To meet the 1% rule (rent ≥ 1% of price), the offer needs to be $156k (5.4% below list).
- Recommended offer: $156k (5.4% below list) — sets the bar for 1% rule.
- Cap rate 8.0% vs local median 3.3% in Scottsboro — top-decile yield for the area; either an underpriced asset or a hidden risk that comps aren't pricing in. Stress-test before assuming the spread holds.
Location & tenants
- Location reads 74/100 on livability (#21 in AL, #4,752 nationally) — a middle-class / working-renter tenant base. Strengths: cost of living A+, health & safety A+, housing B+; Watch: employment D+, amenities D-, commute F.
- Scottsboro City (town): math 27% / reading 54% proficiency, ranked #27 of 129 in AL (top 21%) — families likely to look elsewhere, expect single-tenant / working-renter base with shorter leases.
- Zoned schools: Thurston T Nelson Elementary School (235 students, 48% FRL); Collins Intermediate School (math 30% / reading 57%, grade D, #45 of 257 statewide, top 18%, 521 students, 61% FRL); Scottsboro High School (math 27% / reading 32%, grade F, #70 of 305 statewide, top 27%, 739 students, 50% FRL).
- Market conditions: 78 active listings in the ZIP; 2 comparable units currently listed for rent nearby; 46 units permitted in Jackson County in 2024 (0 in 5+ unit buildings).
Forward outlook
- Local home prices are declining (-3.0%/yr); year-one equity from $1k of loan paydown is wiped out by about $5k of value loss. Plan a longer hold.
- Jackson County population projected at -17% by 2050 — secular population decline; favor cash flow + early exit over multi-decade hold.
Negotiation context
- It's been on market 52 days — a 3% lower offer ($160k) is reasonable based on typical stale-listing flexibility.
- 2 sale attempts with the ask held roughly flat each time — persistent listings suggest the price (not the market) is what's stuck; bring a comps-based counter.
Risks & watch-outs
- Climate carrying-cost: extreme-heat days projected 7→20/yr by 2055 (HVAC capex compounding) — expect insurance premiums to compound above CPI over the hold.
Questions for the listing agent
- It's been on market 52 days. Have you received any prior offers? Is the seller open to a 5% concession, seller financing, or rate buy-down credit?
- Built in 1970 — when were the roof, HVAC, electrical panel, plumbing, and water heater last replaced?
- Is there a deadline driving the sale (1031 exchange, divorce, estate, relocation)? That informs how much negotiation room exists.
- What's the average days-on-market for RENTAL listings here right now (not sales)? A rising rental-DOM trend means longer vacancies and softer asking-rent achievability than the comps imply.
- What's the recent tenant-quality profile in this submarket — average credit score on applications, eviction rate, late-payment / NSF rate, and stable-employment percentage? A property-management company in the area should have these aggregated.
- How much new for-sale + rental construction is in the pipeline within 1–3 miles? Heavy new supply typically softens prices + rents 12–24 months out; constrained supply supports both.
Investment metrics
- 1% rule
- 0.95% ✗
- Cap rate
- 8.04%
- Cash-on-cash
- 6.25%
- DSCR
- 1.28
- GRM
- 8.8
CMA / ARV
- ARV (median comp)
- $186,229
- List price
- $164,900
- Delta
- -11.45%
- Verdict
- UNDERPRICED
- Comps
- 20 within 1.0 mi
Show comp detail 3 sales within ~0.75 mi
| Address | Dist | Beds/Ba | Sqft | Sold | Price | $/sf | Match |
|---|---|---|---|---|---|---|---|
| 423 W Laurel St | 0.63mi | 3/2.0 | 1,966 (+1%) | 6mo | $189,500 | $96 | 59 |
| 514 West St | 0.57mi | 3/1.5 | 1,991 (+3%) | 10mo | $190,000 | $95 | 58 |
| 316 Hodges St | 0.74mi | 3/2.0 | 2,136 (+10%) | 6mo | $238,000 | $111 | 40 |
Match score weights: distance 35% · size 25% · config 20% · recency 20%. Top-matched comps best support the ARV.
Projected returns pro-forma
-3.0% appreciation · 3.0% rent growth · sell at horizon
- IRR
- -6.7%
- Equity multiple
- 0.75×
- Total profit
- $-11,464
- Equity at exit
- $24,587
- IRR
- 2.9%
- Equity multiple
- 1.21×
- Total profit
- $9,475
- Equity at exit
- $14,258
Cash invested: $46,172 (down + closing). Projections, not guarantees.
Landlord ↔ Tenant lean methodology
- Overall (STATE)
- 90 Strongly Landlord-Friendly
- State Alabama
- 90 Strongly Landlord-Friendly · R+15
- County
- — inherits STATE
- City
- — inherits STATE
ZIP-level market 35768
- Home prices YoY
- -16.1%
- Active inventory
- 78
- Price-to-rent
- 8.8×
Monthly cashflow live
- Estimated rent
- $1,560 medium interval (Pro) →
- Mortgage (P&I)
- −$865
- Tax from tax record
- −$58 /mo · $696/yr
- Insurance
- −$69
- HOA
- −$0
- Vacancy / Maint / Mgmt
- −$328
- Net cashflow
- $241
Break-even live
UW: 25.0% down · 7.5% · 30yr · 1.5% tax · 5.0% vac · 8.0% maint · 8.0% mgmt
Financing live
Cash to close
- Down payment
- $41,225
- Closing costs
- $4,947
- Reserves months
- —
- Total cash needed
- —
Loan-product check · same deal, 3 products live
Conventional
25% down · 7.5% · 30yr
- Down + closing
- —
- Monthly P&I
- —
- Monthly cashflow
- —
- DSCR
- —
- Eligible?
- —
Personal DTI + credit; lowest rate.
DSCR
20% down · 8.5% · 30yr
- Down + closing
- —
- Monthly P&I
- —
- Monthly cashflow
- —
- DSCR
- —
- Eligible?
- —
No personal income docs; deal must DSCR.
Hard money
10% down · 12.0% · 12mo
- Down + closing
- —
- Monthly P&I
- —
- Monthly cashflow
- —
- DSCR
- —
- Eligible?
- —
Short-term bridge; refi at stabilization.
Rent comps 2 comps
| Address | Beds | Baths | Sqft | Rent | $/sqft | DOM | Units | Dist |
|---|---|---|---|---|---|---|---|---|
| 314 Beverly St Scottsboro, AL | 3.0 | 2.0 | 1247 | $1,550 | $1.24 | 14d | 1 | 0.20mi |
| 902 Sisk St Scottsboro, AL | 4.0 | 2.0 | 1400 | $1,600 | $1.14 | 14d | 1 | 0.96mi |
Listing history 19 events
-
2026-06-19days on market $164,900 Active 52 DOM
-
2026-06-18days on market $164,900 Active 51 DOM
-
2026-06-17days on market $164,900 Active 50 DOM
-
2026-06-16days on market $164,900 Active 49 DOM
-
2026-06-15days on market $164,900 Active 48 DOM
-
2026-06-14days on market $164,900 Active 46 DOM
-
2026-06-12days on market $164,900 Active 45 DOM
-
2026-06-09days on market $164,900 Active 42 DOM
-
2026-06-08days on market $164,900 Active 41 DOM
-
2026-06-07days on market $164,900 Active 40 DOM
-
2026-06-07days on market $164,900 Active 39 DOM
-
2026-06-04days on market $164,900 Active 36 DOM
-
2026-06-02days on market $164,900 Active 35 DOM
-
2026-06-01days on market $164,900 Active 34 DOM
-
2026-05-31days on market $164,900 Active 33 DOM
-
2026-05-31days on market $164,900 Active 32 DOM
-
2026-04-28$164,900 Active 338-char remark
-
2025-06-26price $165,000
-
2025-05-09$175,000 Active
ⓘ Source: listings_history table (triggers on properties + properties_extension) + one-shot
backfill from property_details.listing_events for pre-trigger history.
Tax reassessment forecast AL · Resets to sale price
- Current annual tax
- $696 · $58/mo
- Projected year-2 tax
- $696 · $58/mo
- Expected delta
- $0/yr ($0/mo · 0.0%)
ⓘ Screening estimate from a state-policy table — verify with the county assessor before closing.
Climate risk First Street
- Flood 1/10 Low FEMA zone X (unshaded) · 0% chance over 30 yrs
- Wildfire 4/10 Moderate
- Heat 6/10 Major 7 d/yr ≥107°F today · 20 d/yr by 30 yrs out
- Wind 4/10 Moderate 16% chance of damaging wind over 30 yrs
- Air quality 1/10 Low 0 unhealthy d/yr today · 0 by 30 yrs out
Nearby sold comps map
Loading sold comps map…
Walkable amenities ~0.75 mi
Loading nearby amenities…
Taxation est. · year 1
- Rental income
- $18,715
- − Mortgage interest
- −$9,237
- − Property taxes
- −$696
- − Insurance
- −$824
- − Repairs & maintenance
- −$1,497
- − Management
- −$1,497
- − Depreciation
- −$4,797
- Taxable income
- $166
- Est. tax owed @ 24.0%
- −$40
- After-tax cash flow
- $2,847/yr
For passive investors: Depreciation is non-cash, so a rental often shows a tax loss while cash-flowing — sheltering income. Rental losses are passive: they offset passive income freely, and up to $25,000/yr can offset ordinary (W-2) income if you actively participate and your MAGI is under $100k (phasing out to $0 by $150k); unused losses carry forward. On sale, claimed depreciation is recaptured at up to 25%, and gains may owe capital-gains tax (a 1031 exchange can defer both). Figures are a year-1 estimate at your 24.0% rate — not tax advice; consult a CPA.
Schools (NCES district)
- District
- Scottsboro City
- NCES district ID
- 0102940
- Math proficiency
- 27% ▼ -26.00%
- Reading proficiency
- 54% ▼ -3.00%
- Median HH income
- $38,210
- Composite
- 33.67/100
- National rank
- #5388
- State rank
- #27 of 129 in AL
Livability — Scottsboro
- Score
- 74/100
- State rank
- #21
- US rank
- #4752
Category grades
Schools grade is shown separately in the Schools card above.
Census & demographics
- Census place
- Scottsboro, AL
- Population (ZIP)
- 12,394
Population outlook (Jackson County) Hauer SSP2
- Today (2025)
- 50,261 people
- By 2030
- 48,655 · -3.2%
- By 2040
- 45,119 · -10.2%
- By 2050
- 41,518 · -17.4%
- By 2075
- 33,507 · -33.3%
- By 2100
- 26,385 · -47.5%
Race, ethnicity, and origin ACS 2023
- Neighborhood character
- Predominantly White (87%)
- Race & ethnicity
- White 87% Two or more races 5% Hispanic / Latino 4% Black 3% Native American 1%
- Common ancestry
- Serbian 2% Slovak 1% Iranian 1%
- Foreign-born
- 2% · Canada, Vietnam
- Languages at home
- 96% English-only · Spanish 3% Vietnamese 1%
Political lean MEDSL · Jackson
- 2024 margin
- Solid R (+71.4) · D 13.9% · R 85.4%
- 2008→2024 swing
- -34.5pp toward R · 2008: -36.9pp · 2024: -71.4pp
- All cycles
- 2024: R+71.4 2020: R+67.5 2016: R+62.5 2012: R+41.9 2008: R+36.9
Not yet ingested
- Civics
- —
Market trends
- HPI YoY
- ▼ -37.15%
- Current HPI
- 193.1223
- Rent YoY
- —
- Metro
- —
- State GDP YoY
- ▲ 2.94%
- F500 in state
- 4
Industry mix (Fortune 500 HQ in AL)
| Industry | F500 HQs | Revenue |
|---|---|---|
| Financial Services | 1 | $8B |
|
||
| Healthcare | 1 | $5B |
|
||
Price history
-5.8% since first listed3 events — show timeline
- 2026-04-28 Listed $164,900 VMLS
- 2025-06-26 Price Changed $165,000 VMLS
- 2025-05-09 Listed $175,000 VMLS
Property tax history
+7.8%/yrLatest (2025): $696 · -31.6% YoY. Source: county tax records.
Cash-flow waterfall
monthlySold comps — $/sqft
last 12 mo · ≤1 miLoading sold comps…