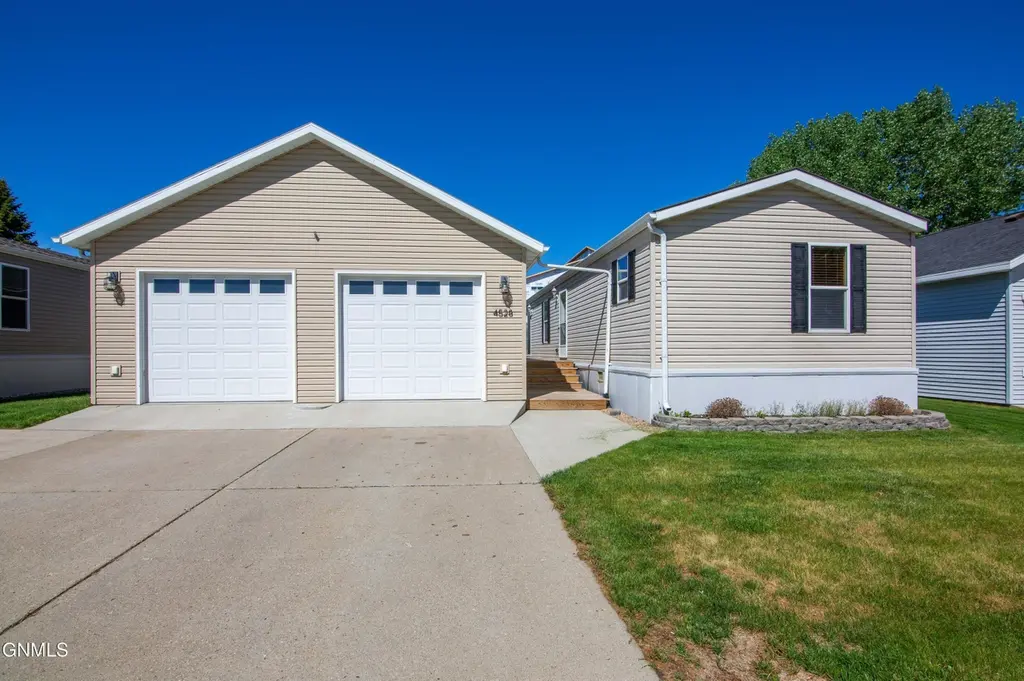
4528 Lafayette Dr · Bismarck, ND
Flood risk 4/10 · Minor
- FEMA flood zone
- X (unshaded)
- Chance of flooding over 30 yrs
- 0.22%
- Est. flood insurance / yr
- $507 – $1,088
Fire risk 4/10 · Minor
- Est. fire insurance / yr
- $1,289 – $2,393
Heat risk 2/10 · Minimal
- Hot days now (above 97°F)
- 7 days/yr
- Hot days in 30 yrs
- 12 days/yr
Wind risk 2/10 · Minimal
- Chance of severe wind over 30 yrs
- —
Air-quality risk 4/10 · Minor
- Unhealthy air days now
- 4 days/yr
- Unhealthy air days in 30 yrs
- 4 days/yr
Risk factors via First Street. Map © Google.
Why this score? — see what drove the D- grade
The composite is a weighted blend of 9 inputs, each scored 0–100. Each bar is that input's sub-score; the figure is the points it added to the 100-point composite (weight × sub-score).
- Cash flow +7.6/30.0
- 1% rule +7.5/10.0
- ARV discount +7.5/15.0
- Rent growth +5.0/5.0
- Livability +4.0/5.0
- Schools +3.7/10.0
- Condition / age +2.5/5.0
- DSCR +1.7/10.0
- Appreciation +0.0/10.0
$104,900
🖨 Deal sheet (PDF) 📄 Offer letter ✓ Due diligence
Listing remarks MLS
Beautiful one-owner, 3 bed, 2 bath home located in Century Park. Master bedroom has a large master bath with garden bathtub. Open kitchen has skylights, new flooring, new light fixtures, backsplash, and newer appliances. The large two-stall garage has a 12x32 loft for extra storage, a floor drain, and a plug-in for your camper. Enjoy your evenings in the gorgeous backyard that features a large deck with no backyard neighbors and a 10x12 storage shed. Call your favorite realtor for a showing today!
Key facts
- Primary suite
- Updated flooring
- Skylights
Tags
Property features AI
Finance
- HOA & community: Homeowners association with a monthly fee of $525; HOA fee includes water, sewer, and trash
Exterior
- Parking: Detached garage; 2 garage spaces; Garage door opener; Oversized garage; Concrete parking/driveway
- Utilities: Public water; Public sewer; Cable available
- Home design: Manufactured home (single wide); Residential property
- Construction: Vinyl siding
- Exterior features: Rain gutters; Rectangular lot
Interior
- Kitchen: Dishwasher; Gas range; Refrigerator
- Bedrooms: Manufactured home layout (bedroom details not specified)
- Bathrooms: 2 full bathrooms
- Heating & cooling: Central air conditioning; Forced air heating
- Interior features: Walk-in closet(s); Window treatments; Skylight(s)
- Laundry & utility: Washer; Dryer
Neighborhood map
What this means for you Summary
Snapshot
- This is a 3-bed/2.0-bath manufactured listed at $105k.
Deal economics
- At list price, monthly cash flow is $-127 ($-2k/yr) — negative.
- To cash-flow at today's rent, offer at most $82k (21.4% below list).
- Meets the 1% rule at list price ($1k rent vs $105k).
- Recommended offer: $82k (21.4% below list) — sets the bar for cash-flow.
- Cap rate 4.8% vs local median 3.1% in Bismarck — top-decile yield for the area; either an underpriced asset or a hidden risk that comps aren't pricing in. Stress-test before assuming the spread holds.
Location & tenants
- Location reads 79/100 on livability (#5 in ND, #2,213 nationally) — a middle-class / working-renter tenant base. Strengths: housing A+, health & safety A+, cost of living A; Watch: crime C-, amenities D+, commute F.
- Bismarck 1 (urban): math 41% / reading 42% proficiency, ranked #25 of 53 in ND (top 47%) — families likely to look elsewhere, expect single-tenant / working-renter base with shorter leases; only 19% free/reduced lunch — higher-income household profile.
- Zoned schools: Sunrise Elementary School (math 58% / reading 52%, grade C, #38 of 236 statewide, top 16%, 490 students, 14% FRL); Simle Middle School (math 34% / reading 39%, grade F, #22 of 35 statewide, top 62%, 1,040 students, 20% FRL); South Central Alternative High School (94 students, 100% FRL) — zoned schools average 45% FRL vs 19% district-wide (26 pts higher); higher-poverty schools than district average — tighter screening recommended.
- Market conditions: Rents rising fast (+10.8%/yr); 128 active listings in the ZIP; 3 comparable units currently listed for rent nearby; rentals at typical pace (median 23d on market — plan ~3-4 weeks tenant-placement turnaround); 259 units permitted in Burleigh County in 2024 (0 in 5+ unit buildings).
Forward outlook
- Local home prices are declining (-3.0%/yr); year-one equity from $725 of loan paydown is wiped out by about $3k of value loss. Plan a longer hold.
- Burleigh County population projected at +61% by 2050 — long-run rental-demand tailwind backs the buy-and-hold thesis.
Negotiation context
- Only 2 days on market — expect competitive offers; lowballing is unlikely to land.
- 2 sale attempts since 8y ago with the ask held roughly flat each time — persistent listings suggest the price (not the market) is what's stuck; bring a comps-based counter.
Risks & watch-outs
- Watch-outs: HOA is 40% of rent.
Questions for the listing agent
- What do current leases actually rent for vs. the listed asking? Can we see a recent rent roll and the last 12 months of T-12 income?
- What does the HOA fee cover, when was the last increase, and are there any pending special assessments or reserve-fund shortfalls?
- Is there a deadline driving the sale (1031 exchange, divorce, estate, relocation)? That informs how much negotiation room exists.
- Schools are B-rated — typically a magnet for longer-tenancy family renters. What's the average tenant stay here, and is there a school-zone premium baked into asking?
- The area grade is low — what's the realistic commute time and amenity access for the typical tenant pool here? Any planned neighborhood developments (good or bad) we should know about?
- What's the average days-on-market for RENTAL listings here right now (not sales)? A rising rental-DOM trend means longer vacancies and softer asking-rent achievability than the comps imply.
- What's the recent tenant-quality profile in this submarket — average credit score on applications, eviction rate, late-payment / NSF rate, and stable-employment percentage? A property-management company in the area should have these aggregated.
- How much new for-sale + rental construction is in the pipeline within 1–3 miles? Heavy new supply typically softens prices + rents 12–24 months out; constrained supply supports both.
Investment metrics
- 1% rule
- 1.25% ✓
- Cap rate
- 4.84%
- Cash-on-cash
- -5.20%
- DSCR
- 0.77
- GRM
- 6.6
CMA / ARV
- ARV (on-the-fly)
- $58,880
- Comps found
- 12
Show comp detail 12 sales within ~0.75 mi
| Address | Dist | Beds/Ba | Sqft | Sold | Price | $/sf | Match |
|---|---|---|---|---|---|---|---|
| 4303 Patriot Dr | 0.18mi | 3/2.0 | 1,280 (0%) | 4mo | $64,900 | $51 | 89 |
| 4117 W Arlington Dr | 0.27mi | 3/2.0 | 1,280 (0%) | 1mo | $49,900 | $39 | 86 |
| 5018 Sumter Dr | 0.25mi | 3/2.0 | 1,280 (0%) | 5mo | $105,000 | $82 | 84 |
| 4755 British Dr | 0.17mi | 3/2.0 | 1,216 (-5%) | 1mo | $54,000 | $44 | 83 |
| 4773 British Dr | 0.19mi | 3/2.0 | 1,216 (-5%) | 8mo | $115,000 | $95 | 77 |
| 4206 Patriot Dr | 0.31mi | 3/2.0 | 1,216 (-5%) | 2mo | $79,900 | $66 | 76 |
| 4731 British Dr | 0.17mi | 3/2.0 | 1,216 (-5%) | 11mo | $55,000 | $45 | 74 |
| 4202 Patriot Dr | 0.19mi | 3/2.0 | 1,216 (-5%) | 11mo | $65,000 | $53 | 74 |
| 5051 Redcoat Dr | 0.23mi | 3/2.0 | 1,216 (-5%) | 10mo | $56,000 | $46 | 73 |
| 2500 Centennial Rd Lot 240 | 0.71mi | 3/2.0 | 1,280 (0%) | 2mo | $45,900 | $36 | 65 |
| 2500 Centennial Rd #410 | 0.52mi | 3/2.0 | 1,424 (+11%) | 1mo | $49,000 | $34 | 56 |
| 2500 Centennial Rd #244 | 0.52mi | 3/2.0 | 1,446 (+13%) | 5mo | $60,000 | $41 | 50 |
Match score weights: distance 35% · size 25% · config 20% · recency 20%. Top-matched comps best support the ARV.
Projected returns pro-forma
-3.0% appreciation · 8.0% rent growth · sell at horizon
- IRR
- -15.9%
- Equity multiple
- 0.39×
- Total profit
- $-17,869
- Equity at exit
- $15,641
- IRR
- 2.4%
- Equity multiple
- 1.23×
- Total profit
- $6,804
- Equity at exit
- $9,070
Cash invested: $29,372 (down + closing). Projections, not guarantees.
Landlord ↔ Tenant lean methodology
- Overall (STATE)
- 82 Strongly Landlord-Friendly
- State North Dakota
- 82 Strongly Landlord-Friendly · R+20
- County
- — inherits STATE
- City
- — inherits STATE
ZIP-level market 58501
- Rents YoY
- 10.8%
- Active inventory
- 128
- Price-to-rent
- 6.6×
Monthly cashflow live
- Estimated rent
- $1,315 medium interval (Pro) →
- Mortgage (P&I)
- −$550
- Tax from tax record
- −$47 /mo · $567/yr
- Insurance
- −$44
- HOA
- −$525
- Lot rent leased land?
- −$0
- Vacancy / Maint / Mgmt
- −$276
- Net cashflow
- $-127
Break-even live
Sensitivity live
| Price | -10% $-68 | -5% $-98 | +0% $-127 | +5% $-157 | +10% $-187 |
|---|---|---|---|---|---|
| Rent | -10% $-231 | -5% $-179 | +0% $-127 | +5% $-75 | +10% $-23 |
| Rate | -1.0pp $-75 | -0.5pp $-101 | base $-127 | +0.5pp $-155 | +1.0pp $-182 |
UW: 25.0% down · 7.5% · 30yr · 1.5% tax · 5.0% vac · 8.0% maint · 8.0% mgmt
Financing live
Cash to close
- Down payment
- $26,225
- Closing costs
- $3,147
- Reserves months
- —
- Total cash needed
- —
Loan-product check · same deal, 3 products live
Conventional
25% down · 7.5% · 30yr
- Down + closing
- —
- Monthly P&I
- —
- Monthly cashflow
- —
- DSCR
- —
- Eligible?
- —
Personal DTI + credit; lowest rate.
DSCR
20% down · 8.5% · 30yr
- Down + closing
- —
- Monthly P&I
- —
- Monthly cashflow
- —
- DSCR
- —
- Eligible?
- —
No personal income docs; deal must DSCR.
Hard money
10% down · 12.0% · 12mo
- Down + closing
- —
- Monthly P&I
- —
- Monthly cashflow
- —
- DSCR
- —
- Eligible?
- —
Short-term bridge; refi at stabilization.
Rent comps 3 comps
| Address | Beds | Baths | Sqft | Rent | $/sqft | DOM | Units | Dist |
|---|---|---|---|---|---|---|---|---|
| 3504 French St Bismarck, ND | 2.0 | 1.5 | 966 | $1,795 | $1.86 | 23d | 1 | 0.84mi |
| 1511 Sharloh Loop Bismarck, ND | 3.0 | 2.5 | 1728 | $2,050 | $1.19 | 23d | 1 | 1.24mi |
| 3103 E Calgary Ave Bismarck, ND | 1.0–3.0 | 1.0–2.0 | 1079 | $1,860 | $1.72 | 23d | 6 | 1.34mi |
HOA detail
- Monthly dues
- $525 · $6,300/yr
Listing history 2 events
-
2026-06-07statusdays on market $104,900 Pending 2 DOM
-
2026-06-03$104,900 Active 1 DOM
ⓘ Source: listings_history table (triggers on properties + properties_extension) + one-shot
backfill from property_details.listing_events for pre-trigger history.
Tax reassessment forecast ND · Resets to sale price
- Current annual tax
- $567 · $47/mo
- Projected year-2 tax
- $1,028 · $86/mo
- Expected delta
- +$461/yr (+$38/mo · 81.3%)
ⓘ Screening estimate from a state-policy table — verify with the county assessor before closing.
Climate risk First Street
- Flood 4/10 Moderate FEMA zone X (unshaded) · 22% chance over 30 yrs
- Wildfire 4/10 Moderate
- Heat 2/10 Low 7 d/yr ≥97°F today · 12 d/yr by 30 yrs out
- Wind 2/10 Low
- Air quality 4/10 Moderate 4 unhealthy d/yr today · 4 by 30 yrs out
Nearby sold comps map
Loading sold comps map…
Walkable amenities ~0.75 mi
Loading nearby amenities…
Taxation est. · year 1
- Rental income
- $15,778
- − Mortgage interest
- −$5,876
- − Property taxes
- −$567
- − Insurance
- −$524
- − Repairs & maintenance
- −$1,262
- − Management
- −$1,262
- − HOA
- −$6,300
- − Depreciation
- −$3,052
- Taxable loss
- −$3,066
- Est. tax savings @ 24.0%
- +$736
- After-tax cash flow
- $-792/yr
For passive investors: Depreciation is non-cash, so a rental often shows a tax loss while cash-flowing — sheltering income. Rental losses are passive: they offset passive income freely, and up to $25,000/yr can offset ordinary (W-2) income if you actively participate and your MAGI is under $100k (phasing out to $0 by $150k); unused losses carry forward. On sale, claimed depreciation is recaptured at up to 25%, and gains may owe capital-gains tax (a 1031 exchange can defer both). Figures are a year-1 estimate at your 24.0% rate — not tax advice; consult a CPA.
Schools (NCES district)
- District
- Bismarck 1
- NCES district ID
- 3800014
- Math proficiency
- 41% ▼ -5.00%
- Reading proficiency
- 42% ▼ -6.00%
- Median HH income
- $60,649
- Composite
- 36.76/100
- National rank
- #4577
- State rank
- #25 of 53 in ND
Livability — Bismarck
- Score
- 79/100
- State rank
- #5
- US rank
- #2213
Category grades
Schools grade is shown separately in the Schools card above.
Census & demographics
- Census place
- Bismarck, ND
- County
- Burleigh County · 97,300 people
- City population
- 97,300
- Metro
- Bismarck, ND
- Population (ZIP)
- 29,405
- Household income
- $68,755
- Rent vs Own
- Severe rent burden
- 865.0
Population outlook (Burleigh County) Hauer SSP2
- Today (2025)
- 119,359 people
- By 2030
- 133,047 · +11.5%
- By 2040
- 161,545 · +35.3%
- By 2050
- 191,960 · +60.8%
- By 2075
- 274,569 · +130.0%
- By 2100
- 350,910 · +194.0%
Race, ethnicity, and origin ACS 2023
- Neighborhood character
- Predominantly White (82%)
- Race & ethnicity
- White 82% Native American 5% Two or more races 5% Black 4% Hispanic / Latino 4%
- Common ancestry
- Portuguese 14% Scotch-Irish 3% Lithuanian 3%
- Foreign-born
- 4% · Canada
- Languages at home
- 96% English-only · Spanish 2%
Political lean MEDSL · Burleigh
- 2024 margin
- Solid R (+43.2) · D 27.5% · R 70.7% · Other 1.8%
- 2008→2024 swing
- -19.7pp toward R · 2008: -23.6pp · 2024: -43.2pp
- All cycles
- 2024: R+43.2 2020: R+40.2 2016: R+46.1 2012: R+32.1 2008: R+23.6
Not yet ingested
- Civics
- —
Market trends
- HPI YoY
- ▼ -260.24%
- Current HPI
- 218.67
- Rent YoY
- ▲ 10.82%
- Metro
- Bismarck, ND
- State GDP YoY
- ▲ 2.09%
- F500 in state
- 2
Industry mix (Fortune 500 HQ in ND)
| Industry | F500 HQs | Revenue |
|---|---|---|
| Utilities / Construction | 1 | $6B |
|
||
Price history
+16.7% since first listed3 events — show timeline
- 2026-06-03 Listed $104,900 GNMLS
- 2018-09-14 Sold (MLS) — GNMLS
- 2018-07-23 Listed $89,900 GNMLS
Cash-flow waterfall
monthlySold comps — $/sqft
last 12 mo · ≤1 miLoading sold comps…