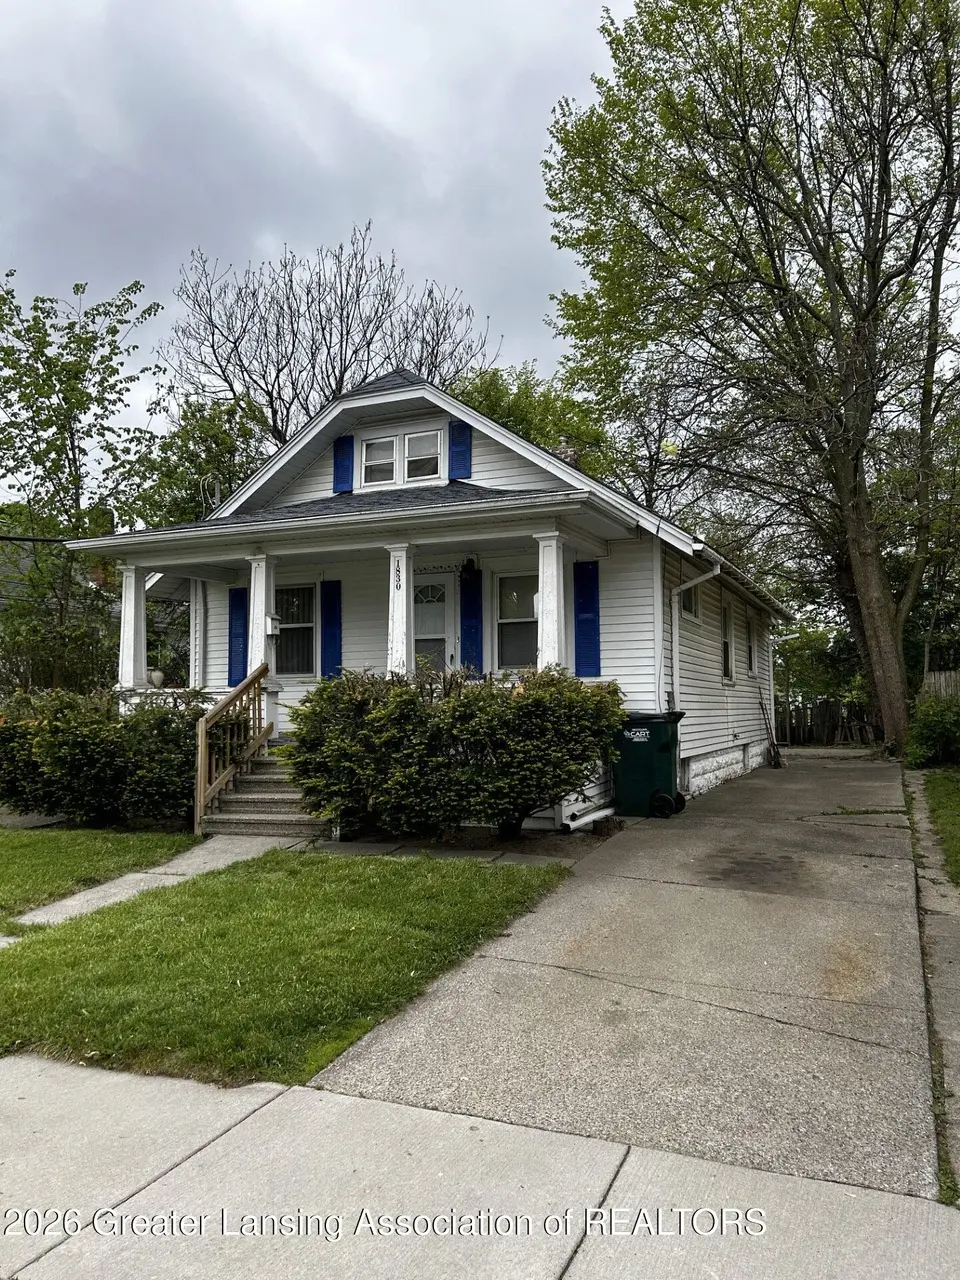
1830 Fletcher St · Lansing, MI
Flood risk 1/10 · Minimal
- FEMA flood zone
- X (unshaded)
- Chance of flooding over 30 yrs
- 0.0%
- Est. flood insurance / yr
- $473 – $860
Fire risk 1/10 · Minimal
- Est. fire insurance / yr
- $784 – $1,456
Heat risk 3/10 · Minor
- Hot days now (above 96°F)
- 7 days/yr
- Hot days in 30 yrs
- 16 days/yr
Wind risk 2/10 · Minimal
- Chance of severe wind over 30 yrs
- —
Air-quality risk 2/10 · Minimal
- Unhealthy air days now
- 1 days/yr
- Unhealthy air days in 30 yrs
- 2 days/yr
Risk factors via First Street. Map © Google.
Why this score? — see what drove the C- grade
The composite is a weighted blend of 9 inputs, each scored 0–100. Each bar is that input's sub-score; the figure is the points it added to the 100-point composite (weight × sub-score).
- Cash flow +21.1/30.0
- 1% rule +7.3/10.0
- ARV discount +6.8/15.0
- DSCR +6.7/10.0
- Livability +4.0/5.0
- Rent growth +3.7/5.0
- Condition / age +2.5/5.0
- Schools +1.9/10.0
- Appreciation +0.0/10.0
$89,900
🖨 Deal sheet (PDF) 📄 Offer letter ✓ Due diligence
Listing remarks MLS
Investor Alert - Cash-Flowing Rental with Tenant in Place! 1830 Fletcher Street, Lansing, MI 48910 Offered at $99,900, priced with equity. Turnkey rentals like this don't hit the market every day especially not with an active rental license, a stable long-term tenant already in place, and instant cash flow from day one. If you're looking to expand your portfolio in a strong rental market, this is your chance. This 2-bedroom, 1-bath home sits on a quiet, residential street in South Lansing, just minutes from major employers, shopping, and downtown. The house has good bones and is structurally sound, with plenty of upside through simple cosmetic updates. The current tenant has lived here long-term, pays on time, and wants to stay (section 8 - $1100). .. meaning you start earning income immediately. With forced-air heat, a fenced yard, and a full basement, this property checks all the boxes for renters -and makes ownership easy for landlords. The garage has been removed, eliminating exterior maintenance costs while opening up yard space. Whether you're a seasoned investor or just getting started, this is a rare opportunity to step into a performing asset without the hassle of finding tenants or navigating the licensing process. Everything is already in place. Priced to move. Licensed. Occupied. Cash flowing. Single unit. What are you waiting for? Schedule a showing today before another investor beats you to it.
Key facts
- 5,227 sq ft lot
- Built 1923
- Listed 24 days
Property features AI
Finance
- Financial info: Current use listed as rental/investment
Exterior
- Parking: On-site parking pad
- Security: Smoke detectors; Double pane windows
- Utilities: 100 amp electric service; Public sewer; Water available and connected; Natural gas available and connected; High-speed internet connected; Cable available; Phone available; Electricity connected
- Home design: Bungalow; One story; Built in 1923; Front faces east; City street frontage
- Construction: Aluminum siding; Shingle roof; Block foundation
- Exterior features: Private yard; Front and back yard; Few trees; Covered front porch
Interior
- Kitchen: Oven; Range; Refrigerator; Dining area combined with kitchen
- Bedrooms: 2 bedrooms (Primary bedroom); Bedroom sizes approximately 9.9 x 9.7 and 9.8 x 9.0
- Flooring: Carpet; Linoleum
- Bathrooms: 1 full bathroom
- Heating & cooling: Forced air heating (natural gas); No central cooling
- Interior features: Open floorplan; Basement: full, block
- Laundry & utility: Laundry located in basement
Neighborhood map
What this means for you Summary
Snapshot
- This is a 2-bed/1.0-bath single-family listed at $90k.
Deal economics
- At list price, monthly cash flow is $129 ($2k/yr) — positive.
- The deal already cash-flows at list — no discount required.
- Meets the 1% rule at list price ($1k rent vs $90k).
- Recommended offer: $89k (1.5% below list) — sets the bar for market timing.
- Cap rate 8.0% vs local median 6.0% in Lansing — top-decile yield for the area; either an underpriced asset or a hidden risk that comps aren't pricing in. Stress-test before assuming the spread holds.
Location & tenants
- Location reads 79/100 on livability (#94 in MI, #2,182 nationally) — a middle-class / working-renter tenant base. Strengths: amenities A+, commute A+, cost of living A+; Watch: employment D, schools F, crime F.
- Lansing Public School District (urban): math 14% / reading 23% proficiency, ranked #650 of 760 in MI (top 86%) — low school quality limits family demand, transient renter base, plan for 1-2y turnover; 68% free/reduced lunch — lower-income household profile, screen leases tightly.
- Market conditions: Rents rising fast (+4.7%/yr); 177 active listings in the ZIP; 21 comparable units currently listed for rent nearby; rentals at typical pace (median 22d on market — plan ~3-4 weeks tenant-placement turnaround); 43% of comp listings sitting > 30 days — soft ceiling on asking rent; 350 units permitted in Ingham County in 2024 (186 in 5+ unit buildings).
Forward outlook
- Local home prices are declining (-3.0%/yr); year-one equity from $622 of loan paydown is wiped out by about $3k of value loss. Plan a longer hold.
- Ingham County population projected at +11% by 2050 — modest demand growth; plan on rents tracking national, not racing it.
Negotiation context
- It's been on market 24 days — a 2% lower offer ($89k) is reasonable based on typical stale-listing flexibility.
- 4 sale attempts; this cycle's ask has dropped $10k (10%) from the opening price — seller is motivated, your offer sets the floor, not the list.
Risks & watch-outs
- Watch-outs: property tax is 3.1% of price; built in 1923 — expect roof / HVAC / electrical / plumbing capex.
Questions for the listing agent
- Built in 1923 — when were the roof, HVAC, electrical panel, plumbing, and water heater last replaced?
- Property tax is high relative to price — has the assessment been appealed recently, and will the sale trigger a re-assessment?
- Is there a deadline driving the sale (1031 exchange, divorce, estate, relocation)? That informs how much negotiation room exists.
- Schools are F-rated, which usually means shorter tenancies and higher turnover. Who's the typical renter profile here, and what's been the actual vacancy rate?
- Crime grade is F in this area — have there been break-ins, vandalism, or insurance claims at this property in the last 3 years? What carrier currently insures it and at what premium?
- What's the average days-on-market for RENTAL listings here right now (not sales)? A rising rental-DOM trend means longer vacancies and softer asking-rent achievability than the comps imply.
- What's the recent tenant-quality profile in this submarket — average credit score on applications, eviction rate, late-payment / NSF rate, and stable-employment percentage? A property-management company in the area should have these aggregated.
- How much new for-sale + rental construction is in the pipeline within 1–3 miles? Heavy new supply typically softens prices + rents 12–24 months out; constrained supply supports both.
Investment metrics
- 1% rule
- 1.23% ✓
- Cap rate
- 8.01%
- Cash-on-cash
- 6.15%
- DSCR
- 1.27
- GRM
- 6.8
CMA / ARV
- ARV (on-the-fly)
- $88,440
- Comps found
- 12
Show comp detail 12 sales within ~0.75 mi
| Address | Dist | Beds/Ba | Sqft | Sold | Price | $/sf | Match |
|---|---|---|---|---|---|---|---|
| 815 Smith Ave | 0.15mi | 2/1.0 | 664 (+1%) | 2mo | $125,000 | $188 | 90 |
| 1839 Fletcher St | 0.03mi | 2/2.0 | 682 (+3%) | 4mo | $135,000 | $198 | 86 |
| 2313 S Rundle Ave | 0.36mi | 2/1.0 | 664 (+1%) | 1mo | $118,500 | $178 | 82 |
| 2011 S Martin Luther King Jr Blvd | 0.14mi | 2/1.0 | 704 (+7%) | 5mo | $65,000 | $92 | 78 |
| 1209 W Mount Hope Ave | 0.15mi | 2/1.0 | 720 (+9%) | 0mo | $44,900 | $62 | 77 |
| 2011 Osband Ave | 0.37mi | 2/1.0 | 668 (+1%) | 6mo | $55,000 | $82 | 76 |
| 612 W Mount Hope Ave | 0.30mi | 2/1.0 | 699 (+6%) | 1mo | $51,000 | $73 | 76 |
| 907 Lenore Ave | 0.16mi | 2/1.0 | 715 (+8%) | 7mo | $62,000 | $87 | 72 |
| 900 W Mount Hope Ave | 0.11mi | 2/1.0 | 748 (+13%) | 3mo | $100,000 | $134 | 70 |
| 511 W Mount Hope Ave | 0.39mi | 2/1.0 | 600 (-9%) | 6mo | $70,000 | $117 | 62 |
| 1221 Moores River Dr | 0.46mi | 2/1.0 | 744 (+13%) | 3mo | $126,000 | $169 | 55 |
| 1209 W Rundle Ave | 0.51mi | 2/1.0 | 744 (+13%) | 10mo | $135,000 | $181 | 47 |
Match score weights: distance 35% · size 25% · config 20% · recency 20%. Top-matched comps best support the ARV.
Projected returns pro-forma
-3.0% appreciation · 4.71% rent growth · sell at horizon
- IRR
- -4.5%
- Equity multiple
- 0.83×
- Total profit
- $-4,334
- Equity at exit
- $13,404
- IRR
- 7.4%
- Equity multiple
- 1.61×
- Total profit
- $15,376
- Equity at exit
- $7,773
Cash invested: $25,172 (down + closing). Projections, not guarantees.
Landlord ↔ Tenant lean methodology
- Overall (STATE)
- 62 Landlord-Friendly
- State Michigan
- 62 Landlord-Friendly · EVEN
- County
- — inherits STATE
- City
- — inherits STATE
ZIP-level market 48910
- Rents YoY
- 4.7%
- Active inventory
- 177
- Price-to-rent
- 6.8×
Monthly cashflow live
- Estimated rent
- $1,103 high interval (Pro) →
- Mortgage (P&I)
- −$471
- Tax from tax record
- −$234 /mo · $2,806/yr
- Insurance
- −$37
- HOA
- −$0
- Vacancy / Maint / Mgmt
- −$232
- Net cashflow
- $129
Break-even live
Sensitivity live
| Price | -10% $180 | -5% $154 | +0% $129 | +5% $103 | +10% $78 |
|---|---|---|---|---|---|
| Rent | -10% $42 | -5% $85 | +0% $129 | +5% $173 | +10% $216 |
| Rate | -1.0pp $174 | -0.5pp $152 | base $129 | +0.5pp $106 | +1.0pp $82 |
UW: 25.0% down · 7.5% · 30yr · 1.5% tax · 5.0% vac · 8.0% maint · 8.0% mgmt
Financing live
Cash to close
- Down payment
- $22,475
- Closing costs
- $2,697
- Reserves months
- —
- Total cash needed
- —
Loan-product check · same deal, 3 products live
Conventional
25% down · 7.5% · 30yr
- Down + closing
- —
- Monthly P&I
- —
- Monthly cashflow
- —
- DSCR
- —
- Eligible?
- —
Personal DTI + credit; lowest rate.
DSCR
20% down · 8.5% · 30yr
- Down + closing
- —
- Monthly P&I
- —
- Monthly cashflow
- —
- DSCR
- —
- Eligible?
- —
No personal income docs; deal must DSCR.
Hard money
10% down · 12.0% · 12mo
- Down + closing
- —
- Monthly P&I
- —
- Monthly cashflow
- —
- DSCR
- —
- Eligible?
- —
Short-term bridge; refi at stabilization.
Rent comps 21 comps
| Address | Beds | Baths | Sqft | Rent | $/sqft | DOM | Units | Dist |
|---|---|---|---|---|---|---|---|---|
| 1828 Davis Ave Lansing, MI | 2.0 | 1.0 | 700 | $1,150 | $1.64 | 44d | 1 | 0.44mi |
| 915 Loa St Lansing, MI | 2.0 | 1.0 | 674 | $999 | $1.48 | 44d | 1 | 0.80mi |
| 3031 S Washington Ave Lansing, MI | 1.0–2.0 | 1.0 | 725 | $1,100 | $1.52 | 44d | 1 | 0.88mi |
| 920 S Washington Ave Lansing, MI | 1.0–2.0 | 1.0–2.0 | 900 | $1,250 | $1.39 | 14d | 1 | 0.99mi |
| 855 S Washington Ave Lansing, MI | 1.0 | 1.0 | 576 | $1,245 | $2.16 | 44d | 9 | 1.08mi |
| 855 S Washington Ave Lansing, MI | 1.0 | 1.0 | 576 | $1,245 | $2.16 | 21d | 3 | 1.08mi |
| 825 S Washington Ave Apt 103 Lansing, MI | 1.0 | 1.0 | 520 | $1,095 | $2.11 | 44d | 1 | 1.11mi |
| 515 S Chestnut St Lansing, MI | 1.0 | 1.0 | 646 | $942 | $1.46 | 14d | 8 | 1.11mi |
| 420 S Walnut St Lansing, MI | 1.0 | 1.0 | 525 | $875 | $1.67 | 44d | 1 | 1.20mi |
| 313 E Saint Joseph St Lansing, MI | 2.0 | 1.0 | 475 | $1,150 | $2.42 | 14d | 7 | 1.29mi |
| 335 E Saint Joseph St Unit 6 Lansing, MI | 2.0 | 1.0 | 700 | $949 | $1.36 | 44d | 1 | 1.32mi |
| 3334 Pleasant Grove Rd Unit 19 Lansing, MI | 2.0 | 1.0 | 700 | $999 | $1.43 | 14d | 1 | 1.33mi |
| 509 Cherry St Unit 2 Lansing, MI | 1.0 | 1.0 | 550 | $975 | $1.77 | 21d | 1 | 1.36mi |
| 1424 S Pennsylvania Ave Lansing, MI | 1.0 | 1.0 | 700 | $915 | $1.31 | 44d | 1 | 1.43mi |
| 1420 S Pennsylvania Ave Lansing, MI | 1.0 | 1.0 | 700 | $750 | $1.07 | 21d | 3 | 1.44mi |
| 3515 Bergman Ave Lansing, MI | 2.0 | 1.0 | 640 | $1,195 | $1.87 | 21d | 1 | 1.44mi |
| 3533 Bergman Ave Lansing, MI | 2.0 | 1.0 | 500 | $900 | $1.80 | 21d | 1 | 1.46mi |
| 2114 Ferrol St Unit 1 Lansing, MI | 2.0 | 1.0 | 700 | $950 | $1.36 | 21d | 1 | 1.47mi |
| 3529 Bergman Ave Unit Bergman 3533 Lansing, MI | 2.0 | 1.0 | 500 | $900 | $1.80 | 21d | 1 | 1.47mi |
| 3606 Pleasant Grove Rd Lansing, MI | 1.0–2.0 | 1.0 | 812 | $1,100 | $1.35 | 44d | 1 | 1.50mi |
| 3313 W Mt Hope Ave Lansing, MI | 2.0 | 1.0–2.0 | 869 | $1,296 | $1.49 | 14d | 6 | 1.50mi |
Listing history 20 events
-
2026-06-15statusdays on market $89,900 Pending 24 DOM
-
2026-06-14days on market $89,900 Active 23 DOM
-
2026-06-13days on market $89,900 Active 22 DOM
-
2026-06-10days on market $89,900 Active 20 DOM
-
2026-06-09remarks 699-char remark
-
2026-06-09pricedays on market $89,900 Active 19 DOM
-
2026-06-08days on market $99,900 Active 18 DOM
-
2026-06-07days on market $99,900 Active 17 DOM
-
2026-06-05days on market $99,900 Active 14 DOM
-
2026-06-03days on market $99,900 Active 13 DOM
-
2026-06-02days on market $99,900 Active 12 DOM
-
2026-06-01days on market $99,900 Active 11 DOM
-
2026-05-31days on market $99,900 Active 10 DOM
-
2026-05-30days on market $99,900 Active 9 DOM
-
2026-05-21$99,900 Active 1431-char remark
Show marketing remark (1431 chars)
Investor Alert - Cash-Flowing Rental with Tenant in Place! 1830 Fletcher Street, Lansing, MI 48910 Offered at $99,900, priced with equity. Turnkey rentals like this don't hit the market every day especially not with an active rental license, a stable long-term tenant already in place, and instant cash flow from day one. If you're looking to expand your portfolio in a strong rental market, this is your chance. This 2-bedroom, 1-bath home sits on a quiet, residential street in South Lansing, just minutes from major employers, shopping, and downtown. The house has good bones and is structurally sound, with plenty of upside through simple cosmetic updates. The current tenant has lived here long-term, pays on time, and wants to stay (section 8 - $1100). .. meaning you start earning income immediately. With forced-air heat, a fenced yard, and a full basement, this property checks all the boxes for renters -and makes ownership easy for landlords. The garage has been removed, eliminating exterior maintenance costs while opening up yard space. Whether you're a seasoned investor or just getting started, this is a rare opportunity to step into a performing asset without the hassle of finding tenants or navigating the licensing process. Everything is already in place. Priced to move. Licensed. Occupied. Cash flowing. Single unit. What are you waiting for? Schedule a showing today before another investor beats you to it.
-
2026-05-21$99,900 Active
Show marketing remark (1431 chars)
Investor Alert - Cash-Flowing Rental with Tenant in Place! 1830 Fletcher Street, Lansing, MI 48910 Offered at $99,900, priced with equity. Turnkey rentals like this don't hit the market every day especially not with an active rental license, a stable long-term tenant already in place, and instant cash flow from day one. If you're looking to expand your portfolio in a strong rental market, this is your chance. This 2-bedroom, 1-bath home sits on a quiet, residential street in South Lansing, just minutes from major employers, shopping, and downtown. The house has good bones and is structurally sound, with plenty of upside through simple cosmetic updates. The current tenant has lived here long-term, pays on time, and wants to stay (section 8 - $1100). .. meaning you start earning income immediately. With forced-air heat, a fenced yard, and a full basement, this property checks all the boxes for renters -and makes ownership easy for landlords. The garage has been removed, eliminating exterior maintenance costs while opening up yard space. Whether you're a seasoned investor or just getting started, this is a rare opportunity to step into a performing asset without the hassle of finding tenants or navigating the licensing process. Everything is already in place. Priced to move. Licensed. Occupied. Cash flowing. Single unit. What are you waiting for? Schedule a showing today before another investor beats you to it.
-
2025-11-11historical
-
2025-10-06$99,900 Active
-
2025-10-06historical
-
2025-09-23$105,000 Active
ⓘ Source: listings_history table (triggers on properties + properties_extension) + one-shot
backfill from property_details.listing_events for pre-trigger history.
Tax reassessment forecast MI · Partial reset (capped growth)
- Current annual tax
- $2,806 · $234/mo
- Projected year-2 tax
- $2,806 · $234/mo
- Expected delta
- $0/yr ($0/mo · 0.0%)
ⓘ Screening estimate from a state-policy table — verify with the county assessor before closing.
Climate risk First Street
- Flood 1/10 Low FEMA zone X (unshaded) · 0% chance over 30 yrs
- Wildfire 1/10 Low
- Heat 3/10 Moderate 7 d/yr ≥96°F today · 16 d/yr by 30 yrs out
- Wind 2/10 Low
- Air quality 2/10 Low 1 unhealthy d/yr today · 2 by 30 yrs out
Nearby sold comps map
Loading sold comps map…
Walkable amenities ~0.75 mi
Loading nearby amenities…
Taxation est. · year 1
- Rental income
- $13,241
- − Mortgage interest
- −$5,036
- − Property taxes
- −$2,806
- − Insurance
- −$450
- − Repairs & maintenance
- −$1,059
- − Management
- −$1,059
- − Depreciation
- −$2,615
- Taxable income
- $216
- Est. tax owed @ 24.0%
- −$52
- After-tax cash flow
- $1,496/yr
For passive investors: Depreciation is non-cash, so a rental often shows a tax loss while cash-flowing — sheltering income. Rental losses are passive: they offset passive income freely, and up to $25,000/yr can offset ordinary (W-2) income if you actively participate and your MAGI is under $100k (phasing out to $0 by $150k); unused losses carry forward. On sale, claimed depreciation is recaptured at up to 25%, and gains may owe capital-gains tax (a 1031 exchange can defer both). Figures are a year-1 estimate at your 24.0% rate — not tax advice; consult a CPA.
Schools (NCES district)
- District
- Lansing Public School District
- NCES district ID
- 2621150
- Math proficiency
- 14% ▲ 1.00%
- Reading proficiency
- 23% ▲ 3.00%
- Median HH income
- $37,453
- Composite
- 18.76/100
- National rank
- #14002
- State rank
- #650 of 760 in MI
Livability — Lansing
- Score
- 79/100
- State rank
- #94
- US rank
- #2182
Category grades
Schools grade is shown separately in the Schools card above.
Census & demographics
- Census place
- Lansing, MI
- County
- Ingham County · 237,052 people
- City population
- 161,269
- Metro
- Lansing-East Lansing, MI
- Population (ZIP)
- 32,800
- Household income
- $54,712
- Rent vs Own
- Severe rent burden
- 1305.0
Population outlook (Ingham County) Hauer SSP2
- Today (2025)
- 300,362 people
- By 2030
- 307,808 · +2.5%
- By 2040
- 320,492 · +6.7%
- By 2050
- 333,223 · +10.9%
- By 2075
- 373,693 · +24.4%
- By 2100
- 392,021 · +30.5%
Race, ethnicity, and origin ACS 2023
- Neighborhood character
- Diverse neighborhood (Simpson 0.62)
- Race & ethnicity
- White 58% Black 16% Hispanic / Latino 12% Two or more races 12% Asian 4% Native American 1%
- Hispanic origin (detail)
- Mexican 9% Cuban 2%
- Common ancestry
- Romanian 5% Lithuanian 3% Slovak 2%
- Foreign-born
- 9% · Canada, China, Vietnam
- Languages at home
- 87% English-only · Spanish 6% Chinese 1% Other Indo-European 1%
Political lean MEDSL · Ingham
- 2024 margin
- Strong D (+29.7) · D 63.9% · R 34.2% · Other 2.0%
- 2008→2024 swing
- -3.6pp toward R · 2008: 33.3pp · 2024: 29.7pp
- All cycles
- 2024: D+29.7 2020: D+32.2 2016: D+27.6 2012: D+27.9 2008: D+33.3
Not yet ingested
- Civics
- —
Market trends
- HPI YoY
- ▼ -211.82%
- Current HPI
- 196.8087
- Rent YoY
- ▲ 4.71%
- Metro
- Lansing-East Lansing, MI
- State GDP YoY
- ▲ 1.37%
- F500 in state
- 28
Industry mix (Fortune 500 HQ in MI)
| Industry | F500 HQs | Revenue |
|---|---|---|
| Automotive Parts | 3 | $48B |
|
||
| Automotive | 2 | $372B |
|
||
| Chemicals | 1 | $45B |
|
||
| Automotive Retail | 1 | $29B |
|
||
| Healthcare / Medical Devices | 1 | $23B |
|
||
| Automotive Technology | 1 | $20B |
|
||
Price history
-4.9% since first listed6 events — show timeline
- 2026-05-21 Listed $99,900 Greater Lansing AoR
- 2026-05-21 Listed $99,900 REALCOMP
- 2025-11-11 Listing Removed — REALCOMP
- 2025-10-06 Listing Removed — REALCOMP
- 2025-10-06 Listed $99,900 REALCOMP
- 2025-09-23 Listed $105,000 REALCOMP
Property tax history
+3.7%/yrLatest (2025): $2,806 · +3.0% YoY. Source: county tax records.
Cash-flow waterfall
monthlySold comps — $/sqft
last 12 mo · ≤1 miLoading sold comps…