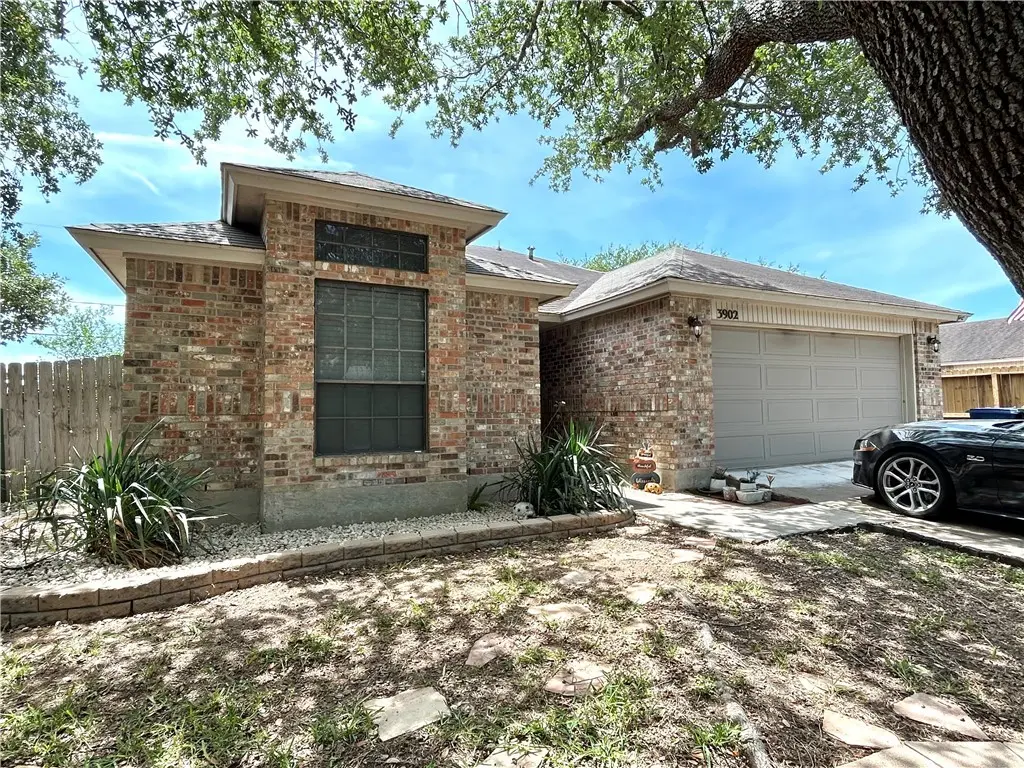
3902 Dunstain St · Corpus Christi, TX
Flood risk 1/10 · Minimal
- FEMA flood zone
- X (unshaded)
- Chance of flooding over 30 yrs
- 0.0%
- Est. flood insurance / yr
- $507 – $1,088
Fire risk 1/10 · Minimal
- Est. fire insurance / yr
- $1,222 – $2,270
Heat risk 9/10 · Severe
- Hot days now (above 110°F)
- 7 days/yr
- Hot days in 30 yrs
- 23 days/yr
Wind risk 9/10 · Severe
- Chance of severe wind over 30 yrs
- 99.0%
Air-quality risk 1/10 · Minimal
- Unhealthy air days now
- 0 days/yr
- Unhealthy air days in 30 yrs
- 0 days/yr
Risk factors via First Street. Map © Google.
Why this score? — see what drove the D grade
The composite is a weighted blend of 9 inputs, each scored 0–100. Each bar is that input's sub-score; the figure is the points it added to the 100-point composite (weight × sub-score).
- Cash flow +10.9/30.0
- ARV discount +10.9/15.0
- 1% rule +4.1/10.0
- Schools +3.9/10.0
- Livability +3.9/5.0
- DSCR +3.2/10.0
- Rent growth +3.0/5.0
- Condition / age +2.5/5.0
- Appreciation +0.0/10.0
$210,000
🖨 Deal sheet (PDF) 📄 Offer letter ✓ Due diligence
Listing remarks MLS
HARD TO FIND A HOME LIKE THIS ONE!WOW!VERY WELL MAINTAINED HOME. LOOKS LIKE NEW. OPEN LIVING, KITCHEN AND DINING AREA. SPLIT AND ROOMY BEDROOMS. WOODBURNING FIREPLACE. TILE THROUGHOUT WITH CARPET IN BEDROOMS. nICE SIZE BACKYARD. YOU WILL ENJOY SHOWING THIS HOME!
Key facts
- Dual lavatories
- Painted accent wall
- Cathedral ceiling
Tags
Property features AI
Exterior
- Parking: 2-car garage (front entry, concrete); 4 total parking spaces; 2 covered parking spaces
- Security: Smoke detector(s)
- Utilities: Public water; Public sewer
- Home design: Single-story home; Shingle roof; Brick, frame, and wood siding construction
- Construction: Slab foundation
- Exterior features: Open patio; Patio; Wood fencing; Landscaped, interior lot
Interior
- Kitchen: Electric oven; Electric range; Range hood; Dishwasher disposal; Refrigerator included
- Bedrooms: Primary bedroom located on the main level
- Flooring: Carpet; Ceramic tile; Vinyl
- Bathrooms: 2 full bathrooms
- Heating & cooling: Central heating (electric); Central air conditioning (electric)
- Interior features: Primary bedroom is downstairs; Split bedroom floorplan; Cable TV available; Window coverings / treatments; Ceiling fan(s)
- Laundry & utility: Washer hookup; Dryer hookup
Neighborhood map
What this means for you Summary
Snapshot
- This is a 3-bed/2.0-bath single-family listed at $210k.
Deal economics
- At list price, monthly cash flow is $-93 ($-1k/yr) — negative.
- To cash-flow at today's rent, offer at most $194k (7.8% below list).
- To meet the 1% rule (rent ≥ 1% of price), the offer needs to be $191k (9.1% below list).
- Recommended offer: $191k (9.1% below list) — sets the bar for 1% rule.
- Cap rate 5.8% vs local median 3.6% in Corpus Christi — top-decile yield for the area; either an underpriced asset or a hidden risk that comps aren't pricing in. Stress-test before assuming the spread holds.
Location & tenants
- Location reads 78/100 on livability (#66 in TX, #2,404 nationally) — a middle-class / working-renter tenant base. Strengths: commute A+, cost of living A+, housing A+; Watch: crime F.
- Calallen ISD (urban): math 42% / reading 44% proficiency, ranked #249 of 826 in TX (top 30%) — families likely to look elsewhere, expect single-tenant / working-renter base with shorter leases.
- Zoned schools: Calallen East El (math 22% / reading 22%, grade F, #3,333 of 4,322 statewide, top 80%, 475 students, 74% FRL); Calallen Middle (math 40% / reading 40%, grade F, #646 of 1,662 statewide, top 40%, 968 students, 53% FRL); Calallen H S (math 47% / reading 59%, grade C-, #437 of 1,632 statewide, top 27%, 1,180 students, 51% FRL) — zoned schools average 59% FRL vs 43% district-wide (16 pts higher); higher-poverty schools than district average — tighter screening recommended.
- Market conditions: Rents rising (+2.0%/yr); 339 active listings in the ZIP; 7 comparable units currently listed for rent nearby; rentals at typical pace (median 16d on market — plan ~3-4 weeks tenant-placement turnaround); solid renter incomes; 1,397 units permitted in Nueces County in 2024 (47 in 5+ unit buildings).
Forward outlook
- Local home prices are declining (-3.0%/yr); year-one equity from $1k of loan paydown is wiped out by about $6k of value loss. Plan a longer hold.
- Nueces County population projected at +36% by 2050 — long-run rental-demand tailwind backs the buy-and-hold thesis.
Negotiation context
- It's been on market 16 days — a 2% lower offer ($207k) is reasonable based on typical stale-listing flexibility.
- 4 sale attempts since 27y ago with the ask held roughly flat each time — persistent listings suggest the price (not the market) is what's stuck; bring a comps-based counter.
- Current owner paid $89k; list at $210k implies a 136% gain — meaningful room to come down on a strong offer.
Risks & watch-outs
- Climate carrying-cost: severe wind risk, 99% chance of damaging wind over 30y; extreme-heat days projected 7→23/yr by 2055 (HVAC capex compounding) — expect insurance premiums to compound above CPI over the hold.
Questions for the listing agent
- What do current leases actually rent for vs. the listed asking? Can we see a recent rent roll and the last 12 months of T-12 income?
- Is there a deadline driving the sale (1031 exchange, divorce, estate, relocation)? That informs how much negotiation room exists.
- Crime grade is F in this area — have there been break-ins, vandalism, or insurance claims at this property in the last 3 years? What carrier currently insures it and at what premium?
- The area grade is low — what's the realistic commute time and amenity access for the typical tenant pool here? Any planned neighborhood developments (good or bad) we should know about?
- What's the average days-on-market for RENTAL listings here right now (not sales)? A rising rental-DOM trend means longer vacancies and softer asking-rent achievability than the comps imply.
- What's the recent tenant-quality profile in this submarket — average credit score on applications, eviction rate, late-payment / NSF rate, and stable-employment percentage? A property-management company in the area should have these aggregated.
- How much new for-sale + rental construction is in the pipeline within 1–3 miles? Heavy new supply typically softens prices + rents 12–24 months out; constrained supply supports both.
Investment metrics
- 1% rule
- 0.91% ✗
- Cap rate
- 5.76%
- Cash-on-cash
- -1.90%
- DSCR
- 0.92
- GRM
- 9.2
CMA / ARV
- ARV (median comp)
- $227,362
- List price
- $210,000
- Delta
- -7.64%
- Verdict
- FAIR
- Comps
- 20 within 1.0 mi
Show comp detail 12 sales within ~0.75 mi
| Address | Dist | Beds/Ba | Sqft | Sold | Price | $/sf | Match |
|---|---|---|---|---|---|---|---|
| 3930 Dunstain St | 0.09mi | 3/2.0 | 1,240 (-2%) | 3mo | $169,000 | $136 | 90 |
| 11941 Yellow Oak Ave | 0.31mi | 3/2.0 | 1,318 (+4%) | 7mo | $234,900 | $178 | 73 |
| 11817 Jacob St | 0.14mi | 3/2.0 | 1,443 (+14%) | 2mo | $205,000 | $142 | 69 |
| 11901 Black Peak Dr | 0.38mi | 3/2.0 | 1,324 (+4%) | 8mo | $227,000 | $171 | 68 |
| 4113 Sierra St | 0.30mi | 3/2.0 | 1,393 (+10%) | 3mo | $214,900 | $154 | 67 |
| 3849 Silver Creek Dr | 0.24mi | 3/2.0 | 1,408 (+11%) | 8mo | $180,000 | $128 | 64 |
| 9541 Danish Oak Dr | 0.65mi | 3/2.0 | 1,263 (-0%) | 7mo | $274,490 | $217 | 63 |
| 11621 Saspamco Creek Dr | 0.21mi | 3/2.0 | 1,437 (+13%) | 9mo | $200,000 | $139 | 61 |
| 4233 Nolford Pl | 0.43mi | 3/2.0 | 1,157 (-9%) | 10mo | $216,500 | $187 | 57 |
| 4214 Western Dr | 0.39mi | 3/2.0 | 1,448 (+14%) | 9mo | $240,000 | $166 | 50 |
| 11610 Agua Dulce Creek Dr | 0.52mi | 3/2.0 | 1,429 (+13%) | 8mo | $229,500 | $161 | 48 |
| 9525 Danish Oak Dr | 0.65mi | 3/2.0 | 1,412 (+11%) | 4mo | $290,700 | $206 | 48 |
Match score weights: distance 35% · size 25% · config 20% · recency 20%. Top-matched comps best support the ARV.
Projected returns pro-forma
-3.0% appreciation · 1.98% rent growth · sell at horizon
- IRR
- -20.6%
- Equity multiple
- 0.29×
- Total profit
- $-41,768
- Equity at exit
- $31,312
- IRR
- -16.4%
- Equity multiple
- 0.13×
- Total profit
- $-51,302
- Equity at exit
- $18,157
Cash invested: $58,800 (down + closing). Projections, not guarantees.
Landlord ↔ Tenant lean methodology
- Overall (STATE)
- 87 Strongly Landlord-Friendly
- State Texas
- 87 Strongly Landlord-Friendly · R+5
- County
- — inherits STATE
- City
- — inherits STATE
ZIP-level market 78410
- Rents YoY
- 2.0%
- Active inventory
- 339
- Price-to-rent
- 9.2×
Monthly cashflow live
- Estimated rent
- $1,910 high interval (Pro) →
- Mortgage (P&I)
- −$1,101
- Tax from tax record
- −$413 /mo · $4,956/yr
- Insurance
- −$88
- HOA
- −$0
- Vacancy / Maint / Mgmt
- −$401
- Net cashflow
- $-93
Break-even live
Sensitivity live
| Price | -10% $26 | -5% $-34 | +0% $-93 | +5% $-152 | +10% $-212 |
|---|---|---|---|---|---|
| Rent | -10% $-244 | -5% $-168 | +0% $-93 | +5% $-18 | +10% $58 |
| Rate | -1.0pp $13 | -0.5pp $-40 | base $-93 | +0.5pp $-147 | +1.0pp $-203 |
UW: 25.0% down · 7.5% · 30yr · 1.5% tax · 5.0% vac · 8.0% maint · 8.0% mgmt
Financing live
Cash to close
- Down payment
- $52,500
- Closing costs
- $6,300
- Reserves months
- —
- Total cash needed
- —
Loan-product check · same deal, 3 products live
Conventional
25% down · 7.5% · 30yr
- Down + closing
- —
- Monthly P&I
- —
- Monthly cashflow
- —
- DSCR
- —
- Eligible?
- —
Personal DTI + credit; lowest rate.
DSCR
20% down · 8.5% · 30yr
- Down + closing
- —
- Monthly P&I
- —
- Monthly cashflow
- —
- DSCR
- —
- Eligible?
- —
No personal income docs; deal must DSCR.
Hard money
10% down · 12.0% · 12mo
- Down + closing
- —
- Monthly P&I
- —
- Monthly cashflow
- —
- DSCR
- —
- Eligible?
- —
Short-term bridge; refi at stabilization.
Rent comps 7 comps
| Address | Beds | Baths | Sqft | Rent | $/sqft | DOM | Units | Dist |
|---|---|---|---|---|---|---|---|---|
| 11934 Hearn Rd Unit 1351574P Corpus Christi, TX | 2.0 | 2.0 | 1022 | $2,613 | $2.56 | 45d | 1 | 0.27mi |
| 11613 Cripple Creek Dr Corpus Christi, TX | 3.0 | 2.0 | 1432 | $1,995 | $1.39 | 23d | 1 | 0.29mi |
| 11214 Willowood Creek Dr Corpus Christi, TX | 2.0 | 2.5 | 1253 | $1,400 | $1.12 | 15d | 1 | 0.61mi |
| 11202 Willowood Creek Dr Unit A Corpus Christi, TX | 2.0 | 2.5 | 1253 | $1,650 | $1.32 | 45d | 1 | 0.66mi |
| 11006 Timbergrove Ln Corpus Christi, TX | 3.0 | 2.0 | 1502 | $1,900 | $1.26 | 15d | 1 | 1.36mi |
| 4425 Fleetwood Ln Corpus Christi, TX | 2.0 | 1.0 | 920 | $1,000 | $1.09 | 15d | 1 | 1.38mi |
| 11110 Jackson Ter Corpus Christi, TX | 3.0 | 2.0 | 1630 | $2,100 | $1.29 | 15d | 1 | 1.39mi |
Listing history 13 events
-
2026-06-15status $210,000 Pending 16 DOM
-
2026-05-31days on market $210,000 Active 16 DOM
-
2026-05-30days on market $210,000 Active 15 DOM
-
2026-05-15$210,000 Active 868-char remark
-
2010-04-09soldstatus
-
2010-03-31soldstatus 262-char remark
Show marketing remark (262 chars)
HARD TO FIND A HOME LIKE THIS ONE!WOW!VERY WELL MAINTAINED HOME. LOOKS LIKE NEW. OPEN LIVING, KITCHEN AND DINING AREA. SPLIT AND ROOMY BEDROOMS. WOODBURNING FIREPLACE. TILE THROUGHOUT WITH CARPET IN BEDROOMS. nICE SIZE BACKYARD. YOU WILL ENJOY SHOWING THIS HOME!
-
2009-10-20$112,900 262-char remark
Show marketing remark (262 chars)
HARD TO FIND A HOME LIKE THIS ONE!WOW!VERY WELL MAINTAINED HOME. LOOKS LIKE NEW. OPEN LIVING, KITCHEN AND DINING AREA. SPLIT AND ROOMY BEDROOMS. WOODBURNING FIREPLACE. TILE THROUGHOUT WITH CARPET IN BEDROOMS. nICE SIZE BACKYARD. YOU WILL ENJOY SHOWING THIS HOME!
-
2007-10-22soldstatus
-
2007-10-18soldstatus
Show marketing remark (180 chars)
Charming, well maintained 3-2-2 home in Callicoatte Estates! Cozy kitchen with breakfast bar, wood-burning fireplace, tile throughout with carpet in bedrooms. This one won't last!
-
2007-08-30$129,900
Show marketing remark (180 chars)
Charming, well maintained 3-2-2 home in Callicoatte Estates! Cozy kitchen with breakfast bar, wood-burning fireplace, tile throughout with carpet in bedrooms. This one won't last!
-
2000-03-23soldstatus
-
2000-03-23soldstatus $89,000
-
1999-12-20$89,900
ⓘ Source: listings_history table (triggers on properties + properties_extension) + one-shot
backfill from property_details.listing_events for pre-trigger history.
Tax reassessment forecast TX · Resets to sale price
- Current annual tax
- $4,956 · $413/mo
- Projected year-2 tax
- $4,956 · $413/mo
- Expected delta
- $0/yr ($0/mo · 0.0%)
ⓘ Screening estimate from a state-policy table — verify with the county assessor before closing.
Climate risk First Street
- Flood 1/10 Low FEMA zone X (unshaded) · 0% chance over 30 yrs
- Wildfire 1/10 Low
- Heat 9/10 Extreme 7 d/yr ≥110°F today · 23 d/yr by 30 yrs out
- Wind 9/10 Extreme 99% chance of damaging wind over 30 yrs
- Air quality 1/10 Low 0 unhealthy d/yr today · 0 by 30 yrs out
Nearby sold comps map
Loading sold comps map…
Walkable amenities ~0.75 mi
Loading nearby amenities…
Taxation est. · year 1
- Rental income
- $22,918
- − Mortgage interest
- −$11,763
- − Property taxes
- −$4,956
- − Insurance
- −$1,050
- − Repairs & maintenance
- −$1,833
- − Management
- −$1,833
- − Depreciation
- −$6,109
- Taxable loss
- −$4,627
- Est. tax savings @ 24.0%
- +$1,110
- After-tax cash flow
- $-5/yr
For passive investors: Depreciation is non-cash, so a rental often shows a tax loss while cash-flowing — sheltering income. Rental losses are passive: they offset passive income freely, and up to $25,000/yr can offset ordinary (W-2) income if you actively participate and your MAGI is under $100k (phasing out to $0 by $150k); unused losses carry forward. On sale, claimed depreciation is recaptured at up to 25%, and gains may owe capital-gains tax (a 1031 exchange can defer both). Figures are a year-1 estimate at your 24.0% rate — not tax advice; consult a CPA.
Schools (NCES district)
- District
- Calallen ISD
- NCES district ID
- 4812420
- Math proficiency
- 42% ▼ -15.00%
- Reading proficiency
- 44% ▼ -9.00%
- Median HH income
- $73,780
- Composite
- 39.25/100
- National rank
- #4004
- State rank
- #249 of 826 in TX
Livability — Corpus Christi
- Score
- 78/100
- State rank
- #66
- US rank
- #2404
Category grades
Schools grade is shown separately in the Schools card above.
Census & demographics
- Census place
- Corpus Christi, TX
- County
- Nueces County · 296,836 people
- City population
- 296,836
- Metro
- Corpus Christi, TX
- Population (ZIP)
- 29,040
- Household income
- $79,308
- Rent vs Own
- Severe rent burden
- 324.0
Population outlook (Nueces County) Hauer SSP2
- Today (2025)
- 418,037 people
- By 2030
- 447,123 · +7.0%
- By 2040
- 505,911 · +21.0%
- By 2050
- 567,522 · +35.8%
- By 2075
- 729,686 · +74.6%
- By 2100
- 847,087 · +102.6%
Race, ethnicity, and origin ACS 2023
- Neighborhood character
- Majority Hispanic (59%)
- Race & ethnicity
- Hispanic / Latino 59% White 38% Two or more races 35% Black 1%
- Hispanic origin (detail)
- Mexican 54% Puerto Rican 2%
- Common ancestry
- Slovak 1% Lithuanian 1% Iranian 1%
- Foreign-born
- 6% · Canada
- Languages at home
- 71% English-only · Spanish 28%
Political lean MEDSL · Nueces
- 2024 margin
- R (+11.5) · D 43.8% · R 55.3%
- 2008→2024 swing
- -7.1pp toward R · 2008: -4.4pp · 2024: -11.5pp
- All cycles
- 2024: R+11.5 2020: R+2.9 2016: R+1.5 2012: R+3.2 2008: R+4.4
Not yet ingested
- Civics
- —
Market trends
- HPI YoY
- ▼ -145.45%
- Current HPI
- 174.0462
- Rent YoY
- ▲ 1.98%
- Metro
- Corpus Christi, TX
- State GDP YoY
- ▲ 3.95%
- F500 in state
- 110
Industry mix (Fortune 500 HQ in TX)
| Industry | F500 HQs | Revenue |
|---|---|---|
| Energy | 16 | $1,198B |
|
||
| Technology | 5 | $198B |
|
||
| Engineering / Construction | 4 | $72B |
|
||
| Energy Services | 3 | $60B |
|
||
| Utilities | 3 | $41B |
|
||
| Healthcare | 2 | $330B |
|
||
Price history
+133.6% since first listed12 events — show timeline
- 2026-06-14 Pending — CBMLS
- 2026-05-31 Delisted — CBMLS
- 2026-05-15 Listed $210,000 CBMLS
- 2010-04-09 Sold (Public Records) — Public Records
- 2010-03-31 Sold (MLS) — CBMLS
- 2009-10-20 Listed $112,900 CBMLS
- 2007-10-22 Sold (Public Records) — Public Records
- 2007-10-18 Sold (MLS) — CBMLS
- 2007-08-30 Listed $129,900 CBMLS
- 2000-03-23 Sold (Public Records) $89,000 Public Records
- 2000-03-23 Sold (MLS) — CBMLS
- 1999-12-20 Listed $89,900 CBMLS
Property tax history
+3.7%/yrLatest (2025): $4,956 · +10.3% YoY. Source: county tax records.
Cash-flow waterfall
monthlySold comps — $/sqft
last 12 mo · ≤1 miLoading sold comps…