1260 S Comstock Cir · Pahrump, NV
Flood risk 1/10 · Minimal
- FEMA flood zone
- X
- Chance of flooding over 30 yrs
- 0.0%
- Est. flood insurance / yr
- $441 – $928
Fire risk 2/10 · Minimal
- Est. fire insurance / yr
- $490 – $910
Heat risk 7/10 · Major
- Hot days now (above threshold)
- 6 days/yr
- Hot days in 30 yrs
- 14 days/yr
Wind risk No data
- Chance of severe wind over 30 yrs
- —
Air-quality risk No data
- Unhealthy air days now
- —
- Unhealthy air days in 30 yrs
- —
Risk factors via First Street. Map © Google.
Why this score? — see what drove the B+ grade
The composite is a weighted blend of 9 inputs, each scored 0–100. Each bar is that input's sub-score; the figure is the points it added to the 100-point composite (weight × sub-score).
- Cash flow +30.0/30.0
- ARV discount +15.0/15.0
- DSCR +10.0/10.0
- 1% rule +9.4/10.0
- Livability +3.4/5.0
- Rent growth +3.2/5.0
- Condition / age +2.5/5.0
- Schools +2.2/10.0
- Appreciation +0.0/10.0
$98,000
🖨 Deal sheet 📄 Offer letter ✓ Due diligence
Listing remarks MLS
Inexpensive living in Mobile home park, where you own your own land. Needs some TLC to bring back the life. Split floor plan, small fenced in yard. Community offers, recreation room, geen area, pool, tennis court.
Key facts
- Central location
- Pool
- Mountain view
Tags
Property features AI
Finance
- Financial info: Leased at $1,691 until 2026-12-31
- HOA & community: Comstock Park HOA (monthly fee: $28) — includes association management; Community amenities: basketball court, clubhouse, dog park, fitness center, jogging path, barbecue, playground, park, pool, recreation room, RV parking, spa/hot tub
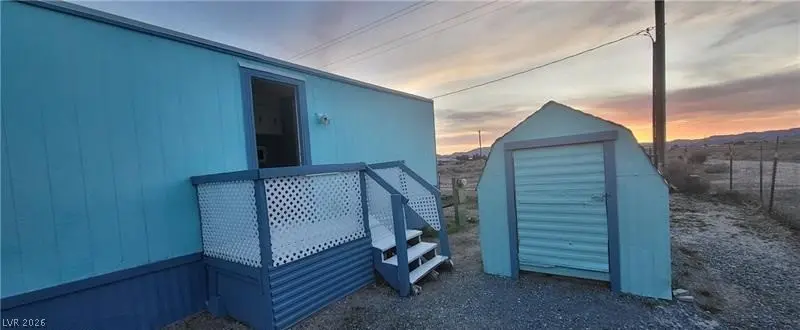
Exterior
- Parking: Open parking; RV access/parking; Guest parking
- Utilities: Electricity available; Public water; Public sewer
- Home design: Single-story home; Faces east; Single family zoning; Resale property
- Construction: Masonite and metal siding; Flat foam roof
- Exterior features: Porch; Private yard; Shed(s); Chain link and partial fencing; Community pool
Interior
- Kitchen: Built-in electric oven; Electric cooktop; Refrigerator
- Bedrooms: 3 possible bedrooms; Bedroom 2 on main level with closet (approx. 10x10); Bedroom 3 on main level with closet (approx. 10x10)
- Flooring: Carpet; Linoleum; Vinyl
- Bathrooms: 1 full bathroom; 1 three-quarter bathroom
- Heating & cooling: Electric heating (wall furnace); Electric cooling with window units
- Interior features: Blinds; Window treatments; Unfurnished; Bedroom on main level; Primary bedroom downstairs
- Laundry & utility: Electric dryer hookup; Dedicated laundry room
Neighborhood map
What this means for you Summary
Snapshot
- This is a 3-bed/2.0-bath manufactured listed at $98k.
Deal economics
- At list price, monthly cash flow is $508 ($6k/yr) — positive.
- The deal already cash-flows at list — no discount required.
- Meets the 1% rule at list price ($1k rent vs $98k).
- Recommended offer: $97k (1.5% below list) — sets the bar for market timing.
- Cap rate 12.5% vs local median 3.4% in Pahrump — top-decile yield for the area; either an underpriced asset or a hidden risk that comps aren't pricing in. Stress-test before assuming the spread holds.
Location & tenants
- Location reads 68/100 on livability (#30 in NV) — a middle-class / working-renter tenant base. Strengths: cost of living A+, housing A+, health & safety A+; Watch: employment D, schools F, crime F.
- Nye County School District (rural): math 20% / reading 33% proficiency, ranked #16 of 17 in NV (top 94%) — low school quality limits family demand, transient renter base, plan for 1-2y turnover.
- Market conditions: Rents rising (+2.7%/yr); 1116 active listings in the ZIP; 6 comparable units currently listed for rent nearby; rentals lingering (median 44d on market — plan ~5-8 weeks vacancy on turnover, expect pricing pressure); 100% of comp listings sitting > 30 days — soft ceiling on asking rent.
Forward outlook
- Local home prices are declining (-3.0%/yr); year-one equity from $678 of loan paydown is wiped out by about $3k of value loss. Plan a longer hold.
- Nye County population projected at -28% by 2050 — secular population decline; favor cash flow + early exit over multi-decade hold.
- At projected returns (-3.0% appreciation + 2.7% rent growth), your $27k cash investment doubles in ~6 years — after that, you're playing with house money.
Negotiation context
- It's been on market 27 days — a 2% lower offer ($97k) is reasonable based on typical stale-listing flexibility.
- 3 sale attempts since 17y ago with the ask held roughly flat each time — persistent listings suggest the price (not the market) is what's stuck; bring a comps-based counter.
- Current owner paid $14k; list at $98k implies a 626% gain — meaningful room to come down on a strong offer.
Risks & watch-outs
- Climate carrying-cost: extreme-heat days projected 6→14/yr by 2055 (HVAC capex compounding) — expect insurance premiums to compound above CPI over the hold.
Questions for the listing agent
- Built in 1977 — when were the roof, HVAC, electrical panel, plumbing, and water heater last replaced?
- What does the HOA fee cover, when was the last increase, and are there any pending special assessments or reserve-fund shortfalls?
- Is there a deadline driving the sale (1031 exchange, divorce, estate, relocation)? That informs how much negotiation room exists.
- Schools are F-rated, which usually means shorter tenancies and higher turnover. Who's the typical renter profile here, and what's been the actual vacancy rate?
- Crime grade is F in this area — have there been break-ins, vandalism, or insurance claims at this property in the last 3 years? What carrier currently insures it and at what premium?
- What's the average days-on-market for RENTAL listings here right now (not sales)? A rising rental-DOM trend means longer vacancies and softer asking-rent achievability than the comps imply.
- What's the recent tenant-quality profile in this submarket — average credit score on applications, eviction rate, late-payment / NSF rate, and stable-employment percentage? A property-management company in the area should have these aggregated.
- How much new for-sale + rental construction is in the pipeline within 1–3 miles? Heavy new supply typically softens prices + rents 12–24 months out; constrained supply supports both.
Investment metrics
- 1% rule
- 1.44% ✓
- Cap rate
- 12.51%
- Cash-on-cash
- 22.21%
- DSCR
- 1.99
- GRM
- 5.8
CMA / ARV
- ARV (on-the-fly)
- $141,453
- Comps found
- 12
Show comp detail 12 sales within ~0.75 mi
| Address | Dist | Beds/Ba | Sqft | Sold | Price | $/sf | Match |
|---|---|---|---|---|---|---|---|
| 261 Ferndell St | 0.09mi | 2/2.0 (-1) | 840 (+0%) | 7mo | $135,000 | $161 | 84 |
| 211 Kite St | 0.19mi | 3/2.0 | 940 (+12%) | 1mo | $155,000 | $165 | 70 |
| 310 Ferndell St | 0.06mi | 2/1.0 (-1) | 784 (-6%) | 12mo | $87,500 | $112 | 68 |
| 280 Copper Flats Dr | 0.17mi | 2/2.0 (-1) | 932 (+11%) | 1mo | $175,000 | $188 | 67 |
| 230 Greenwater St | 0.11mi | 2/1.5 (-1) | 903 (+8%) | 10mo | $162,000 | $179 | 67 |
| 320 W Ivy Ln | 0.06mi | 2/2.0 (-1) | 934 (+12%) | 12mo | $130,000 | $139 | 63 |
| 271 Copper Flats Dr | 0.16mi | 3/2.0 | 940 (+12%) | 11mo | $159,000 | $169 | 63 |
| 91 Steptoe St | 0.23mi | 2/1.0 (-1) | 788 (-6%) | 11mo | $200,000 | $254 | 62 |
| 130 W Rudy Rd | 0.20mi | 2/1.5 (-1) | 720 (-14%) | 0mo | $140,000 | $194 | 60 |
| 231 Ferndell St | 0.11mi | 2/1.0 (-1) | 752 (-10%) | 12mo | $190,000 | $253 | 59 |
| 220 Ferndell St | 0.13mi | 2/1.0 (-1) | 960 (+15%) | 5mo | $155,000 | $161 | 56 |
| 280 W Bonnie Claire Ct | 0.21mi | 2/2.0 (-1) | 720 (-14%) | 7mo | $55,000 | $76 | 56 |
Match score weights: distance 35% · size 25% · config 20% · recency 20%. Top-matched comps best support the ARV.
Projected returns pro-forma
-3.0% appreciation · 2.73% rent growth · sell at horizon
- IRR
- 14.7%
- Equity multiple
- 1.59×
- Total profit
- $16,062
- Equity at exit
- $14,612
- IRR
- 23.2%
- Equity multiple
- 2.97×
- Total profit
- $53,987
- Equity at exit
- $8,473
Cash invested: $27,440 (down + closing). Projections, not guarantees.
Landlord ↔ Tenant lean methodology
- Overall (STATE)
- 71 Landlord-Friendly
- State Nevada
- 71 Landlord-Friendly · R+1
- County
- — inherits STATE
- City
- — inherits STATE
ZIP-level market 89048
- Home prices YoY
- -7.2%
- Rents YoY
- 2.7%
- Active inventory
- 1116
- Price-to-rent
- 5.8×
Monthly cashflow live
- Estimated rent
- $1,411 high interval (Pro) →
- Mortgage (P&I)
- −$514
- Tax from tax record
- −$24 /mo · $285/yr
- Insurance
- −$41
- HOA
- −$28
- Vacancy / Maint / Mgmt
- −$296
- Net cashflow
- $508
Break-even live
UW: 25.0% down · 7.5% · 30yr · 1.5% tax · 5.0% vac · 8.0% maint · 8.0% mgmt
Financing live
Cash to close
- Down payment
- $24,500
- Closing costs
- $2,940
- Reserves months
- —
- Total cash needed
- —
Loan-product check · same deal, 3 products live
Conventional
25% down · 7.5% · 30yr
- Down + closing
- —
- Monthly P&I
- —
- Monthly cashflow
- —
- DSCR
- —
- Eligible?
- —
Personal DTI + credit; lowest rate.
DSCR
20% down · 8.5% · 30yr
- Down + closing
- —
- Monthly P&I
- —
- Monthly cashflow
- —
- DSCR
- —
- Eligible?
- —
No personal income docs; deal must DSCR.
Hard money
10% down · 12.0% · 12mo
- Down + closing
- —
- Monthly P&I
- —
- Monthly cashflow
- —
- DSCR
- —
- Eligible?
- —
Short-term bridge; refi at stabilization.
Rent comps 6 comps
| Address | Beds | Baths | Sqft | Rent | $/sqft | DOM | Units | Dist |
|---|---|---|---|---|---|---|---|---|
| 1401 Ogallala St Unit 4 Pahrump, NV | 3.0 | 2.0 | 1009 | $1,350 | $1.34 | 43d | 1 | 0.80mi |
| 1111 Sixshooter Ave Unit 3C Pahrump, NV | 2.0 | 2.0 | 910 | $1,150 | $1.26 | 43d | 1 | 0.82mi |
| 1081 Quartzite Ave #2 Pahrump, NV | 2.0 | 2.0 | 984 | $1,245 | $1.27 | 43d | 1 | 0.95mi |
| 1080 S Potro Ave #3 Pahrump, NV | 2.0 | 2.0 | 984 | $1,245 | $1.27 | 43d | 1 | 0.99mi |
| 1041 Marne Ct Unit 4 Pahrump, NV | 2.0 | 2.0 | 901 | $1,235 | $1.37 | 43d | 1 | 1.24mi |
| 1480 W Irons St Pahrump, NV | 2.0 | 2.0 | 980 | $1,600 | $1.63 | 43d | 1 | 1.37mi |
HOA detail
- Monthly dues
- $28 · $336/yr
- Likely covers
- pool
Listing history 23 events
-
2026-06-19days on market $98,000 Active 27 DOM
-
2026-06-18days on market $98,000 Active 26 DOM
-
2026-06-17days on market $98,000 Active 25 DOM
-
2026-06-16days on market $98,000 Active 24 DOM
-
2026-06-15days on market $98,000 Active 23 DOM
-
2026-06-14days on market $98,000 Active 21 DOM
-
2026-06-12days on market $98,000 Active 20 DOM
-
2026-06-09days on market $98,000 Active 17 DOM
-
2026-06-08days on market $98,000 Active 16 DOM
-
2026-06-07days on market $98,000 Active 15 DOM
-
2026-06-03days on market $98,000 Active 11 DOM
-
2026-06-02days on market $98,000 Active 10 DOM
-
2026-06-01days on market $98,000 Active 9 DOM
-
2026-05-31days on market $98,000 Active 8 DOM
-
2026-05-30days on market $98,000 Active 7 DOM
-
2026-05-23$98,000 Active
-
2024-03-21historical
-
2024-03-13price $100,000
-
2024-03-06price $129,888
-
2023-07-21$100,000 Active
-
2009-11-17soldstatus $13,500 213-char remark
Show marketing remark (213 chars)
Inexpensive living in Mobile home park, where you own your own land. Needs some TLC to bring back the life. Split floor plan, small fenced in yard. Community offers, recreation room, geen area, pool, tennis court.
-
2009-11-17historical 213-char remark
Show marketing remark (213 chars)
Inexpensive living in Mobile home park, where you own your own land. Needs some TLC to bring back the life. Split floor plan, small fenced in yard. Community offers, recreation room, geen area, pool, tennis court.
-
2009-10-09$11,000 213-char remark
Show marketing remark (213 chars)
Inexpensive living in Mobile home park, where you own your own land. Needs some TLC to bring back the life. Split floor plan, small fenced in yard. Community offers, recreation room, geen area, pool, tennis court.
ⓘ Source: listings_history table (triggers on properties + properties_extension) + one-shot
backfill from property_details.listing_events for pre-trigger history.
Tax reassessment forecast NV · Resets to sale price
- Current annual tax
- $285 · $24/mo
- Projected year-2 tax
- $578 · $48/mo
- Expected delta
- +$294/yr (+$24/mo · 103.1%)
ⓘ Screening estimate from a state-policy table — verify with the county assessor before closing.
Climate risk First Street
- Flood 1/10 Low FEMA zone X · 0% chance over 30 yrs
- Wildfire 2/10 Low
- Heat 7/10 Severe
Nearby sold comps map
Loading sold comps map…
Walkable amenities ~0.75 mi
Loading nearby amenities…
Taxation est. · year 1
- Rental income
- $16,927
- − Mortgage interest
- −$5,490
- − Property taxes
- −$285
- − Insurance
- −$490
- − Repairs & maintenance
- −$1,354
- − Management
- −$1,354
- − HOA
- −$336
- − Depreciation
- −$2,851
- Taxable income
- $4,767
- Est. tax owed @ 24.0%
- −$1,144
- After-tax cash flow
- $4,950/yr
For passive investors: Depreciation is non-cash, so a rental often shows a tax loss while cash-flowing — sheltering income. Rental losses are passive: they offset passive income freely, and up to $25,000/yr can offset ordinary (W-2) income if you actively participate and your MAGI is under $100k (phasing out to $0 by $150k); unused losses carry forward. On sale, claimed depreciation is recaptured at up to 25%, and gains may owe capital-gains tax (a 1031 exchange can defer both). Figures are a year-1 estimate at your 24.0% rate — not tax advice; consult a CPA.
Schools (NCES district)
- District
- Nye County School District
- NCES district ID
- 3200360
- Math proficiency
- 20% ▼ -6.00%
- Reading proficiency
- 33% ▼ -5.00%
- Median HH income
- $41,447
- Composite
- 22.43/100
- National rank
- #8110
- State rank
- #16 of 17 in NV
Livability — Pahrump
- Score
- 68/100
- State rank
- #30
- US rank
- #9226
Category grades
Schools grade is shown separately in the Schools card above.
Census & demographics
- Census place
- Pahrump, NV
- County
- Nye County · 47,491 people
- City population
- 47,491
- Metro
- Pahrump, NV
- Population (ZIP)
- 26,486
- Household income
- $61,367
- Rent vs Own
- Severe rent burden
- 939.0
Population outlook (Nye County) Hauer SSP2
- Today (2025)
- 40,727 people
- By 2030
- 38,812 · -4.7%
- By 2040
- 33,952 · -16.6%
- By 2050
- 29,393 · -27.8%
- By 2075
- 21,122 · -48.1%
- By 2100
- 14,400 · -64.6%
Race, ethnicity, and origin ACS 2023
- Neighborhood character
- Predominantly White (71%)
- Race & ethnicity
- White 71% Hispanic / Latino 13% Two or more races 12% Black 3% Asian 2% Native American 1%
- Hispanic origin (detail)
- Mexican 8%
- Common ancestry
- Lithuanian 3% Slovak 3% Serbian 2%
- Foreign-born
- 8% · Canada, South Korea
- Languages at home
- 89% English-only · Spanish 9% Tagalog/Filipino 1%
Political lean MEDSL · Nye
- 2024 margin
- Solid R (+42.2) · D 28.0% · R 70.2% · Other 1.8%
- 2008→2024 swing
- -28.8pp toward R · 2008: -13.4pp · 2024: -42.2pp
- All cycles
- 2024: R+42.2 2020: R+40.4 2016: R+42.0 2012: R+24.2 2008: R+13.4
Not yet ingested
- Civics
- —
Market trends
- HPI YoY
- ▼ -21.52%
- Current HPI
- 277.4486
- Rent YoY
- ▲ 2.73%
- Metro
- Pahrump, NV
- State GDP YoY
- ▲ 3.08%
- F500 in state
- 6
Industry mix (Fortune 500 HQ in NV)
| Industry | F500 HQs | Revenue |
|---|---|---|
| Hotels / Casinos | 3 | $36B |
|
||
Price history
+790.9% since first listed8 events — show timeline
- 2026-05-23 Listed $98,000 GLVAR
- 2024-03-21 Listing Removed — GLVAR
- 2024-03-13 Price Changed $100,000 GLVAR
- 2024-03-06 Price Changed $129,888 GLVAR
- 2023-07-21 Listed $100,000 GLVAR
- 2009-11-17 Listing Removed — GLVAR
- 2009-11-17 Sold (MLS) $13,500 GLVAR
- 2009-10-09 Listed $11,000 GLVAR
Property tax history
-0.6%/yrLatest (2025): $285 · +6.8% YoY. Source: county tax records.
Cash-flow waterfall
monthlySold comps — $/sqft
last 12 mo · ≤1 miLoading sold comps…