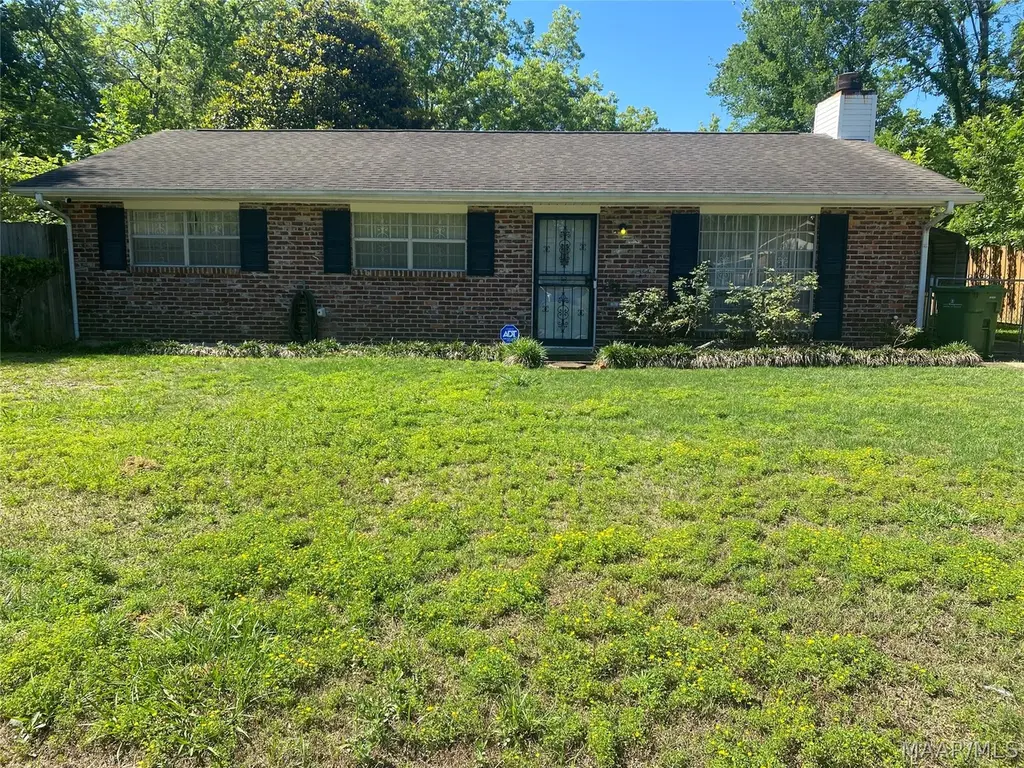
3910 Matterhorn St · Montgomery, AL
Flood risk 1/10 · Minimal
- FEMA flood zone
- X (unshaded)
- Chance of flooding over 30 yrs
- 0.0%
- Est. flood insurance / yr
- $507 – $1,088
Fire risk 3/10 · Minor
- Est. fire insurance / yr
- $916 – $1,700
Heat risk 7/10 · Major
- Hot days now (above 108°F)
- 7 days/yr
- Hot days in 30 yrs
- 20 days/yr
Wind risk 8/10 · Major
- Chance of severe wind over 30 yrs
- 80.0%
Air-quality risk 2/10 · Minimal
- Unhealthy air days now
- 1 days/yr
- Unhealthy air days in 30 yrs
- 1 days/yr
Risk factors via First Street. Map © Google.
Why this score? — see what drove the B grade
The composite is a weighted blend of 9 inputs, each scored 0–100. Each bar is that input's sub-score; the figure is the points it added to the 100-point composite (weight × sub-score).
- Cash flow +30.0/30.0
- ARV discount +13.9/15.0
- DSCR +10.0/10.0
- 1% rule +7.4/10.0
- Rent growth +3.9/5.0
- Livability +3.2/5.0
- Condition / age +2.5/5.0
- Schools +1.7/10.0
- Appreciation +0.0/10.0
$105,000
🖨 Deal sheet (PDF) 📄 Offer letter ✓ Due diligence
Listing remarks
Don't miss this opportunity! This home is ready for it's new owners, so pack your bags and move right in. This is a very nice three bedroom, two bath home, plus a covered patio and a fenced in backyard. The yard is great for cookouts and family gatherings. This home is sold-as-is. Please verify schools if important.
Key facts
- Fenced in backyard
- Covered patio
- 0.24 acre lot
Tags
Property features AI
Exterior
- Parking: Detached carport; Driveway; 1-car carport
- Security: Security system
- Utilities: Electricity available; Public water; Public sewer
- Home design: Single-story brick home; Slab foundation; Public road frontage (paved)
- Construction: Brick construction; Built according to public records
- Exterior features: Covered patio; Covered porch/patio; Fully fenced yard with privacy fencing; Storage structure
Interior
- Kitchen: Electric cooktop; Electric oven; Refrigerator
- Bedrooms: Bedroom(s) located on the first floor
- Flooring: Carpet; Laminate; Tile
- Bathrooms: 2 full bathrooms
- Heating & cooling: Central electric heating; Ceiling fan(s)
- Interior features: Blinds and window treatments; Pull-down attic stairs; Programmable thermostat; One fireplace
- Laundry & utility: Washer hookup; Washer included
Neighborhood map
What this means for you Summary
Snapshot
- This is a 3-bed/2.0-bath single-family listed at $105k.
Deal economics
- At list price, monthly cash flow is $400 ($5k/yr) — positive.
- The deal already cash-flows at list — no discount required.
- Meets the 1% rule at list price ($1k rent vs $105k).
- Recommended offer: $102k (3.0% below list) — sets the bar for market timing.
- Cap rate 10.9% vs local median 6.0% in Montgomery — top-decile yield for the area; either an underpriced asset or a hidden risk that comps aren't pricing in. Stress-test before assuming the spread holds.
Location & tenants
- Location reads 65/100 on livability (#138 in AL) — a middle-class / working-renter tenant base. Strengths: cost of living A+, housing A+; Watch: schools C-, employment D, crime F.
- Montgomery County (urban): math 9% / reading 31% proficiency, ranked #106 of 129 in AL (top 82%) — low school quality limits family demand, transient renter base, plan for 1-2y turnover; 70% free/reduced lunch — lower-income household profile, screen leases tightly.
- Market conditions: Rents rising fast (+5.7%/yr); 293 active listings in the ZIP; 14 comparable units currently listed for rent nearby; rentals lingering (median 45d on market — plan ~5-8 weeks vacancy on turnover, expect pricing pressure); 64% of comp listings sitting > 30 days — soft ceiling on asking rent; 460 units permitted in Montgomery County in 2024 (37 in 5+ unit buildings).
Forward outlook
- Local home prices are declining (-3.0%/yr); year-one equity from $726 of loan paydown is wiped out by about $3k of value loss. Plan a longer hold.
- Montgomery County population projected to shrink 8% by 2050 — rents likely to lag national; underwrite the cash flow, not the appreciation.
- At projected returns (-3.0% appreciation + 5.7% rent growth), your $29k cash investment doubles in ~7 years — after that, you're playing with house money.
Negotiation context
- It's been on market 34 days — a 3% lower offer ($102k) is reasonable based on typical stale-listing flexibility.
- 2 sale attempts with the ask held roughly flat each time — persistent listings suggest the price (not the market) is what's stuck; bring a comps-based counter.
Risks & watch-outs
- Climate carrying-cost: severe wind risk, 80% chance of damaging wind over 30y; extreme-heat days projected 7→20/yr by 2055 (HVAC capex compounding) — expect insurance premiums to compound above CPI over the hold.
Questions for the listing agent
- It's been on market 34 days. Have you received any prior offers? Is the seller open to a 3% concession, seller financing, or rate buy-down credit?
- Built in 1971 — when were the roof, HVAC, electrical panel, plumbing, and water heater last replaced?
- Is there a deadline driving the sale (1031 exchange, divorce, estate, relocation)? That informs how much negotiation room exists.
- Crime grade is F in this area — have there been break-ins, vandalism, or insurance claims at this property in the last 3 years? What carrier currently insures it and at what premium?
- What's the average days-on-market for RENTAL listings here right now (not sales)? A rising rental-DOM trend means longer vacancies and softer asking-rent achievability than the comps imply.
- What's the recent tenant-quality profile in this submarket — average credit score on applications, eviction rate, late-payment / NSF rate, and stable-employment percentage? A property-management company in the area should have these aggregated.
- How much new for-sale + rental construction is in the pipeline within 1–3 miles? Heavy new supply typically softens prices + rents 12–24 months out; constrained supply supports both.
Investment metrics
- 1% rule
- 1.24% ✓
- Cap rate
- 10.87%
- Cash-on-cash
- 16.34%
- DSCR
- 1.73
- GRM
- 6.7
CMA / ARV
- ARV (median comp)
- $122,269
- List price
- $105,000
- Delta
- -14.12%
- Verdict
- UNDERPRICED
- Comps
- 20 within 1.0 mi
Show comp detail 12 sales within ~0.75 mi
| Address | Dist | Beds/Ba | Sqft | Sold | Price | $/sf | Match |
|---|---|---|---|---|---|---|---|
| 3829 Chatwood St | 0.11mi | 3/2.0 | 1,232 (0%) | 13mo | $118,450 | $96 | 84 |
| 3976 Kimberly St | 0.17mi | 3/2.0 | 1,232 (0%) | 14mo | $90,000 | $73 | 80 |
| 4313 Meadowbriar Ct | 0.54mi | 3/2.0 | 1,232 (0%) | 2mo | $110,000 | $89 | 73 |
| 3946 Matterhorn St | 0.10mi | 3/2.0 | 1,096 (-11%) | 7mo | $91,500 | $83 | 71 |
| 2629 Shadowood Ct | 0.33mi | 3/2.0 | 1,150 (-7%) | 6mo | $57,000 | $50 | 68 |
| 3906 Chatwood St | 0.16mi | 4/2.0 (+1) | 1,372 (+11%) | 2mo | $62,500 | $46 | 67 |
| 3849 Chatwood St | 0.15mi | 3/1.5 | 1,120 (-9%) | 14mo | $49,350 | $44 | 64 |
| 4230 Knollgate Rd | 0.59mi | 3/2.0 | 1,170 (-5%) | 10mo | $80,000 | $68 | 56 |
| 3021 Dobbs Cir | 0.71mi | 3/2.0 | 1,153 (-6%) | 2mo | $106,900 | $93 | 55 |
| 4202 Matterhorn St | 0.55mi | 3/2.0 | 1,360 (+10%) | 15mo | $140,000 | $103 | 44 |
| 3135 Dobbs Dr | 0.72mi | 3/1.5 | 1,067 (-13%) | 4mo | $107,000 | $100 | 39 |
| 3041 Renee Dr | 0.67mi | 4/2.0 (+1) | 1,360 (+10%) | 14mo | $125,000 | $92 | 34 |
Match score weights: distance 35% · size 25% · config 20% · recency 20%. Top-matched comps best support the ARV.
Projected returns pro-forma
-3.0% appreciation · 5.65% rent growth · sell at horizon
- IRR
- 10.1%
- Equity multiple
- 1.41×
- Total profit
- $12,030
- Equity at exit
- $15,656
- IRR
- 21.1%
- Equity multiple
- 3.00×
- Total profit
- $58,665
- Equity at exit
- $9,078
Cash invested: $29,400 (down + closing). Projections, not guarantees.
Landlord ↔ Tenant lean methodology
- Overall (STATE)
- 90 Strongly Landlord-Friendly
- State Alabama
- 90 Strongly Landlord-Friendly · R+15
- County
- — inherits STATE
- City
- — inherits STATE
ZIP-level market 36116
- Home prices YoY
- -9.7%
- Rents YoY
- 5.7%
- Active inventory
- 293
- Price-to-rent
- 6.7×
Monthly cashflow live
- Estimated rent
- $1,307 high interval (Pro) →
- Mortgage (P&I)
- −$551
- Tax from tax record
- −$38 /mo · $455/yr
- Insurance
- −$44
- HOA
- −$0
- Vacancy / Maint / Mgmt
- −$275
- Net cashflow
- $400
Break-even live
Sensitivity live
| Price | -10% $460 | -5% $430 | +0% $400 | +5% $371 | +10% $341 |
|---|---|---|---|---|---|
| Rent | -10% $297 | -5% $349 | +0% $400 | +5% $452 | +10% $504 |
| Rate | -1.0pp $453 | -0.5pp $427 | base $400 | +0.5pp $373 | +1.0pp $346 |
UW: 25.0% down · 7.5% · 30yr · 1.5% tax · 5.0% vac · 8.0% maint · 8.0% mgmt
Financing live
Cash to close
- Down payment
- $26,250
- Closing costs
- $3,150
- Reserves months
- —
- Total cash needed
- —
Loan-product check · same deal, 3 products live
Conventional
25% down · 7.5% · 30yr
- Down + closing
- —
- Monthly P&I
- —
- Monthly cashflow
- —
- DSCR
- —
- Eligible?
- —
Personal DTI + credit; lowest rate.
DSCR
20% down · 8.5% · 30yr
- Down + closing
- —
- Monthly P&I
- —
- Monthly cashflow
- —
- DSCR
- —
- Eligible?
- —
No personal income docs; deal must DSCR.
Hard money
10% down · 12.0% · 12mo
- Down + closing
- —
- Monthly P&I
- —
- Monthly cashflow
- —
- DSCR
- —
- Eligible?
- —
Short-term bridge; refi at stabilization.
Rent comps 14 comps
| Address | Beds | Baths | Sqft | Rent | $/sqft | DOM | Units | Dist |
|---|---|---|---|---|---|---|---|---|
| 3855 Woodley Rd Montgomery, AL | 4.0 | 2.0 | 1450 | $1,450 | $1.00 | 44d | 1 | 0.23mi |
| 2699 Whispering Pine Dr Montgomery, AL | 4.0 | 2.0 | 1500 | $1,500 | $1.00 | 14d | 1 | 0.44mi |
| 3231 Virginia Pines Ln Montgomery, AL | 2.0 | 2.0 | 1068 | $800 | $0.75 | 44d | 1 | 0.99mi |
| 3240 Virginia Pines Ln Montgomery, AL | 3.0 | 2.0 | 1215 | $900 | $0.74 | 44d | 1 | 0.99mi |
| 4604 Virginia Loop Rd Montgomery, AL | 1.0–2.0 | 1.0–2.0 | 810 | $895 | $1.10 | 44d | 1 | 1.03mi |
| 4611 Virginia Loop Rd Montgomery, AL | 3.0 | 1.0 | 1029 | $1,195 | $1.16 | 22d | 1 | 1.11mi |
| 3212 Herbert Dr Montgomery, AL | 3.0 | 2.0 | 1180 | $1,425 | $1.21 | 22d | 1 | 1.18mi |
| 3110 Virginia Downs Montgomery, AL | 2.0 | 2.0 | 1068 | $800 | $0.75 | 44d | 1 | 1.18mi |
| 4025 Edge Hill Ln Montgomery, AL | 3.0 | 2.0 | 1154 | $1,350 | $1.17 | 14d | 1 | 1.21mi |
| 3220 Virginia Downs Montgomery, AL | 3.0 | 2.0 | 1215 | $900 | $0.74 | 44d | 1 | 1.25mi |
| 2619 Brantford Pl Montgomery, AL | 3.0 | 2.0 | 1323 | $1,200 | $0.91 | 44d | 1 | 1.28mi |
| 3248 Meadow Walk Ln Montgomery, AL | 3.0 | 2.0 | 1114 | $1,200 | $1.08 | 44d | 1 | 1.31mi |
| 2401 Overhill Rd Montgomery, AL | 3.0 | 1.0 | 999 | $700 | $0.70 | 22d | 1 | 1.38mi |
| 4220 Strathmore Dr Montgomery, AL | 1.0–3.0 | 1.0–2.0 | 931 | $1,099 | $1.18 | 44d | 1 | 1.41mi |
Listing history 17 events
-
2026-06-18days on market $105,000 Active 34 DOM
-
2026-06-17days on market $105,000 Active 33 DOM
-
2026-06-16days on market $105,000 Active 32 DOM
-
2026-06-15days on market $105,000 Active 31 DOM
-
2026-06-14days on market $105,000 Active 29 DOM
-
2026-06-13days on market $105,000 Active 28 DOM
-
2026-06-10days on market $105,000 Active 26 DOM
-
2026-06-09days on market $105,000 Active 25 DOM
-
2026-06-08days on market $105,000 Active 24 DOM
-
2026-06-07remarks 317-char remark
-
2026-06-07statusdays on market $105,000 Active 23 DOM
-
2026-06-03days on market $105,000 Contingent 19 DOM
-
2026-06-02days on market $105,000 Contingent 18 DOM
-
2026-06-01days on market $105,000 Contingent 17 DOM
-
2026-05-31days on market $105,000 Contingent 16 DOM
-
2026-05-30days on market $105,000 Contingent 15 DOM
-
2026-05-14$105,000 Active 292-char remark
ⓘ Source: listings_history table (triggers on properties + properties_extension) + one-shot
backfill from property_details.listing_events for pre-trigger history.
Tax reassessment forecast AL · Resets to sale price
- Current annual tax
- $455 · $38/mo
- Projected year-2 tax
- $455 · $38/mo
- Expected delta
- $0/yr ($0/mo · 0.0%)
ⓘ Screening estimate from a state-policy table — verify with the county assessor before closing.
Climate risk First Street
- Flood 1/10 Low FEMA zone X (unshaded) · 0% chance over 30 yrs
- Wildfire 3/10 Moderate
- Heat 7/10 Severe 7 d/yr ≥108°F today · 20 d/yr by 30 yrs out
- Wind 8/10 Severe 80% chance of damaging wind over 30 yrs
- Air quality 2/10 Low 1 unhealthy d/yr today · 1 by 30 yrs out
Nearby sold comps map
Loading sold comps map…
Walkable amenities ~0.75 mi
Loading nearby amenities…
Taxation est. · year 1
- Rental income
- $15,687
- − Mortgage interest
- −$5,882
- − Property taxes
- −$455
- − Insurance
- −$525
- − Repairs & maintenance
- −$1,255
- − Management
- −$1,255
- − Depreciation
- −$3,055
- Taxable income
- $3,261
- Est. tax owed @ 24.0%
- −$783
- After-tax cash flow
- $4,023/yr
For passive investors: Depreciation is non-cash, so a rental often shows a tax loss while cash-flowing — sheltering income. Rental losses are passive: they offset passive income freely, and up to $25,000/yr can offset ordinary (W-2) income if you actively participate and your MAGI is under $100k (phasing out to $0 by $150k); unused losses carry forward. On sale, claimed depreciation is recaptured at up to 25%, and gains may owe capital-gains tax (a 1031 exchange can defer both). Figures are a year-1 estimate at your 24.0% rate — not tax advice; consult a CPA.
Schools (NCES district)
- District
- Montgomery County
- NCES district ID
- 0102430
- Math proficiency
- 9% ▼ -21.00%
- Reading proficiency
- 31% ▼ -1.00%
- Median HH income
- $43,902
- Composite
- 17.24/100
- National rank
- #9093
- State rank
- #106 of 129 in AL
Livability — Montgomery
- Score
- 65/100
- State rank
- #138
- US rank
- #13416
Category grades
Schools grade is shown separately in the Schools card above.
Census & demographics
- Census place
- Montgomery, AL
- County
- Montgomery County · 190,016 people
- City population
- 175,913
- Metro
- Montgomery, AL
- Population (ZIP)
- 45,250
- Household income
- $55,160
- Rent vs Own
- Severe rent burden
- 2786.0
Population outlook (Montgomery County) Hauer SSP2
- Today (2025)
- 224,008 people
- By 2030
- 221,460 · -1.1%
- By 2040
- 214,179 · -4.4%
- By 2050
- 204,912 · -8.5%
- By 2075
- 177,821 · -20.6%
- By 2100
- 145,134 · -35.2%
Race, ethnicity, and origin ACS 2023
- Neighborhood character
- Predominantly Black (80%)
- Race & ethnicity
- Black 80% White 12% Two or more races 4% Asian 3% Hispanic / Latino 2%
- Common ancestry
- Italian 1%
- Foreign-born
- 5% · Canada, South Korea
- Languages at home
- 94% English-only · Spanish 2% Other Indo-European 1% Korean 1%
Political lean MEDSL · Montgomery
- 2024 margin
- Solid D (+30.7) · D 64.8% · R 34.1% · Other 1.1%
- 2008→2024 swing
- +11.5pp toward D · 2008: 19.2pp · 2024: 30.7pp
- All cycles
- 2024: D+30.7 2020: D+31.5 2016: D+26.2 2012: D+24.3 2008: D+19.2
Not yet ingested
- Civics
- —
Market trends
- HPI YoY
- ▼ -16.31%
- Current HPI
- 151.8598
- Rent YoY
- ▲ 5.65%
- Metro
- Montgomery, AL
- State GDP YoY
- ▲ 2.94%
- F500 in state
- 4
Industry mix (Fortune 500 HQ in AL)
| Industry | F500 HQs | Revenue |
|---|---|---|
| Financial Services | 1 | $8B |
|
||
| Healthcare | 1 | $5B |
|
||
Price history
3 events — show timeline
- 2026-06-05 Relisted — MAAR
- 2026-05-28 Contingent — MAAR
- 2026-05-14 Listed $105,000 MAAR
Property tax history
+6.8%/yrLatest (2025): $455 · -0.2% YoY. Source: county tax records.
Cash-flow waterfall
monthlySold comps — $/sqft
last 12 mo · ≤1 miLoading sold comps…