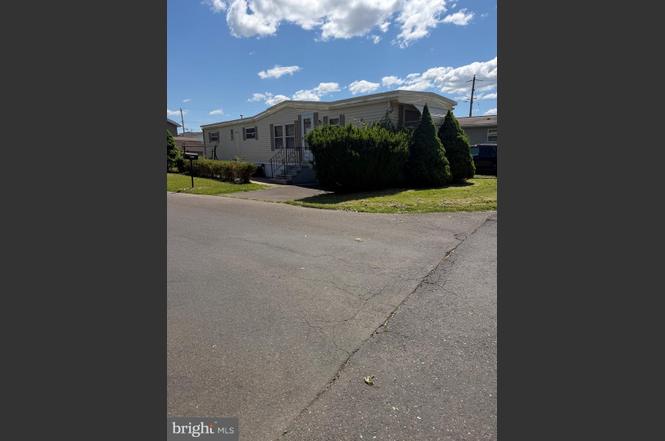
3413 Iris Ave · Bensalem, PA
Flood risk 1/10 · Minimal
- FEMA flood zone
- X (unshaded)
- Chance of flooding over 30 yrs
- 0.0%
- Est. flood insurance / yr
- $507 – $1,088
Fire risk 1/10 · Minimal
- Est. fire insurance / yr
- $511 – $949
Heat risk 6/10 · Moderate
- Hot days now (above 103°F)
- 7 days/yr
- Hot days in 30 yrs
- 15 days/yr
Wind risk 6/10 · Moderate
- Chance of severe wind over 30 yrs
- 27.0%
Air-quality risk 5/10 · Moderate
- Unhealthy air days now
- 6 days/yr
- Unhealthy air days in 30 yrs
- 8 days/yr
Risk factors via First Street. Map © Google.
Why this score? — see what drove the B- grade
The composite is a weighted blend of 9 inputs, each scored 0–100. Each bar is that input's sub-score; the figure is the points it added to the 100-point composite (weight × sub-score).
- Cash flow +30.0/30.0
- 1% rule +10.0/10.0
- DSCR +10.0/10.0
- ARV discount +7.5/15.0
- Rent growth +2.5/5.0
- Schools +2.5/10.0
- Livability +2.5/5.0
- Condition / age +2.5/5.0
- Appreciation +0.0/10.0
$85,000
🖨 Deal sheet 📄 Offer letter ✓ Due diligence
Listing remarks MLS
Newer paint, Newer carpet in bedroom, Some windows replaced. Back deck with roof. Front patio.
Key facts
- Covered deck
- Two driveways
- Newer roof
Tags
Property features AI
Finance
- HOA & community: Land lease community (monthly land lease of $840; approximately 1 year remaining)
Exterior
- Parking: Driveway
- Utilities: Public water; Public sewer
- Home design: Manufactured home; Single wide (12 ft x 60 ft); Estimated year built
- Construction: Aluminum siding; Other structures above and below grade
- Exterior features: Corner lot/unit; Located in Penn Valley Terrace; Bus stop within one mile
Interior
- Bedrooms: 3 bedrooms on the main level
- Bathrooms: 1 full bathroom
- Heating & cooling: Forced air heating (oil); Window air conditioning units (electric); Electric hot water
- Interior features: Estimated living area; No basement
Neighborhood map
What this means for you Summary
Snapshot
- This is a 3-bed/1.0-bath manufactured listed at $85k.
Deal economics
- At list price, monthly cash flow is $1k ($13k/yr) — positive.
- The deal already cash-flows at list — no discount required.
- Meets the 1% rule at list price ($2k rent vs $85k).
Location & tenants
- Location reads: area grade B — affects rentability + tenant quality, not the cash-flow math above.
- Bensalem Township SD (suburban): math 21% / reading 34% proficiency, ranked #447 of 539 in PA (top 83%) — low school quality limits family demand, transient renter base, plan for 1-2y turnover.
- Market conditions: 94 active listings in the ZIP; 2 comparable units currently listed for rent nearby; solid renter incomes; 663 units permitted in Bucks County in 2024 (106 in 5+ unit buildings).
Forward outlook
- Local home prices are declining (-3.0%/yr); year-one equity from $588 of loan paydown is wiped out by about $3k of value loss. Plan a longer hold.
- Bucks County population projected to shrink 7% by 2050 — rents likely to lag national; underwrite the cash flow, not the appreciation.
- At projected returns (-3.0% appreciation + 3.0% rent growth), your $24k cash investment doubles in ~3 years — after that, you're playing with house money.
Negotiation context
- Only 3 days on market — expect competitive offers; lowballing is unlikely to land.
- 3 sale attempts since 2y ago with the ask held roughly flat each time — persistent listings suggest the price (not the market) is what's stuck; bring a comps-based counter.
- Current owner paid $60k; 42% above their basis — modest negotiation headroom, anchor on the comps not their cost.
Risks & watch-outs
- Climate carrying-cost: major wind risk, 27% chance of damaging wind over 30y; extreme-heat days projected 7→15/yr by 2055 (HVAC capex compounding) — expect insurance premiums to compound above CPI over the hold.
Questions for the listing agent
- Is there a deadline driving the sale (1031 exchange, divorce, estate, relocation)? That informs how much negotiation room exists.
- What's the average days-on-market for RENTAL listings here right now (not sales)? A rising rental-DOM trend means longer vacancies and softer asking-rent achievability than the comps imply.
- What's the recent tenant-quality profile in this submarket — average credit score on applications, eviction rate, late-payment / NSF rate, and stable-employment percentage? A property-management company in the area should have these aggregated.
- How much new for-sale + rental construction is in the pipeline within 1–3 miles? Heavy new supply typically softens prices + rents 12–24 months out; constrained supply supports both.
Investment metrics
- 1% rule
- 2.40% ✓
- Cap rate
- 21.78%
- Cash-on-cash
- 55.31%
- DSCR
- 3.46
- GRM
- 3.5
CMA / ARV
No comps found within radius.
Projected returns pro-forma
-3.0% appreciation · 3.0% rent growth · sell at horizon
- IRR
- 53.6%
- Equity multiple
- 3.36×
- Total profit
- $56,085
- Equity at exit
- $12,674
- IRR
- 58.8%
- Equity multiple
- 6.83×
- Total profit
- $138,750
- Equity at exit
- $7,349
Cash invested: $23,800 (down + closing). Projections, not guarantees.
Landlord ↔ Tenant lean methodology
- Overall (STATE)
- 62 Landlord-Friendly
- State Pennsylvania
- 62 Landlord-Friendly · EVEN
- County
- — inherits STATE
- City
- — inherits STATE
ZIP-level market 19053
- Active inventory
- 94
- Price-to-rent
- 3.5×
Monthly cashflow live
- Estimated rent
- $2,038 medium interval (Pro) →
- Mortgage (P&I)
- −$446
- Tax from tax record
- −$32 /mo · $382/yr
- Insurance
- −$35
- HOA
- −$0
- Vacancy / Maint / Mgmt
- −$428
- Net cashflow
- $1,097
Break-even live
UW: 25.0% down · 7.5% · 30yr · 1.5% tax · 5.0% vac · 8.0% maint · 8.0% mgmt
Financing live
Cash to close
- Down payment
- $21,250
- Closing costs
- $2,550
- Reserves months
- —
- Total cash needed
- —
Loan-product check · same deal, 3 products live
Conventional
25% down · 7.5% · 30yr
- Down + closing
- —
- Monthly P&I
- —
- Monthly cashflow
- —
- DSCR
- —
- Eligible?
- —
Personal DTI + credit; lowest rate.
DSCR
20% down · 8.5% · 30yr
- Down + closing
- —
- Monthly P&I
- —
- Monthly cashflow
- —
- DSCR
- —
- Eligible?
- —
No personal income docs; deal must DSCR.
Hard money
10% down · 12.0% · 12mo
- Down + closing
- —
- Monthly P&I
- —
- Monthly cashflow
- —
- DSCR
- —
- Eligible?
- —
Short-term bridge; refi at stabilization.
Rent comps 2 comps
| Address | Beds | Baths | Sqft | Rent | $/sqft | DOM | Units | Dist |
|---|---|---|---|---|---|---|---|---|
| 2555 Old Trevose Rd Feasterville Trevose, PA | 2.0 | 1.0 | 610 | $1,999 | $3.28 | 1d | 15 | 1.03mi |
| 301 Heights Ln Feasterville Trevose, PA | 1.0–2.0 | 1.0 | 800 | $2,125 | $2.66 | 1d | 20 | 1.39mi |
Listing history 4 events
-
2026-06-18days on market $85,000 Active 3 DOM
-
2026-06-17days on market $85,000 Active 2 DOM
-
2026-06-15remarks 475-char remark
-
2026-06-15$85,000 Active 1 DOM
ⓘ Source: listings_history table (triggers on properties + properties_extension) + one-shot
backfill from property_details.listing_events for pre-trigger history.
Tax reassessment forecast PA · Partial reset (capped growth)
- Current annual tax
- $382 · $32/mo
- Projected year-2 tax
- $863 · $72/mo
- Expected delta
- +$480/yr (+$40/mo · 125.7%)
ⓘ Screening estimate from a state-policy table — verify with the county assessor before closing.
Climate risk First Street
- Flood 1/10 Low FEMA zone X (unshaded) · 0% chance over 30 yrs
- Wildfire 1/10 Low
- Heat 6/10 Major 7 d/yr ≥103°F today · 15 d/yr by 30 yrs out
- Wind 6/10 Major 27% chance of damaging wind over 30 yrs
- Air quality 5/10 Major 6 unhealthy d/yr today · 8 by 30 yrs out
Nearby sold comps map
Loading sold comps map…
Walkable amenities ~0.75 mi
Loading nearby amenities…
Taxation est. · year 1
- Rental income
- $24,457
- − Mortgage interest
- −$4,761
- − Property taxes
- −$382
- − Insurance
- −$425
- − Repairs & maintenance
- −$1,957
- − Management
- −$1,957
- − Depreciation
- −$2,473
- Taxable income
- $12,503
- Est. tax owed @ 24.0%
- −$3,001
- After-tax cash flow
- $10,164/yr
For passive investors: Depreciation is non-cash, so a rental often shows a tax loss while cash-flowing — sheltering income. Rental losses are passive: they offset passive income freely, and up to $25,000/yr can offset ordinary (W-2) income if you actively participate and your MAGI is under $100k (phasing out to $0 by $150k); unused losses carry forward. On sale, claimed depreciation is recaptured at up to 25%, and gains may owe capital-gains tax (a 1031 exchange can defer both). Figures are a year-1 estimate at your 24.0% rate — not tax advice; consult a CPA.
Schools (NCES district)
- District
- Bensalem Township SD
- NCES district ID
- 4203330
- Math proficiency
- 21% ▼ -16.00%
- Reading proficiency
- 34% ▼ -19.00%
- Median HH income
- $59,936
- Composite
- 25.03/100
- National rank
- #7554
- State rank
- #447 of 539 in PA
Livability — Bensalem
No livability data for this city. (Only ~50 U.S. cities are tracked.)
Census & demographics
- County
- Bucks County · 506,477 people
- City population
- 56,809
- Metro
- Philadelphia-Camden-Wilmington, PA-NJ-DE-MD
- Population (ZIP)
- 28,509
- Household income
- $107,780
- Rent vs Own
- Severe rent burden
- 422.0
Population outlook (Bucks County) Hauer SSP2
- Today (2025)
- 630,973 people
- By 2030
- 627,093 · -0.6%
- By 2040
- 609,680 · -3.4%
- By 2050
- 584,225 · -7.4%
- By 2075
- 539,840 · -14.4%
- By 2100
- 483,970 · -23.3%
Race, ethnicity, and origin ACS 2023
- Neighborhood character
- Predominantly White (80%)
- Race & ethnicity
- White 80% Asian 7% Two or more races 7% Black 5% Hispanic / Latino 3%
- Common ancestry
- Romanian 7% Scotch-Irish 6% Subsaharan African 5%
- Foreign-born
- 20% · Canada, Vietnam, China
- Languages at home
- 77% English-only · Russian/Polish/Slavic 10% Other Indo-European 3% Other Asian/Pacific 3%
Political lean MEDSL · Bucks
- 2024 margin
- Toss-up / Even · D 49.5% · R 49.5%
- 2008→2024 swing
- -8.7pp toward R · 2008: 8.7pp · 2024: -0.1pp
- All cycles
- 2024: R+0.1 2020: D+4.4 2016: D+0.6 2012: D+1.2 2008: D+8.7
Not yet ingested
- Civics
- —
Market trends
- HPI YoY
- ▼ -353.44%
- Current HPI
- 289.4267
- Rent YoY
- —
- Metro
- Philadelphia-Camden-Wilmington, PA-NJ-DE-MD
- State GDP YoY
- ▲ 1.68%
- F500 in state
- 34
Industry mix (Fortune 500 HQ in PA)
| Industry | F500 HQs | Revenue |
|---|---|---|
| Healthcare | 2 | $309B |
|
||
| Insurance | 2 | $27B |
|
||
| Telecommunications / Media | 1 | $124B |
|
||
| Industrial Distribution | 1 | $22B |
|
||
| Financial Services | 1 | $20B |
|
||
| Chemicals / Materials | 1 | $18B |
|
||
Price history
+13.6% since first listed7 events — show timeline
- 2026-06-15 Listed $85,000 BRIGHT MLS
- 2025-02-18 Sold (MLS) $60,000 BRIGHT MLS
- 2025-02-05 Pending — BRIGHT MLS
- 2025-01-18 Price Changed $60,000 BRIGHT MLS
- 2025-01-18 Relisted — BRIGHT MLS
- 2024-12-26 Pending — BRIGHT MLS
- 2024-11-18 Listed $74,850 BRIGHT MLS
Property tax history
+1.6%/yrLatest (2025): $382 · +4.2% YoY. Source: county tax records.
Cash-flow waterfall
monthlySold comps — $/sqft
last 12 mo · ≤1 miLoading sold comps…