 🏷️ Likely Rental
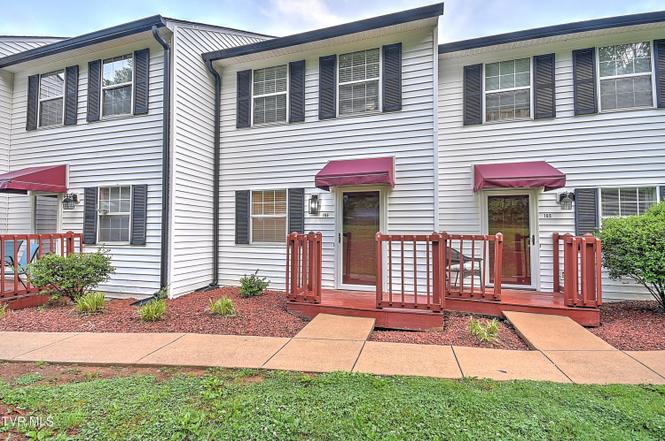
2971 Broad St #169 · Bristol, TN
Flood risk 9/10 · Severe
- FEMA flood zone
- A
- Chance of flooding over 30 yrs
- 0.99%
- Est. flood insurance / yr
- $946 – $6,584
Fire risk 4/10 · Minor
- Est. fire insurance / yr
- $949 – $1,763
Heat risk 4/10 · Minor
- Hot days now (above 98°F)
- 7 days/yr
- Hot days in 30 yrs
- 22 days/yr
Wind risk 2/10 · Minimal
- Chance of severe wind over 30 yrs
- —
Air-quality risk 2/10 · Minimal
- Unhealthy air days now
- 1 days/yr
- Unhealthy air days in 30 yrs
- 2 days/yr
Risk factors via First Street. Map © Google.
Why this score? — see what drove the D grade
The composite is a weighted blend of 9 inputs, each scored 0–100. Each bar is that input's sub-score; the figure is the points it added to the 100-point composite (weight × sub-score).
- Cash flow +15.0/30.0
- ARV discount +7.5/15.0
- 1% rule +5.0/10.0
- DSCR +5.0/10.0
- Livability +3.7/5.0
- Schools +3.0/10.0
- Rent growth +2.5/5.0
- Condition / age +2.5/5.0
- Appreciation +0.0/10.0
$1,495
🖨 Deal sheet 📄 Offer letter ✓ Due diligence
Listing remarks
* AVAILABLE 7/1/2026 * Welcome home! This beautifully remodeled townhome features 2 spacious bedrooms, 2 full bathrooms, and a versatile loft space perfect for a home office, playroom, or creative nook. The main floor offers an open-concept layout with a seamless flow between the living room, dining area, and kitchen--ideal for both everyday living and entertaining. Step outside to a private back deck that overlooks a walking path--perfect for morning coffee or unwinding in the evening. Additional highlights include one garage space plus extra parking. Conveniently located within a short drive to the hospital, downtown Bristol, HardRock casino, and The Pinnacle, this townhome offers the pe
Key facts
- Private back deck
- Remodeled townhome
- Versatile loft space
Tags
Property features AI
Exterior
- Parking: Attached garage; 1 garage space; Parking pad
- Utilities: Public water; Public sewer
- Home design: Townhouse; Three or more levels; Residential property; Vinyl siding exterior; Shingle roof; Block foundation
- Construction: Vinyl siding construction; Shingle roof; Block foundation
- Exterior features: Balcony; Level lot
Interior
- Kitchen: Dishwasher; Electric range; Refrigerator
- Bathrooms: 2 full bathrooms
- Heating & cooling: Heat pump heating; Heat pump cooling
- Interior features: Open floorplan; Eat-in kitchen; Basement partially finished (finished and unfinished areas)
Neighborhood map
What this means for you Summary
Snapshot
- This is a 2-bed/2.0-bath single-family listed at $1k.
Deal economics
- At list price, monthly cash flow is $911 ($11k/yr) — positive.
- The deal already cash-flows at list — no discount required.
- Meets the 1% rule at list price ($2k rent vs $1k).
- Cap rate 989.2% vs local median 3.8% in Bristol — top-decile yield for the area; either an underpriced asset or a hidden risk that comps aren't pricing in. Stress-test before assuming the spread holds.
Location & tenants
- Location reads 73/100 on livability (#24 in TN) — a middle-class / working-renter tenant base. Strengths: cost of living A+, housing A+, health & safety A+; Watch: crime D+, commute F, employment F.
- Bristol (urban): math 37% / reading 35% proficiency, ranked #29 of 139 in TN (top 21%) — families likely to look elsewhere, expect single-tenant / working-renter base with shorter leases.
- Zoned schools: Anderson Elementary (math 22% / reading 27%, grade F, #546 of 952 statewide, top 61%, 308 students, 0% FRL); Tennessee High School (math 20% / reading 41%, grade F, #75 of 332 statewide, top 24%, 1,154 students, 0% FRL) — zoned schools average 0% FRL vs 46% district-wide (46 pts lower); this property's tenant base skews higher-income than the district average.
- Market conditions: 253 active listings in the ZIP; 6 comparable units currently listed for rent nearby; rentals at typical pace (median 21d on market — plan ~3-4 weeks tenant-placement turnaround); 453 units permitted in Sullivan County in 2024 (6 in 5+ unit buildings).
- This rent runs 33% of the median local income ($56k/yr) — at the standard rent-burdened threshold; future hikes will face affordability resistance.
Forward outlook
- Local home prices are declining (-3.0%/yr); year-one equity from $10 of loan paydown is wiped out by about $45 of value loss. Plan a longer hold.
- Sullivan County population projected to shrink 5% by 2050 — rents likely to lag national; underwrite the cash flow, not the appreciation.
- At projected returns (-3.0% appreciation + 3.0% rent growth), your $419 cash investment doubles in ~1 year — after that, you're playing with house money.
Negotiation context
- Only 3 days on market — expect competitive offers; lowballing is unlikely to land.
Risks & watch-outs
- Watch-outs: flood insurance adds $314/mo.
- Climate carrying-cost: in FEMA flood zone A (mandatory federal flood insurance) — expect insurance premiums to compound above CPI over the hold.
Questions for the listing agent
- What's the actual annual flood-insurance premium (NFIP or private), and is the property in a SFHA with mandatory coverage?
- Is there a deadline driving the sale (1031 exchange, divorce, estate, relocation)? That informs how much negotiation room exists.
- Schools are D-rated, which usually means shorter tenancies and higher turnover. Who's the typical renter profile here, and what's been the actual vacancy rate?
- Crime grade is D in this area — have there been break-ins, vandalism, or insurance claims at this property in the last 3 years? What carrier currently insures it and at what premium?
- The area grade is low — what's the realistic commute time and amenity access for the typical tenant pool here? Any planned neighborhood developments (good or bad) we should know about?
- What's the average days-on-market for RENTAL listings here right now (not sales)? A rising rental-DOM trend means longer vacancies and softer asking-rent achievability than the comps imply.
- What's the recent tenant-quality profile in this submarket — average credit score on applications, eviction rate, late-payment / NSF rate, and stable-employment percentage? A property-management company in the area should have these aggregated.
- How much new for-sale + rental construction is in the pipeline within 1–3 miles? Heavy new supply typically softens prices + rents 12–24 months out; constrained supply supports both.
Investment metrics
- 1% rule
- 104.56% ✓
- Cap rate
- 989.21%
- Cash-on-cash
- 3510.44%
- DSCR
- 157.19
- GRM
- 0.1
CMA / ARV
- ARV (on-the-fly)
- $230,552
- Comps found
- 12
Show comp detail 12 sales within ~0.75 mi
| Address | Dist | Beds/Ba | Sqft | Sold | Price | $/sf | Match |
|---|---|---|---|---|---|---|---|
| 2971 Broad St #163 | 0.00mi | 2/2.0 | 1,288 (0%) | 3mo | $1,695 | $1 | 98 |
| 2971 Broad St #164 | 0.00mi | 2/2.0 | 1,288 (0%) | 6mo | $1,795 | $1 | 95 |
| 2971 Broad St #166 | 0.04mi | 2/2.0 | 1,288 (0%) | 10mo | $1,695 | $1 | 90 |
| 104 Saint James Pl | 0.11mi | 3/2.0 (+1) | 1,228 (-5%) | 4mo | $220,000 | $179 | 78 |
| 108 Boardwalk | 0.08mi | 3/2.5 (+1) | 1,400 (+9%) | 3mo | $255,000 | $182 | 72 |
| 105 Saint James Pl | 0.14mi | 3/2.0 (+1) | 1,150 (-11%) | 2mo | $214,000 | $186 | 69 |
| 121 Saint James Pl | 0.16mi | 3/2.5 (+1) | 1,422 (+10%) | 0mo | $255,000 | $179 | 68 |
| 124 Boardwalk | 0.11mi | 3/2.5 (+1) | 1,440 (+12%) | 8mo | $244,900 | $170 | 62 |
| 2645 Anderson St | 0.64mi | 3/2.0 (+1) | 1,160 (-10%) | 0mo | $249,985 | $216 | 48 |
| 2643 Anderson St | 0.65mi | 3/2.0 (+1) | 1,160 (-10%) | 0mo | $252,000 | $217 | 48 |
| 2641 Anderson St | 0.66mi | 3/2.0 (+1) | 1,160 (-10%) | 4mo | $249,000 | $215 | 45 |
| 120 Flint St | 0.54mi | 3/2.0 (+1) | 1,148 (-11%) | 10mo | $200,000 | $174 | 44 |
Match score weights: distance 35% · size 25% · config 20% · recency 20%. Top-matched comps best support the ARV.
Projected returns pro-forma
-3.0% appreciation · 3.0% rent growth · sell at horizon
- IRR
- —
- Equity multiple
- 139.52×
- Total profit
- $57,984
- Equity at exit
- $223
- IRR
- —
- Equity multiple
- 302.16×
- Total profit
- $126,067
- Equity at exit
- $129
Cash invested: $419 (down + closing). Projections, not guarantees.
Landlord ↔ Tenant lean methodology
- Overall (STATE)
- 87 Strongly Landlord-Friendly
- State Tennessee
- 87 Strongly Landlord-Friendly · R+13
- County
- — inherits STATE
- City
- — inherits STATE
ZIP-level market 37620
- Active inventory
- 253
- Price-to-rent
- 0.1×
Monthly cashflow live
- Estimated rent
- $1,563 high interval (Pro) →
- Mortgage (P&I)
- −$8
- Tax est. 1.5%
- −$2 /mo · $22/yr
- Insurance
- −$1
- Flood insurance flood zone
- −$314 /mo · $3,765/yr
- HOA
- −$0
- Vacancy / Maint / Mgmt
- −$328
- Net cashflow
- $911
Break-even live
UW: 25.0% down · 7.5% · 30yr · 1.5% tax · 5.0% vac · 8.0% maint · 8.0% mgmt
Financing live
Cash to close
- Down payment
- $374
- Closing costs
- $45
- Reserves months
- —
- Total cash needed
- —
Loan-product check · same deal, 3 products live
Conventional
25% down · 7.5% · 30yr
- Down + closing
- —
- Monthly P&I
- —
- Monthly cashflow
- —
- DSCR
- —
- Eligible?
- —
Personal DTI + credit; lowest rate.
DSCR
20% down · 8.5% · 30yr
- Down + closing
- —
- Monthly P&I
- —
- Monthly cashflow
- —
- DSCR
- —
- Eligible?
- —
No personal income docs; deal must DSCR.
Hard money
10% down · 12.0% · 12mo
- Down + closing
- —
- Monthly P&I
- —
- Monthly cashflow
- —
- DSCR
- —
- Eligible?
- —
Short-term bridge; refi at stabilization.
Rent comps 6 comps
| Address | Beds | Baths | Sqft | Rent | $/sqft | DOM | Units | Dist |
|---|---|---|---|---|---|---|---|---|
| 2931 Broad St #124 Bristol, TN | 3.0 | 2.5 | 1248 | $1,500 | $1.20 | 20d | 1 | 0.17mi |
| 145 Midway St Unit 1397968P Bristol, VA | 3.0 | 2.0 | 1388 | $5,335 | $3.84 | 20d | 1 | 1.15mi |
| 2114 Broad St Bristol, TN | 2.0 | 1.0 | 1000 | $1,600 | $1.60 | 13d | 1 | 1.15mi |
| 2510 Catherine St Bristol, VA | 3.0 | 2.0 | 1418 | $2,500 | $1.76 | 13d | 1 | 1.33mi |
| 1718 Clifton Rd Bristol, TN | 3.0 | 1.5 | 1672 | $1,900 | $1.14 | 43d | 1 | 1.37mi |
| 1270 Volunteer Pkwy Bristol, TN | 2.0–3.0 | 1.0–2.0 | 1151 | $1,140 | $0.99 | 13d | 1 | 1.49mi |
Listing history 4 events
-
2026-06-19days on market $1,495 Active 3 DOM
-
2026-06-18days on market $1,495 Active 2 DOM
-
2026-06-17remarks 699-char remark
-
2026-06-17$1,495 Active 1 DOM
ⓘ Source: listings_history table (triggers on properties + properties_extension) + one-shot
backfill from property_details.listing_events for pre-trigger history.
Climate risk First Street
- Flood 9/10 Extreme FEMA zone A · 99% chance over 30 yrs
- Wildfire 4/10 Moderate
- Heat 4/10 Moderate 7 d/yr ≥98°F today · 22 d/yr by 30 yrs out
- Wind 2/10 Low
- Air quality 2/10 Low 1 unhealthy d/yr today · 2 by 30 yrs out
Nearby sold comps map
Loading sold comps map…
Walkable amenities ~0.75 mi
Loading nearby amenities…
Taxation est. · year 1
- Rental income
- $18,758
- − Mortgage interest
- −$84
- − Property taxes
- −$22
- − Insurance
- −$3,772
- − Repairs & maintenance
- −$1,501
- − Management
- −$1,501
- − Depreciation
- −$43
- Taxable income
- $11,834
- Est. tax owed @ 24.0%
- −$2,840
- After-tax cash flow
- $8,089/yr
For passive investors: Depreciation is non-cash, so a rental often shows a tax loss while cash-flowing — sheltering income. Rental losses are passive: they offset passive income freely, and up to $25,000/yr can offset ordinary (W-2) income if you actively participate and your MAGI is under $100k (phasing out to $0 by $150k); unused losses carry forward. On sale, claimed depreciation is recaptured at up to 25%, and gains may owe capital-gains tax (a 1031 exchange can defer both). Figures are a year-1 estimate at your 24.0% rate — not tax advice; consult a CPA.
Schools (NCES district)
- District
- Bristol
- NCES district ID
- 4700360
- Math proficiency
- 37% ▼ -7.00%
- Reading proficiency
- 35% ▼ -8.00%
- Median HH income
- $37,018
- Composite
- 29.95/100
- National rank
- #6376
- State rank
- #29 of 139 in TN
Livability — Bristol
- Score
- 73/100
- State rank
- #24
- US rank
- #5413
Category grades
Schools grade is shown separately in the Schools card above.
Census & demographics
- Census place
- Bristol, TN
- County
- Sullivan County · 121,987 people
- City population
- 38,494
- Metro
- Kingsport-Bristol, TN-VA
- Population (ZIP)
- 38,494
- Household income
- $56,128
- Rent vs Own
- Severe rent burden
- 724.0
Population outlook (Sullivan County) Hauer SSP2
- Today (2025)
- 157,030 people
- By 2030
- 156,415 · -0.4%
- By 2040
- 153,778 · -2.1%
- By 2050
- 149,018 · -5.1%
- By 2075
- 138,068 · -12.1%
- By 2100
- 119,927 · -23.6%
Race, ethnicity, and origin ACS 2023
- Neighborhood character
- Predominantly White (91%)
- Race & ethnicity
- White 91% Two or more races 5% Hispanic / Latino 3% Black 2%
- Common ancestry
- Serbian 3% Slovak 3% Italian 1%
- Foreign-born
- 2% · Canada
- Languages at home
- 97% English-only · Spanish 2%
Political lean MEDSL · Sullivan
- 2024 margin
- Solid R (+55.0) · D 22.0% · R 77.0% · Other 1.0%
- 2008→2024 swing
- -13.6pp toward R · 2008: -41.3pp · 2024: -55.0pp
- All cycles
- 2024: R+55.0 2020: R+51.9 2016: R+56.2 2012: R+47.2 2008: R+41.3
Not yet ingested
- Civics
- —
Market trends
- HPI YoY
- ▼ -294.12%
- Current HPI
- 263.38
- Rent YoY
- —
- Metro
- Kingsport-Bristol, TN-VA
- State GDP YoY
- ▲ 2.78%
- F500 in state
- 22
Industry mix (Fortune 500 HQ in TN)
| Industry | F500 HQs | Revenue |
|---|---|---|
| Healthcare | 3 | $91B |
|
||
| Retail | 3 | $72B |
|
||
| Transportation / Logistics | 1 | $88B |
|
||
| Paper / Packaging | 1 | $19B |
|
||
| Insurance | 1 | $13B |
|
||
| Energy | 1 | $12B |
|
||
Price history
1 event — show timeline
- 2026-06-16 Listed $1,495 TVRMLS
Cash-flow waterfall
monthlySold comps — $/sqft
last 12 mo · ≤1 miLoading sold comps…