 🏷️ Likely Rental
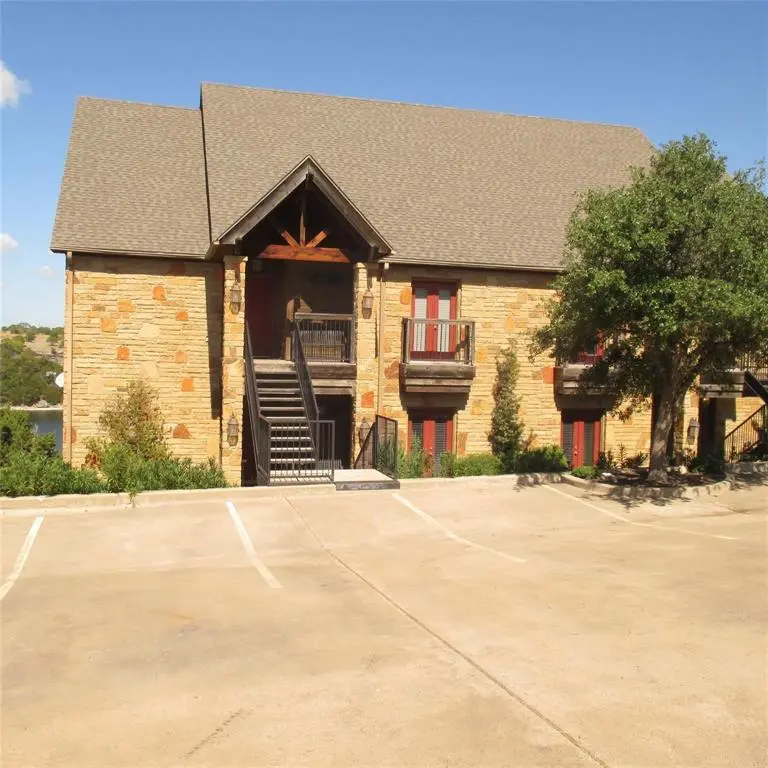
545 Melbourne Trl · Graford, TX
Flood risk 1/10 · Minimal
- FEMA flood zone
- X (unshaded)
- Chance of flooding over 30 yrs
- 0.0%
- Est. flood insurance / yr
- $507 – $1,088
Fire risk 4/10 · Minor
- Est. fire insurance / yr
- $1,222 – $2,270
Heat risk 7/10 · Major
- Hot days now (above 108°F)
- 7 days/yr
- Hot days in 30 yrs
- 20 days/yr
Wind risk 4/10 · Minor
- Chance of severe wind over 30 yrs
- 15.0%
Air-quality risk 1/10 · Minimal
- Unhealthy air days now
- 0 days/yr
- Unhealthy air days in 30 yrs
- 0 days/yr
Risk factors via First Street. Map © Google.
Why this score? — see what drove the D+ grade
The composite is a weighted blend of 9 inputs, each scored 0–100. Each bar is that input's sub-score; the figure is the points it added to the 100-point composite (weight × sub-score).
- Cash flow +15.0/30.0
- ARV discount +7.5/15.0
- Schools +5.6/10.0
- 1% rule +5.0/10.0
- DSCR +5.0/10.0
- Livability +3.2/5.0
- Rent growth +2.5/5.0
- Condition / age +2.5/5.0
- Appreciation +0.0/10.0
$6,000
🖨 Deal sheet 📄 Offer letter ✓ Due diligence
Listing remarks MLS
1 Week of Interval Ownership in the luxury Vista Point Units in The Cliffs Resort on Possum Kingdom Lake directly above The Cliffs Marina. High end finishes throughout. All resort amenities available.
Key facts
- $77 HOA
- Pool
- Built 2003
Neighborhood map
What this means for you Summary
Snapshot
- This is a 2-bed/2.0-bath condo listed at $6k.
Deal economics
- At list price, monthly cash flow is $2k ($24k/yr) — positive.
- The deal already cash-flows at list — no discount required.
- Meets the 1% rule at list price ($3k rent vs $6k).
- Recommended offer: $5k (12.0% below list) — sets the bar for market timing.
- Cap rate 398.1% vs local median 1.3% in Graford — top-decile yield for the area; either an underpriced asset or a hidden risk that comps aren't pricing in. Stress-test before assuming the spread holds.
Location & tenants
- Location reads 63/100 on livability (#856 in TX) — a middle-class / working-renter tenant base. Strengths: cost of living A+, housing A+; Watch: employment C-, health & safety D+, schools D-.
- Palo Pinto ISD (rural): math 60% / reading 70% proficiency, ranked #86 of 1,141 in TX (top 8%) — acceptable for families but not a draw, mixed tenant base, ~2y average lease.
- Market conditions: 465 active listings in the ZIP; 27 units permitted in Palo Pinto County in 2024 (0 in 5+ unit buildings).
Forward outlook
- Local home prices are declining (-3.0%/yr); year-one equity from $41 of loan paydown is wiped out by about $180 of value loss. Plan a longer hold.
- Palo Pinto County population projected to shrink 8% by 2050 — rents likely to lag national; underwrite the cash flow, not the appreciation.
- At projected returns (-3.0% appreciation + 3.0% rent growth), your $2k cash investment doubles in ~1 year — after that, you're playing with house money.
Negotiation context
- It's been on market 519 days — a 12% lower offer ($5k) is reasonable based on typical stale-listing flexibility.
- 3 sale attempts since 4y ago with the ask held roughly flat each time — persistent listings suggest the price (not the market) is what's stuck; bring a comps-based counter.
Risks & watch-outs
- Climate carrying-cost: extreme-heat days projected 7→20/yr by 2055 (HVAC capex compounding) — expect insurance premiums to compound above CPI over the hold.
Questions for the listing agent
- It's been on market 519 days. Have you received any prior offers? Is the seller open to a 12% concession, seller financing, or rate buy-down credit?
- What does the HOA fee cover, when was the last increase, and are there any pending special assessments or reserve-fund shortfalls?
- Any open or pending special assessments — roof, HVAC, plumbing, elevator, façade? What's the per-unit balance and payoff schedule, and is the seller paying it off at close or rolling it to the buyer?
- Why hasn't it sold? Are there any deal-killer items the seller is aware of (foundation, flood, title, zoning, code violations)?
- Is there a deadline driving the sale (1031 exchange, divorce, estate, relocation)? That informs how much negotiation room exists.
- Schools are D-rated, which usually means shorter tenancies and higher turnover. Who's the typical renter profile here, and what's been the actual vacancy rate?
- Crime grade is F in this area — have there been break-ins, vandalism, or insurance claims at this property in the last 3 years? What carrier currently insures it and at what premium?
- The area grade is low — what's the realistic commute time and amenity access for the typical tenant pool here? Any planned neighborhood developments (good or bad) we should know about?
- What's the average days-on-market for RENTAL listings here right now (not sales)? A rising rental-DOM trend means longer vacancies and softer asking-rent achievability than the comps imply.
- What's the recent tenant-quality profile in this submarket — average credit score on applications, eviction rate, late-payment / NSF rate, and stable-employment percentage? A property-management company in the area should have these aggregated.
- How much new apartment / multifamily construction is in the pipeline within 1–3 miles? Heavy new supply (>2% of stock underway) typically softens rents 12–24 months out; light construction supports rent growth.
Investment metrics
- 1% rule
- 43.83% ✓
- Cap rate
- 398.14%
- Cash-on-cash
- 1399.45%
- DSCR
- 63.27
- GRM
- 0.2
CMA / ARV
- ARV (median comp)
- $450,407
- List price
- $6,000
- Delta
- -98.67%
- Verdict
- UNDERPRICED
- Comps
- 19 within 1.0 mi
Projected returns pro-forma
-3.0% appreciation · 3.0% rent growth · sell at horizon
- IRR
- —
- Equity multiple
- 74.75×
- Total profit
- $123,899
- Equity at exit
- $895
- IRR
- —
- Equity multiple
- 161.07×
- Total profit
- $268,922
- Equity at exit
- $519
Cash invested: $1,680 (down + closing). Projections, not guarantees.
Landlord ↔ Tenant lean methodology
- Overall (STATE)
- 87 Strongly Landlord-Friendly
- State Texas
- 87 Strongly Landlord-Friendly · R+5
- County
- — inherits STATE
- City
- — inherits STATE
ZIP-level market 76449
- Home prices YoY
- -27.7%
- Active inventory
- 465
- Price-to-rent
- 0.2×
Monthly cashflow live
- Estimated rent
- $2,630 medium interval (Pro) →
- Mortgage (P&I)
- −$31
- Tax est. 1.5%
- −$8 /mo · $90/yr
- Insurance
- −$2
- HOA
- −$77
- Vacancy / Maint / Mgmt
- −$552
- Net cashflow
- $1,959
Break-even live
UW: 25.0% down · 7.5% · 30yr · 1.5% tax · 5.0% vac · 8.0% maint · 8.0% mgmt
Financing live
Cash to close
- Down payment
- $1,500
- Closing costs
- $180
- Reserves months
- —
- Total cash needed
- —
Loan-product check · same deal, 3 products live
Conventional
25% down · 7.5% · 30yr
- Down + closing
- —
- Monthly P&I
- —
- Monthly cashflow
- —
- DSCR
- —
- Eligible?
- —
Personal DTI + credit; lowest rate.
DSCR
20% down · 8.5% · 30yr
- Down + closing
- —
- Monthly P&I
- —
- Monthly cashflow
- —
- DSCR
- —
- Eligible?
- —
No personal income docs; deal must DSCR.
Hard money
10% down · 12.0% · 12mo
- Down + closing
- —
- Monthly P&I
- —
- Monthly cashflow
- —
- DSCR
- —
- Eligible?
- —
Short-term bridge; refi at stabilization.
HOA detail condo
- Monthly dues
- $77 · $924/yr
- Assessments
- None detected in remarks — confirm with the listing agent.
Listing history 21 events
-
2026-06-19days on market $6,000 Active 519 DOM
-
2026-06-18days on market $6,000 Active 518 DOM
-
2026-06-17days on market $6,000 Active 517 DOM
-
2026-06-16days on market $6,000 Active 516 DOM
-
2026-06-15days on market $6,000 Active 515 DOM
-
2026-06-14days on market $6,000 Active 513 DOM
-
2026-06-12days on market $6,000 Active 512 DOM
-
2026-06-09days on market $6,000 Active 509 DOM
-
2026-06-08days on market $6,000 Active 508 DOM
-
2026-06-07days on market $6,000 Active 507 DOM
-
2026-06-07days on market $6,000 Active 506 DOM
-
2026-06-04days on market $6,000 Active 503 DOM
-
2026-06-02days on market $6,000 Active 502 DOM
-
2026-06-01days on market $6,000 Active 501 DOM
-
2026-05-31days on market $6,000 Active 500 DOM
-
2026-05-31days on market $6,000 Active 499 DOM
-
2025-01-16$6,000 Active 202-char remark
Show marketing remark (202 chars)
1 Week of Interval Ownership in the luxury Vista Point Units in The Cliffs Resort on Possum Kingdom Lake directly above The Cliffs Marina. High end finishes throughout. All resort amenities available.
-
2025-01-01historical
-
2024-07-03$6,000 Active
-
2022-12-14soldstatus Closed
-
2022-09-17$10,000 Active
ⓘ Source: listings_history table (triggers on properties + properties_extension) + one-shot
backfill from property_details.listing_events for pre-trigger history.
Climate risk First Street
- Flood 1/10 Low FEMA zone X (unshaded) · 0% chance over 30 yrs
- Wildfire 4/10 Moderate
- Heat 7/10 Severe 7 d/yr ≥108°F today · 20 d/yr by 30 yrs out
- Wind 4/10 Moderate 15% chance of damaging wind over 30 yrs
- Air quality 1/10 Low 0 unhealthy d/yr today · 0 by 30 yrs out
Nearby sold comps map
Loading sold comps map…
Walkable amenities ~0.75 mi
Loading nearby amenities…
Taxation est. · year 1
- Rental income
- $31,560
- − Mortgage interest
- −$336
- − Property taxes
- −$90
- − Insurance
- −$30
- − Repairs & maintenance
- −$2,525
- − Management
- −$2,525
- − HOA
- −$924
- − Depreciation
- −$175
- Taxable income
- $24,956
- Est. tax owed @ 24.0%
- −$5,989
- After-tax cash flow
- $17,521/yr
For passive investors: Depreciation is non-cash, so a rental often shows a tax loss while cash-flowing — sheltering income. Rental losses are passive: they offset passive income freely, and up to $25,000/yr can offset ordinary (W-2) income if you actively participate and your MAGI is under $100k (phasing out to $0 by $150k); unused losses carry forward. On sale, claimed depreciation is recaptured at up to 25%, and gains may owe capital-gains tax (a 1031 exchange can defer both). Figures are a year-1 estimate at your 24.0% rate — not tax advice; consult a CPA.
Schools (NCES district)
- District
- Palo Pinto ISD
- NCES district ID
- 4834140
- Math proficiency
- 60% ▲ 10.00%
- Reading proficiency
- 70% ▲ 20.00%
- Median HH income
- $46,807
- Composite
- 56.3/100
- National rank
- #2499
- State rank
- #86 of 1141 in TX
Livability — Graford
- Score
- 63/100
- State rank
- #856
- US rank
- #15394
Category grades
Schools grade is shown separately in the Schools card above.
Census & demographics
- Population (ZIP)
- 2,157
Population outlook (Palo Pinto County) Hauer SSP2
- Today (2025)
- 27,500 people
- By 2030
- 27,079 · -1.5%
- By 2040
- 26,135 · -5.0%
- By 2050
- 25,215 · -8.3%
- By 2075
- 23,416 · -14.9%
- By 2100
- 20,300 · -26.2%
Race, ethnicity, and origin ACS 2023
- Neighborhood character
- Predominantly White (90%)
- Race & ethnicity
- White 90% Hispanic / Latino 7% Two or more races 4%
- Hispanic origin (detail)
- Mexican 5%
- Common ancestry
- Portuguese 1% Italian 1% Serbian 1%
- Foreign-born
- 2% · Canada
- Languages at home
- 95% English-only · Spanish 4%
Political lean MEDSL · Palo Pinto
- 2024 margin
- Solid R (+67.1) · D 16.1% · R 83.2%
- 2008→2024 swing
- -18.9pp toward R · 2008: -48.2pp · 2024: -67.1pp
- All cycles
- 2024: R+67.1 2020: R+64.1 2016: R+64.1 2012: R+59.8 2008: R+48.2
Not yet ingested
- Civics
- —
Market trends
- HPI YoY
- ▼ -92.53%
- Current HPI
- 241.6435
- Rent YoY
- —
- Metro
- —
- State GDP YoY
- ▲ 3.95%
- F500 in state
- 110
Industry mix (Fortune 500 HQ in TX)
| Industry | F500 HQs | Revenue |
|---|---|---|
| Energy | 16 | $1,198B |
|
||
| Technology | 5 | $198B |
|
||
| Engineering / Construction | 4 | $72B |
|
||
| Energy Services | 3 | $60B |
|
||
| Utilities | 3 | $41B |
|
||
| Healthcare | 2 | $330B |
|
||
Price history
-40.0% since first listed5 events — show timeline
- 2025-01-16 Listed $6,000 NTREIS
- 2025-01-01 Listing Removed — NTREIS
- 2024-07-03 Listed $6,000 NTREIS
- 2022-12-14 Sold (MLS) — NTREIS
- 2022-09-17 Listed $10,000 NTREIS
Property tax history
+0.6%/yrLatest (2025): $13,590 · -1.8% YoY. Source: county tax records.
Cash-flow waterfall
monthlySold comps — $/sqft
last 12 mo · ≤1 miLoading sold comps…