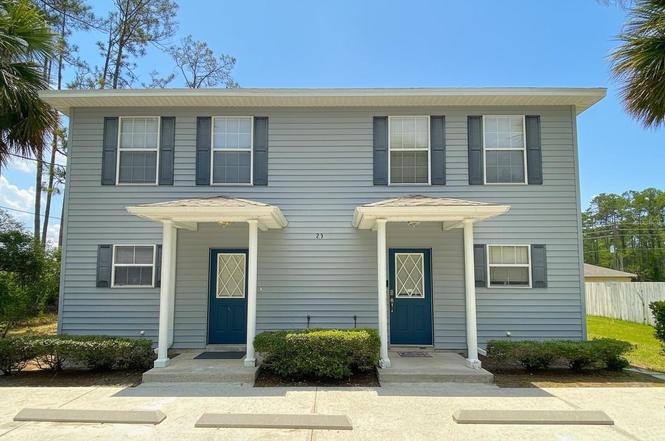
 Duplex
23 Regent Ln Unit A&B · Palm Coast, FL
Flood risk 1/10 · Minimal
- FEMA flood zone
- X (unshaded)
- Chance of flooding over 30 yrs
- 0.0%
- Est. flood insurance / yr
- $507 – $1,088
Fire risk 4/10 · Minor
- Est. fire insurance / yr
- $947 – $1,759
Heat risk 9/10 · Severe
- Hot days now (above 107°F)
- 7 days/yr
- Hot days in 30 yrs
- 20 days/yr
Wind risk 10/10 · Severe
- Chance of severe wind over 30 yrs
- 99.0%
Air-quality risk 3/10 · Minor
- Unhealthy air days now
- 3 days/yr
- Unhealthy air days in 30 yrs
- 3 days/yr
Risk factors via First Street. Map © Google.
Why this score? — see what drove the D+ grade
The composite is a weighted blend of 9 inputs, each scored 0–100. Each bar is that input's sub-score; the figure is the points it added to the 100-point composite (weight × sub-score).
- ARV discount +15.0/15.0
- Cash flow +12.8/30.0
- Schools +4.6/10.0
- DSCR +3.8/10.0
- 1% rule +3.6/10.0
- Livability +3.5/5.0
- Rent growth +2.8/5.0
- Condition / age +2.5/5.0
- Appreciation +0.0/10.0
$399,000
🖨 Deal sheet (PDF) 📄 Offer letter ✓ Due diligence
Multi-family units
County records classify this as Multi-Family (2-4 Unit). Listing-text estimate: 2 units. confirmed
Listing remarks MLS
Great Investment Opportunity! 4-bedroom, 4-bathroom duplex in a great Palm Coast neighborhood, near Rymfire Elementary School. This Duplex has Immediate Income and Owner-Occupant potential with no CDD or HOA Fees. New Roof installed in 2024. Both units are well maintained with new flooring and identical in size and layout. The functional, open floor-plan, offers a nice flow from the kitchen to the dining room to the living room with sliding glass doors opening to a large, private backyard and patio. Great Location: close to I95, Schools, Flagler Beach, Restaurants, and Shopping.
Key facts
- Close to schools
- Close to i95
- Private backyard
Tags
Property features AI
Finance
- Other: Zoned DPX
- Financial info: Annual net income reported for the multi-family property: 26,400
- HOA & community: No homeowners association; Located in the Lehigh Woods development
Exterior
- Utilities: Public water; Public sewer; Water connected; Sewer connected; Cable available
- Home design: Residential income property; Duplex
- Construction: Frame construction; Shingle roof; Block foundation; Built across two buildings totaling 2,996 building area units
- Exterior features: Paved road access; Property located on a 0.23-acre lot; Two total buildings on the property
Interior
- Flooring: Carpet; Tile
- Heating & cooling: Central heating; Central air conditioning
- Interior features: Other interior features
- Laundry & utility: Laundry inside
Neighborhood map
What this means for you Summary
Snapshot
- This is a 2 × 2-bed/2.0-bath units multifamily listed at $399k.
Deal economics
- At list price, monthly cash flow is $-35 ($-421/yr) — negative. Per door: $-18/mo.
- To cash-flow at today's rent, offer at most $394k (1.3% below list).
- To meet the 1% rule (rent ≥ 1% of price), the offer needs to be $345k (13.6% below list).
- Recommended offer: $345k (13.6% below list) — sets the bar for 1% rule.
- Cap rate 6.2% vs local median 3.8% in Palm Coast — top-decile yield for the area; either an underpriced asset or a hidden risk that comps aren't pricing in. Stress-test before assuming the spread holds.
Location & tenants
- Location reads 69/100 on livability (#478 in FL) — a middle-class / working-renter tenant base. Strengths: housing A+, health & safety A+, cost of living B+; Watch: amenities F, commute F.
- Flagler (rural): math 53% / reading 56% proficiency, ranked #20 of 73 in FL (top 27%) — acceptable for families but not a draw, mixed tenant base, ~2y average lease.
- Zoned schools: Rymfire Elementary School (math 55% / reading 55%, grade C, #872 of 2,144 statewide, top 42%, 892 students, 67% FRL); Buddy Taylor Middle School (math 50% / reading 45%, grade C-, #288 of 571 statewide, top 51%, 1,343 students, 63% FRL); Flagler-Palm Coast High School (math 36% / reading 51%, grade F, #248 of 667 statewide, top 38%, 2,523 students, 52% FRL).
- Market conditions: Rents rising (+1.2%/yr); 1380 active listings in the ZIP; 4 comparable units currently listed for rent nearby; rentals leasing fast (median 13d on market — plan ~1-2 weeks tenant-placement turnaround); solid renter incomes; 2,588 units permitted in Flagler County in 2024 (0 in 5+ unit buildings).
- At $3,446/mo this rent would consume 54% of the median local household income ($76k/yr) (locally 1291% of renters already pay >50% of income on rent) — very limited rent-growth headroom before tenants either downsize or default.
Forward outlook
- Local home prices are declining (-3.0%/yr); year-one equity from $3k of loan paydown is wiped out by about $12k of value loss. Plan a longer hold.
- Flagler County population projected at +28% by 2050 — long-run rental-demand tailwind backs the buy-and-hold thesis.
Negotiation context
- It's been on market 20 days — a 2% lower offer ($393k) is reasonable based on typical stale-listing flexibility.
- 8 sale attempts; this cycle's ask is 6% above the opening price — seller raised mid-cycle; expect resistance to lowballs.
Risks & watch-outs
- Climate carrying-cost: severe wind risk, 99% chance of damaging wind over 30y; extreme-heat days projected 7→20/yr by 2055 (HVAC capex compounding) — expect insurance premiums to compound above CPI over the hold.
Questions for the listing agent
- What do current leases actually rent for vs. the listed asking? Can we see a recent rent roll and the last 12 months of T-12 income?
- Can we see the unit-by-unit rent roll, current vacancy, and any below-market leases? What's the average tenancy length?
- What capital expenditures (roof, boiler, parking lot, exteriors) have been made in the last 5 years, and what's planned in the next 2?
- Is there a deadline driving the sale (1031 exchange, divorce, estate, relocation)? That informs how much negotiation room exists.
- The area grade is low — what's the realistic commute time and amenity access for the typical tenant pool here? Any planned neighborhood developments (good or bad) we should know about?
- What's the average days-on-market for RENTAL listings here right now (not sales)? A rising rental-DOM trend means longer vacancies and softer asking-rent achievability than the comps imply.
- What's the recent tenant-quality profile in this submarket — average credit score on applications, eviction rate, late-payment / NSF rate, and stable-employment percentage? A property-management company in the area should have these aggregated.
- How much new apartment / multifamily construction is in the pipeline within 1–3 miles? Heavy new supply (>2% of stock underway) typically softens rents 12–24 months out; light construction supports rent growth.
Investment metrics
- 1% rule
- 0.86% ✗
- Cap rate
- 6.19%
- Cash-on-cash
- -0.38%
- DSCR
- 0.98
- GRM
- 9.6
CMA / ARV
- ARV (on-the-fly)
- $522,776
- Comps found
- 10
Show comp detail 10 sales within ~0.75 mi
| Address | Dist | Beds/Ba | Sqft | Sold | Price | $/sf | Match |
|---|---|---|---|---|---|---|---|
| 14 Regent Ln Unit A & B | 0.08mi | 6/4.0 | 2,483 (-4%) | 0mo | $415,000 | $167 | 90 |
| 18 Regina Ln Unit A & B | 0.15mi | 6/4.0 | 2,483 (-4%) | 0mo | $425,000 | $171 | 86 |
| 70 Red Mill Dr Unit A-B | 0.14mi | 6/4.0 | 2,541 (-2%) | 7mo | $385,000 | $152 | 85 |
| 4 Regent Ln | 0.15mi | —/— | 2,541 (-2%) | 12mo | $480,000 | $189 | 80 |
| 39 Regent Ln | 0.13mi | 6/4.0 | 2,376 (-8%) | 4mo | $530,000 | $223 | 77 |
| 12 Regina Ln | 0.17mi | 6/4.0 | 2,620 (+1%) | 18mo | $473,500 | $181 | 75 |
| 44 Regency Dr | 0.22mi | 6/4.0 | 2,374 (-8%) | 2mo | $480,000 | $202 | 74 |
| 13 Regina Ln | 0.13mi | —/— | 2,377 (-8%) | 12mo | $500,000 | $210 | 70 |
| 15 Regina Ln | 0.12mi | 12/8.0 | 2,377 (-8%) | 18mo | $520,000 | $219 | 66 |
| 44 Regency Dr Unit A,B | 0.22mi | 6/4.0 | 2,377 (-8%) | 24mo | $543,000 | $228 | 56 |
Match score weights: distance 35% · size 25% · config 20% · recency 20%. Top-matched comps best support the ARV.
Projected returns pro-forma
-3.0% appreciation · 1.18% rent growth · sell at horizon
- IRR
- -19.0%
- Equity multiple
- 0.35×
- Total profit
- $-73,034
- Equity at exit
- $59,492
- IRR
- -15.7%
- Equity multiple
- 0.19×
- Total profit
- $-90,782
- Equity at exit
- $34,498
Cash invested: $111,720 (down + closing). Projections, not guarantees.
Landlord ↔ Tenant lean methodology
- Overall (STATE)
- 87 Strongly Landlord-Friendly
- State Florida
- 87 Strongly Landlord-Friendly · R+3
- County
- — inherits STATE
- City
- — inherits STATE
ZIP-level market 32164
- Home prices YoY
- -6.3%
- Rents YoY
- 1.2%
- Active inventory
- 1380
- Price-to-rent
- 19.3×
Monthly cashflow live
- Estimated rent
- $3,446 high interval (Pro) →
- Mortgage (P&I)
- −$2,092
- Tax est. 1.5%
- −$499 /mo · $5,985/yr
- Insurance
- −$166
- HOA
- −$0
- Vacancy / Maint / Mgmt
- −$724
- Net cashflow
- $-35
Break-even live
Sensitivity live
| Price | -10% $241 | -5% $103 | +0% $-35 | +5% $-173 | +10% $-311 |
|---|---|---|---|---|---|
| Rent | -10% $-307 | -5% $-171 | +0% $-35 | +5% $101 | +10% $237 |
| Rate | -1.0pp $166 | -0.5pp $66 | base $-35 | +0.5pp $-138 | +1.0pp $-244 |
2-unit breakdown (identical units grouped — click to expand)
| Units | Beds | Baths | Est. rent |
|---|---|---|---|
| 2× units | 2 | 2 | $3,446 |
| #1 | 2 | 2 | $1,723 |
| #2 | 2 | 2 | $1,723 |
| Total (2 units) | $3,446 | ||
UW: 25.0% down · 7.5% · 30yr · 1.5% tax · 5.0% vac · 8.0% maint · 8.0% mgmt
Financing live
Cash to close
- Down payment
- $99,750
- Closing costs
- $11,970
- Reserves months
- —
- Total cash needed
- —
Loan-product check · same deal, 3 products live
Conventional
25% down · 7.5% · 30yr
- Down + closing
- —
- Monthly P&I
- —
- Monthly cashflow
- —
- DSCR
- —
- Eligible?
- —
Personal DTI + credit; lowest rate.
DSCR
20% down · 8.5% · 30yr
- Down + closing
- —
- Monthly P&I
- —
- Monthly cashflow
- —
- DSCR
- —
- Eligible?
- —
No personal income docs; deal must DSCR.
Hard money
10% down · 12.0% · 12mo
- Down + closing
- —
- Monthly P&I
- —
- Monthly cashflow
- —
- DSCR
- —
- Eligible?
- —
Short-term bridge; refi at stabilization.
Rent comps 4 comps
| Address | Beds | Baths | Sqft | Rent | $/sqft | DOM | Units | Dist |
|---|---|---|---|---|---|---|---|---|
| 36 Reidsville Dr Palm Coast, FL | 3.0 | 2.0 | 1994 | $2,150 | $1.08 | 13d | 1 | 0.36mi |
| 4 Ritchie Pl Palm Coast, FL | 3.0 | 2.0 | 1970 | $2,216 | $1.12 | 4d | 1 | 0.60mi |
| 9 Riddle Pl Palm Coast, FL | 3.0 | 2.0 | 1833 | $1,769 | $0.97 | 4d | 1 | 0.83mi |
| 33 Rybark Ln Palm Coast, FL | 3.0 | 2.0 | 1980 | $1,850 | $0.93 | 25d | 1 | 1.35mi |
Listing history 11 events
-
2026-06-21days on market $399,000 Active 20 DOM
-
2026-06-18days on market $399,000 Active 17 DOM
-
2026-06-17days on market $399,000 Active 16 DOM
-
2026-06-16days on market $399,000 Active 15 DOM
-
2026-06-15days on market $399,000 Active 14 DOM
-
2026-06-14days on market $399,000 Active 12 DOM
-
2026-06-13days on market $399,000 Active 11 DOM
-
2026-06-10days on market $399,000 Active 9 DOM
-
2026-06-09days on market $399,000 Active 8 DOM
-
2026-06-09remarks 699-char remark
-
2026-06-09$399,000 Active 7 DOM
ⓘ Source: listings_history table (triggers on properties + properties_extension) + one-shot
backfill from property_details.listing_events for pre-trigger history.
Climate risk First Street
- Flood 1/10 Low FEMA zone X (unshaded) · 0% chance over 30 yrs
- Wildfire 4/10 Moderate
- Heat 9/10 Extreme 7 d/yr ≥107°F today · 20 d/yr by 30 yrs out
- Wind 10/10 Extreme 99% chance of damaging wind over 30 yrs
- Air quality 3/10 Moderate 3 unhealthy d/yr today · 3 by 30 yrs out
Nearby sold comps map
Loading sold comps map…
Walkable amenities ~0.75 mi
Loading nearby amenities…
Taxation est. · year 1
- Rental income
- $41,352
- − Mortgage interest
- −$22,350
- − Property taxes
- −$5,985
- − Insurance
- −$1,995
- − Repairs & maintenance
- −$3,308
- − Management
- −$3,308
- − Depreciation
- −$11,607
- Taxable loss
- −$7,202
- Est. tax savings @ 24.0%
- +$1,728
- After-tax cash flow
- $1,308/yr
For passive investors: Depreciation is non-cash, so a rental often shows a tax loss while cash-flowing — sheltering income. Rental losses are passive: they offset passive income freely, and up to $25,000/yr can offset ordinary (W-2) income if you actively participate and your MAGI is under $100k (phasing out to $0 by $150k); unused losses carry forward. On sale, claimed depreciation is recaptured at up to 25%, and gains may owe capital-gains tax (a 1031 exchange can defer both). Figures are a year-1 estimate at your 24.0% rate — not tax advice; consult a CPA.
Schools (NCES district)
- District
- Flagler
- NCES district ID
- 1200540
- Math proficiency
- 53% ▼ -9.00%
- Reading proficiency
- 56% ▼ -4.00%
- Median HH income
- $48,354
- Composite
- 46.35/100
- National rank
- #2464
- State rank
- #20 of 73 in FL
Livability — Palm Coast
- Score
- 69/100
- State rank
- #478
- US rank
- #8721
Category grades
Schools grade is shown separately in the Schools card above.
Census & demographics
- Census place
- Palm Coast, FL
- County
- Flagler County · 113,412 people
- City population
- 105,049
- Metro
- Deltona-Daytona Beach-Ormond Beach, FL
- Population (ZIP)
- 56,658
- Household income
- $76,399
- Rent vs Own
- Severe rent burden
- 1291.0
Population outlook (Flagler County) Hauer SSP2
- Today (2025)
- 123,474 people
- By 2030
- 131,864 · +6.8%
- By 2040
- 146,176 · +18.4%
- By 2050
- 157,398 · +27.5%
- By 2075
- 177,990 · +44.2%
- By 2100
- 183,381 · +48.5%
Race, ethnicity, and origin ACS 2023
- Neighborhood character
- Predominantly White (65%)
- Race & ethnicity
- White 65% Hispanic / Latino 14% Black 13% Two or more races 8% Asian 2%
- Hispanic origin (detail)
- Mexican 4% Puerto Rican 4% Cuban 2%
- Common ancestry
- Romanian 3% Russian 2% Slovak 2%
- Foreign-born
- 16% · Canada, Jamaica
- Languages at home
- 81% English-only · Spanish 9% Russian/Polish/Slavic 3% Other Indo-European 3%
Political lean MEDSL · Flagler
- 2024 margin
- Strong R (+28.2) · D 35.6% · R 63.8%
- 2008→2024 swing
- -29.8pp toward R · 2008: 1.6pp · 2024: -28.2pp
- All cycles
- 2024: R+28.2 2020: R+20.8 2016: R+20.6 2012: R+7.4 2008: D+1.6
Not yet ingested
- Civics
- —
Market trends
- HPI YoY
- ▼ -19.89%
- Current HPI
- 297.4942
- Rent YoY
- ▲ 1.18%
- Metro
- Deltona-Daytona Beach-Ormond Beach, FL
- State GDP YoY
- ▲ 3.28%
- F500 in state
- 36
Industry mix (Fortune 500 HQ in FL)
| Industry | F500 HQs | Revenue |
|---|---|---|
| Industrial Technology | 2 | $29B |
|
||
| Insurance | 2 | $17B |
|
||
| Retail | 1 | $60B |
|
||
| Technology Distribution | 1 | $58B |
|
||
| Homebuilding | 1 | $35B |
|
||
| Technology Manufacturing | 1 | $35B |
|
||
Price history
+3.6% since first listed15 events — show timeline
- 2026-06-08 Relisted — Stellar MLS as Distributed by MLS Grid
- 2026-06-08 Price Changed $399,000 Stellar MLS as Distributed by MLS Grid
- 2026-06-08 Relisted — Daytona MLS
- 2026-06-08 Price Changed $399,000 Daytona MLS
- 2026-02-23 Relisted — Daytona MLS
- 2026-02-23 Relisted — Stellar MLS as Distributed by MLS Grid
- 2026-02-23 Listing Removed — Daytona MLS
- 2026-02-17 Pending — Stellar MLS as Distributed by MLS Grid
- 2026-02-16 Contingent — Daytona MLS
- 2026-02-11 Listed $375,000 Stellar MLS as Distributed by MLS Grid
- 2026-02-10 Listed $375,000 Daytona MLS
- 2025-11-10 Listing Removed — Stellar MLS as Distributed by MLS Grid
- 2025-11-10 Listing Removed — Daytona MLS
- 2025-05-10 Listed $385,000 Stellar MLS as Distributed by MLS Grid
- 2025-05-10 Listed $385,000 Daytona MLS
Cash-flow waterfall
monthlySold comps — $/sqft
last 12 mo · ≤1 miLoading sold comps…