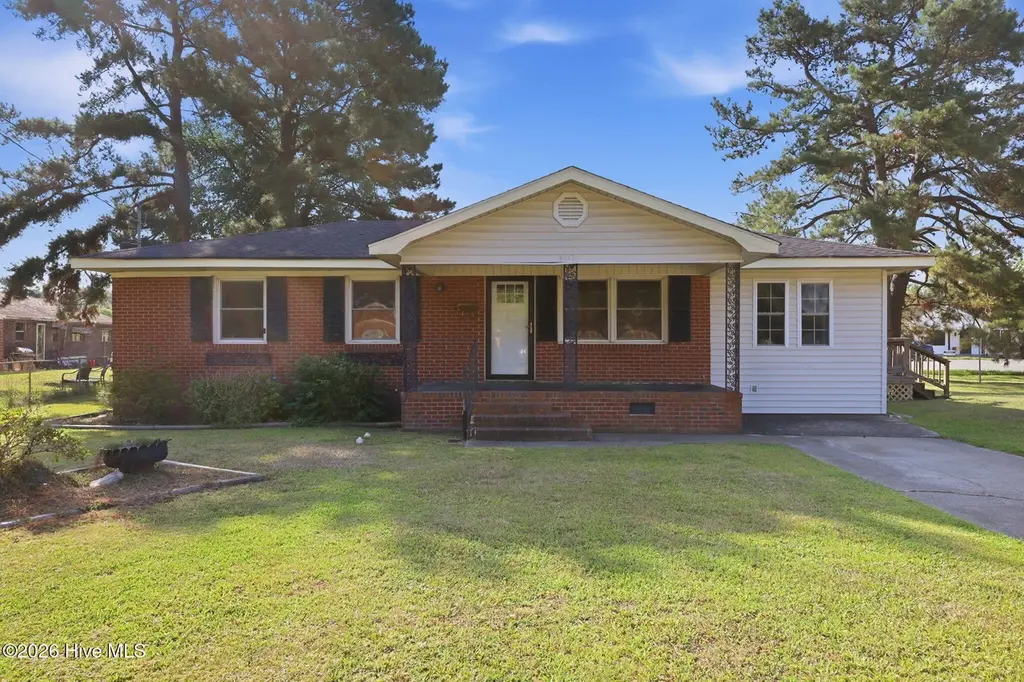
4415 Reaves Rd · Ayden, NC
Flood risk 1/10 · Minimal
- FEMA flood zone
- X (unshaded)
- Chance of flooding over 30 yrs
- 0.0%
- Est. flood insurance / yr
- $507 – $1,088
Fire risk 2/10 · Minimal
- Est. fire insurance / yr
- $906 – $1,684
Heat risk 8/10 · Major
- Hot days now (above 107°F)
- 7 days/yr
- Hot days in 30 yrs
- 17 days/yr
Wind risk 8/10 · Major
- Chance of severe wind over 30 yrs
- 80.0%
Air-quality risk 3/10 · Minor
- Unhealthy air days now
- 3 days/yr
- Unhealthy air days in 30 yrs
- 3 days/yr
Risk factors via First Street. Map © Google.
Why this score? — see what drove the B grade
The composite is a weighted blend of 9 inputs, each scored 0–100. Each bar is that input's sub-score; the figure is the points it added to the 100-point composite (weight × sub-score).
- Cash flow +27.8/30.0
- ARV discount +15.0/15.0
- DSCR +9.8/10.0
- 1% rule +6.9/10.0
- Livability +3.8/5.0
- Schools +3.6/10.0
- Rent growth +2.5/5.0
- Condition / age +2.5/5.0
- Appreciation +0.0/10.0
$119,000
🖨 Deal sheet (PDF) 📄 Offer letter ✓ Due diligence
Listing remarks
Opportunity is knocking! This 3-bedroom, 1-bath home sits on a spacious 0.27-acre lot and is full of potential for an owner-occupant, investor, or anyone looking to add their personal touch. Featuring two separate living areas, there's plenty of space to create the layout that fits your lifestyle. Relax on the welcoming front porch and enjoy the possibilities this property has to offer. With great bones, a HVAC system manufactured in 2020, and a small outbuilding for additional storage, much of the groundwork is already in place. Bring your vision and transform this home into something truly special. Don't miss the chance to make it your own!
Key facts
- Spacious lot
- 0.27 acre lot
- Built 1968
Tags
Property features AI
Finance
- Other: Zoning: R8; Lot dimensions: 79.9 x 29.8 x 108.7 x 102.9 x 108.7; Lot area: 0.27 acres
Exterior
- Parking: Concrete parking surface
- Utilities: Public water; Public sewer; Sewer and water connected; Electric service
- Home design: Single family residence; One story; Entry level: 1
- Construction: Brick and vinyl siding; Shingle roof; Construction details: see remarks
- Exterior features: Deck; Front porch; Outbuilding; Paved road access; Has view; No fencing
Interior
- Kitchen: Electric oven; Electric range; Refrigerator
- Bedrooms: 6 total rooms (bedrooms included in room count)
- Flooring: Carpet; Vinyl
- Bathrooms: 1 full bathroom
- Heating & cooling: Propane heating; Electric heating; Central air conditioning
- Interior features: Ceiling fan(s); Crawl space basement
- Laundry & utility: Washer hookup; Electric water heater
Neighborhood map
What this means for you Summary
Snapshot
- This is a 3-bed/1.0-bath single-family listed at $119k.
Deal economics
- At list price, monthly cash flow is $364 ($4k/yr) — positive.
- The deal already cash-flows at list — no discount required.
- Meets the 1% rule at list price ($1k rent vs $119k).
- Cap rate 10.0% vs local median 2.8% in Ayden — top-decile yield for the area; either an underpriced asset or a hidden risk that comps aren't pricing in. Stress-test before assuming the spread holds.
Location & tenants
- Location reads 76/100 on livability (#41 in NC, #3,656 nationally) — a middle-class / working-renter tenant base. Strengths: cost of living A+, housing A+, health & safety A+; Watch: amenities D+, employment D, commute F.
- Pitt County Schools (rural): math 41% / reading 44% proficiency, ranked #100 of 178 in NC (top 56%) — families likely to look elsewhere, expect single-tenant / working-renter base with shorter leases.
- Zoned schools: Ayden Elementary (math 30% / reading 34%, grade F, #908 of 1,410 statewide, top 67%, 638 students, 100% FRL); Ayden Middle (math 34% / reading 39%, grade F, #270 of 475 statewide, top 57%, 388 students, 99% FRL); Ayden-Grifton High (math 32% / reading 42%, grade F, #414 of 535 statewide, top 79%, 659 students, 99% FRL) — zoned schools average 99% FRL vs 56% district-wide (43 pts higher); higher-poverty schools than district average — tighter screening recommended.
- Market conditions: 156 active listings in the ZIP; 2 comparable units currently listed for rent nearby; 1,300 units permitted in Pitt County in 2024 (204 in 5+ unit buildings).
Forward outlook
- Local home prices are declining (-3.0%/yr); year-one equity from $823 of loan paydown is wiped out by about $4k of value loss. Plan a longer hold.
- Pitt County population projected at +22% by 2050 — long-run rental-demand tailwind backs the buy-and-hold thesis.
- At projected returns (-3.0% appreciation + 3.0% rent growth), your $33k cash investment doubles in ~9 years — after that, you're playing with house money.
Negotiation context
- Only 10 days on market — expect competitive offers; lowballing is unlikely to land.
- Current owner paid $75k; list at $119k implies a 59% gain — meaningful room to come down on a strong offer.
Risks & watch-outs
- Climate carrying-cost: severe wind risk, 80% chance of damaging wind over 30y; extreme-heat days projected 7→17/yr by 2055 (HVAC capex compounding) — expect insurance premiums to compound above CPI over the hold.
Questions for the listing agent
- Built in 1968 — when were the roof, HVAC, electrical panel, plumbing, and water heater last replaced?
- Is there a deadline driving the sale (1031 exchange, divorce, estate, relocation)? That informs how much negotiation room exists.
- Schools are F-rated, which usually means shorter tenancies and higher turnover. Who's the typical renter profile here, and what's been the actual vacancy rate?
- What's the average days-on-market for RENTAL listings here right now (not sales)? A rising rental-DOM trend means longer vacancies and softer asking-rent achievability than the comps imply.
- What's the recent tenant-quality profile in this submarket — average credit score on applications, eviction rate, late-payment / NSF rate, and stable-employment percentage? A property-management company in the area should have these aggregated.
- How much new for-sale + rental construction is in the pipeline within 1–3 miles? Heavy new supply typically softens prices + rents 12–24 months out; constrained supply supports both.
Investment metrics
- 1% rule
- 1.19% ✓
- Cap rate
- 9.96%
- Cash-on-cash
- 13.11%
- DSCR
- 1.58
- GRM
- 7.0
CMA / ARV
- ARV (on-the-fly)
- $157,740
- Comps found
- 9
Show comp detail 9 sales within ~0.75 mi
| Address | Dist | Beds/Ba | Sqft | Sold | Price | $/sf | Match |
|---|---|---|---|---|---|---|---|
| 361 Snow Hill St | 0.43mi | 3/1.0 | 1,175 (-2%) | 7mo | $115,000 | $98 | 71 |
| 4442 Queen St | 0.14mi | 3/1.5 | 1,094 (-8%) | 14mo | $144,000 | $132 | 66 |
| 4237 Washington St | 0.48mi | 3/1.5 | 1,264 (+6%) | 11mo | $185,000 | $146 | 57 |
| 4194 West Ave | 0.51mi | 3/1.0 | 1,164 (-3%) | 19mo | $141,500 | $122 | 56 |
| 4164 High St | 0.47mi | 3/1.5 | 1,132 (-5%) | 15mo | $140,000 | $124 | 55 |
| 4417 Juanita Ave | 0.62mi | 3/1.0 | 1,120 (-6%) | 7mo | $160,000 | $143 | 54 |
| 588 Second St | 0.72mi | 2/1.0 (-1) | 1,236 (+3%) | 7mo | $123,500 | $100 | 50 |
| 384 Snow Hill St | 0.41mi | 2/1.0 (-1) | 1,325 (+11%) | 14mo | $177,500 | $134 | 46 |
| 213 Eighth St | 0.58mi | 3/1.0 | 1,322 (+11%) | 14mo | $175,000 | $132 | 43 |
Match score weights: distance 35% · size 25% · config 20% · recency 20%. Top-matched comps best support the ARV.
Projected returns pro-forma
-3.0% appreciation · 3.0% rent growth · sell at horizon
- IRR
- 3.0%
- Equity multiple
- 1.12×
- Total profit
- $3,885
- Equity at exit
- $17,743
- IRR
- 12.6%
- Equity multiple
- 2.00×
- Total profit
- $33,165
- Equity at exit
- $10,289
Cash invested: $33,320 (down + closing). Projections, not guarantees.
Landlord ↔ Tenant lean methodology
- Overall (STATE)
- 85 Strongly Landlord-Friendly
- State North Carolina
- 85 Strongly Landlord-Friendly · R+3
- County
- — inherits STATE
- City
- — inherits STATE
ZIP-level market 28513
- Home prices YoY
- -8.8%
- Active inventory
- 156
- Price-to-rent
- 7.0×
Monthly cashflow live
- Estimated rent
- $1,420 medium interval (Pro) →
- Mortgage (P&I)
- −$624
- Tax from tax record
- −$84 /mo · $1,007/yr
- Insurance
- −$50
- HOA
- −$0
- Lot rent
- −$0
- Vacancy / Maint / Mgmt
- −$298
- Net cashflow
- $364
Break-even live
Sensitivity live
| Price | -10% $431 | -5% $398 | +0% $364 | +5% $330 | +10% $297 |
|---|---|---|---|---|---|
| Rent | -10% $252 | -5% $308 | +0% $364 | +5% $420 | +10% $476 |
| Rate | -1.0pp $424 | -0.5pp $394 | base $364 | +0.5pp $333 | +1.0pp $302 |
UW: 25.0% down · 7.5% · 30yr · 1.5% tax · 5.0% vac · 8.0% maint · 8.0% mgmt
Financing live
Cash to close
- Down payment
- $29,750
- Closing costs
- $3,570
- Reserves months
- —
- Total cash needed
- —
Loan-product check · same deal, 3 products live
Conventional
25% down · 7.5% · 30yr
- Down + closing
- —
- Monthly P&I
- —
- Monthly cashflow
- —
- DSCR
- —
- Eligible?
- —
Personal DTI + credit; lowest rate.
DSCR
20% down · 8.5% · 30yr
- Down + closing
- —
- Monthly P&I
- —
- Monthly cashflow
- —
- DSCR
- —
- Eligible?
- —
No personal income docs; deal must DSCR.
Hard money
10% down · 12.0% · 12mo
- Down + closing
- —
- Monthly P&I
- —
- Monthly cashflow
- —
- DSCR
- —
- Eligible?
- —
Short-term bridge; refi at stabilization.
Rent comps 2 comps
| Address | Beds | Baths | Sqft | Rent | $/sqft | DOM | Units | Dist |
|---|---|---|---|---|---|---|---|---|
| 4058 West Ave Ayden, NC | 2.0 | 1.0 | 1350 | $1,500 | $1.11 | 23d | 1 | 0.79mi |
| 4335 Legacy Park Way Ayden, NC | 2.0 | 2.0 | 1050 | $1,325 | $1.26 | 23d | 1 | 0.92mi |
Listing history 9 events
-
2026-06-23days on market $119,000 Active 10 DOM
-
2026-06-21days on market $119,000 Active 9 DOM
-
2026-06-19days on market $119,000 Active 7 DOM
-
2026-06-18days on market $119,000 Active 6 DOM
-
2026-06-17days on market $119,000 Active 5 DOM
-
2026-06-16days on market $119,000 Active 4 DOM
-
2026-06-15days on market $119,000 Active 3 DOM
-
2026-06-13remarks 650-char remark
-
2026-06-13$119,000 Active 1 DOM
ⓘ Source: listings_history table (triggers on properties + properties_extension) + one-shot
backfill from property_details.listing_events for pre-trigger history.
Tax reassessment forecast NC · Resets to sale price
- Current annual tax
- $1,007 · $84/mo
- Projected year-2 tax
- $1,007 · $84/mo
- Expected delta
- $0/yr ($0/mo · 0.0%)
ⓘ Screening estimate from a state-policy table — verify with the county assessor before closing.
Climate risk First Street
- Flood 1/10 Low FEMA zone X (unshaded) · 0% chance over 30 yrs
- Wildfire 2/10 Low
- Heat 8/10 Severe 7 d/yr ≥107°F today · 17 d/yr by 30 yrs out
- Wind 8/10 Severe 80% chance of damaging wind over 30 yrs
- Air quality 3/10 Moderate 3 unhealthy d/yr today · 3 by 30 yrs out
Nearby sold comps map
Loading sold comps map…
Walkable amenities ~0.75 mi
Loading nearby amenities…
Taxation est. · year 1
- Rental income
- $17,037
- − Mortgage interest
- −$6,666
- − Property taxes
- −$1,007
- − Insurance
- −$595
- − Repairs & maintenance
- −$1,363
- − Management
- −$1,363
- − Depreciation
- −$3,462
- Taxable income
- $2,581
- Est. tax owed @ 24.0%
- −$620
- After-tax cash flow
- $3,749/yr
For passive investors: Depreciation is non-cash, so a rental often shows a tax loss while cash-flowing — sheltering income. Rental losses are passive: they offset passive income freely, and up to $25,000/yr can offset ordinary (W-2) income if you actively participate and your MAGI is under $100k (phasing out to $0 by $150k); unused losses carry forward. On sale, claimed depreciation is recaptured at up to 25%, and gains may owe capital-gains tax (a 1031 exchange can defer both). Figures are a year-1 estimate at your 24.0% rate — not tax advice; consult a CPA.
Schools (NCES district)
- District
- Pitt County Schools
- NCES district ID
- 3700012
- Math proficiency
- 41% ▬ 0.00%
- Reading proficiency
- 44% ▲ 2.00%
- Median HH income
- $40,631
- Composite
- 35.67/100
- National rank
- #4877
- State rank
- #100 of 178 in NC
Livability — Ayden
- Score
- 76/100
- State rank
- #41
- US rank
- #3656
Category grades
Schools grade is shown separately in the Schools card above.
Census & demographics
- Census place
- Ayden, NC
- Population (ZIP)
- 9,754
Population outlook (Pitt County) Hauer SSP2
- Today (2025)
- 194,585 people
- By 2030
- 203,756 · +4.7%
- By 2040
- 220,807 · +13.5%
- By 2050
- 236,614 · +21.6%
- By 2075
- 275,940 · +41.8%
- By 2100
- 300,058 · +54.2%
Race, ethnicity, and origin ACS 2023
- Neighborhood character
- Diverse neighborhood (Simpson 0.58)
- Race & ethnicity
- White 57% Black 29% Hispanic / Latino 13% Two or more races 4%
- Hispanic origin (detail)
- Mexican 10% Puerto Rican 2% Cuban 1%
- Common ancestry
- Serbian 3% Italian 1% Iranian 1%
- Foreign-born
- 4% · Canada, Jamaica
- Languages at home
- 90% English-only · Spanish 10%
Political lean MEDSL · Pitt
- 2024 margin
- Lean D (+6.0) · D 52.5% · R 46.5% · Other 1.1%
- 2008→2024 swing
- -2.8pp toward R · 2008: 8.8pp · 2024: 6.0pp
- All cycles
- 2024: D+6.0 2020: D+9.4 2016: D+7.4 2012: D+6.7 2008: D+8.8
Not yet ingested
- Civics
- —
Market trends
- HPI YoY
- ▼ -18.36%
- Current HPI
- 190.2552
- Rent YoY
- —
- Metro
- —
- State GDP YoY
- ▲ 3.28%
- F500 in state
- 26
Industry mix (Fortune 500 HQ in NC)
| Industry | F500 HQs | Revenue |
|---|---|---|
| Financial Services | 2 | $213B |
|
||
| Retail | 2 | $95B |
|
||
| Industrial Conglomerate | 1 | $38B |
|
||
| Metals / Steel | 1 | $35B |
|
||
| Utilities | 1 | $30B |
|
||
| Industrial Machinery | 1 | $19B |
|
||
Price history
+58.7% since first listed2 events — show timeline
- 2026-06-12 Listed $119,000 Hive MLS
- 2026-04-24 Sold (Public Records) $75,000 Public Records
Property tax history
+22.0%/yrLatest (2025): $1,007 · +1.2% YoY. Source: county tax records.
Cash-flow waterfall
monthlySold comps — $/sqft
last 12 mo · ≤1 miLoading sold comps…