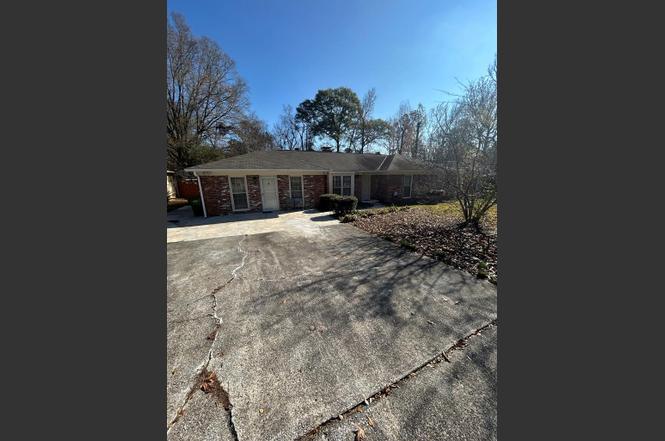
4032 Pickering Dr · Columbus, GA
Flood risk 1/10 · Minimal
- FEMA flood zone
- X (unshaded)
- Chance of flooding over 30 yrs
- 0.0%
- Est. flood insurance / yr
- $507 – $1,088
Fire risk 1/10 · Minimal
- Est. fire insurance / yr
- $963 – $1,789
Heat risk 7/10 · Major
- Hot days now (above 107°F)
- 7 days/yr
- Hot days in 30 yrs
- 19 days/yr
Wind risk 6/10 · Moderate
- Chance of severe wind over 30 yrs
- 76.0%
Air-quality risk 4/10 · Minor
- Unhealthy air days now
- 5 days/yr
- Unhealthy air days in 30 yrs
- 6 days/yr
Risk factors via First Street. Map © Google.
Why this score? — see what drove the C- grade
The composite is a weighted blend of 9 inputs, each scored 0–100. Each bar is that input's sub-score; the figure is the points it added to the 100-point composite (weight × sub-score).
- Cash flow +15.7/30.0
- ARV discount +15.0/15.0
- DSCR +4.8/10.0
- Rent growth +3.7/5.0
- Livability +3.2/5.0
- 1% rule +3.1/10.0
- Condition / age +2.5/5.0
- Schools +2.2/10.0
- Appreciation +0.0/10.0
$220,000
🖨 Deal sheet (PDF) 📄 Offer letter ✓ Due diligence
Listing remarks
This centrally located home close to Columbus State University and Manchester Expressway. Situated on a level lot in the Castlewood subdivision, this home needs some TLC but features an in-ground pool, a large fenced-in backyard and plenty of space to relax, work and entertain! With a large backyard featuring a creek, this 3 bedroom 2 bathroom home has a flex space great for an office or playroom and a brick patio space with brick grill by the sun porch and pool. The great room boast high cathedral ceilings and masonry fireplace. Painted outside Nov 2025
Key facts
- In-ground pool
- Brick patio
- Flex space
Tags
Neighborhood map
What this means for you Summary
Snapshot
- This is a 3-bed/2.0-bath single-family listed at $220k.
Deal economics
- At list price, monthly cash flow is $97 ($1k/yr) — positive.
- The deal already cash-flows at list — no discount required.
- To meet the 1% rule (rent ≥ 1% of price), the offer needs to be $179k (18.8% below list).
- Recommended offer: $179k (18.8% below list) — sets the bar for 1% rule.
- Cap rate 6.8% vs local median 4.7% in Columbus — top-decile yield for the area; either an underpriced asset or a hidden risk that comps aren't pricing in. Stress-test before assuming the spread holds.
Location & tenants
- Location reads 64/100 on livability (#254 in GA) — a middle-class / working-renter tenant base. Strengths: cost of living A+, housing A+, health & safety B; Watch: amenities D+, crime F, commute F.
- Muscogee County (urban): math 21% / reading 30% proficiency, ranked #120 of 174 in GA (top 69%) — low school quality limits family demand, transient renter base, plan for 1-2y turnover; 61% free/reduced lunch — lower-income household profile, screen leases tightly.
- Zoned schools: Reese Road Leadership Academy (math 12% / reading 17%, grade F, #996 of 1,228 statewide, top 83%, 387 students, 97% FRL); Fort Middle School (math 11% / reading 22%, grade F, #388 of 470 statewide, top 83%, 511 students, 97% FRL); Hardaway High School (math 8% / reading 2%, grade F, #394 of 424 statewide, top 97%, 1,184 students, 97% FRL) — zoned schools average 97% FRL vs 61% district-wide (36 pts higher); higher-poverty schools than district average — tighter screening recommended.
- Zoned-school proficiency averages 12% at this address vs 26% district-wide (-14 pts) — the specific schools serving this property underperform the Muscogee County average; the district grade overstates school quality for this exact location.
- Market conditions: Rents rising fast (+4.8%/yr); 274 active listings in the ZIP; 10 comparable units currently listed for rent nearby; rentals at typical pace (median 23d on market — plan ~3-4 weeks tenant-placement turnaround); 40% of comp listings sitting > 30 days — soft ceiling on asking rent; 291 units permitted in Muscogee County in 2024 (30 in 5+ unit buildings).
- This rent runs 39% of the median local income ($54k/yr) — at the standard rent-burdened threshold; future hikes will face affordability resistance.
Forward outlook
- Local home prices are declining (-3.0%/yr); year-one equity from $2k of loan paydown is wiped out by about $7k of value loss. Plan a longer hold.
- Muscogee County population projected at +15% by 2050 — modest demand growth; plan on rents tracking national, not racing it.
Negotiation context
- It's been on market 137 days — a 12% lower offer ($194k) is reasonable based on typical stale-listing flexibility.
Risks & watch-outs
- Climate carrying-cost: major wind risk, 76% chance of damaging wind over 30y; extreme-heat days projected 7→19/yr by 2055 (HVAC capex compounding) — expect insurance premiums to compound above CPI over the hold.
Questions for the listing agent
- It's been on market 137 days. Have you received any prior offers? Is the seller open to a 19% concession, seller financing, or rate buy-down credit?
- Why hasn't it sold? Are there any deal-killer items the seller is aware of (foundation, flood, title, zoning, code violations)?
- Is there a deadline driving the sale (1031 exchange, divorce, estate, relocation)? That informs how much negotiation room exists.
- Schools are F-rated, which usually means shorter tenancies and higher turnover. Who's the typical renter profile here, and what's been the actual vacancy rate?
- Crime grade is F in this area — have there been break-ins, vandalism, or insurance claims at this property in the last 3 years? What carrier currently insures it and at what premium?
- What's the average days-on-market for RENTAL listings here right now (not sales)? A rising rental-DOM trend means longer vacancies and softer asking-rent achievability than the comps imply.
- What's the recent tenant-quality profile in this submarket — average credit score on applications, eviction rate, late-payment / NSF rate, and stable-employment percentage? A property-management company in the area should have these aggregated.
- How much new for-sale + rental construction is in the pipeline within 1–3 miles? Heavy new supply typically softens prices + rents 12–24 months out; constrained supply supports both.
Investment metrics
- 1% rule
- 0.81% ✗
- Cap rate
- 6.82%
- Cash-on-cash
- 1.90%
- DSCR
- 1.08
- GRM
- 10.3
CMA / ARV
- ARV (on-the-fly)
- $274,950
- Comps found
- 12
Show comp detail 12 sales within ~0.75 mi
| Address | Dist | Beds/Ba | Sqft | Sold | Price | $/sf | Match |
|---|---|---|---|---|---|---|---|
| 4032 Pickering Dr | 0.00mi | 3/2.0 | 2,350 (0%) | 1mo | $175,000 | $74 | 99 |
| 4400 Abingdon Ct | 0.14mi | 4/2.5 (+1) | 2,264 (-4%) | 8mo | $301,200 | $133 | 74 |
| 10 Conisburgh Ct | 0.25mi | 4/3.0 (+1) | 2,308 (-2%) | 5mo | $329,000 | $143 | 72 |
| 4738 Shenandoah Dr | 0.56mi | 3/2.0 | 2,356 (+0%) | 3mo | $275,000 | $117 | 71 |
| 4285 Deanery Ct | 0.33mi | 3/2.0 | 2,047 (-13%) | 1mo | $324,000 | $158 | 63 |
| 4322 Aster Ave | 0.27mi | 3/2.5 | 2,035 (-13%) | 2mo | $185,000 | $91 | 61 |
| 4407 Florence Dr | 0.67mi | 4/2.5 (+1) | 2,339 (-0%) | 4mo | $270,000 | $115 | 58 |
| 4409 Smokey Mountain Trl | 0.64mi | 4/2.0 (+1) | 2,442 (+4%) | 2mo | $249,900 | $102 | 57 |
| 4524 Hedingham Ln | 0.31mi | 4/2.5 (+1) | 2,656 (+13%) | 4mo | $334,000 | $126 | 54 |
| 4811 Allegheny Dr | 0.60mi | 3/2.0 | 2,612 (+11%) | 10mo | $280,000 | $107 | 45 |
| 3077 Reese Rd | 0.61mi | 4/2.5 (+1) | 2,112 (-10%) | 8mo | $330,000 | $156 | 41 |
| 2951 Florence Dr | 0.68mi | 4/3.0 (+1) | 2,599 (+11%) | 2mo | $287,000 | $110 | 40 |
Match score weights: distance 35% · size 25% · config 20% · recency 20%. Top-matched comps best support the ARV.
Projected returns pro-forma
-3.0% appreciation · 4.82% rent growth · sell at horizon
- IRR
- -11.6%
- Equity multiple
- 0.57×
- Total profit
- $-26,216
- Equity at exit
- $32,803
- IRR
- -0.2%
- Equity multiple
- 0.98×
- Total profit
- $-1,067
- Equity at exit
- $19,022
Cash invested: $61,600 (down + closing). Projections, not guarantees.
Landlord ↔ Tenant lean methodology
- Overall (STATE)
- 90 Strongly Landlord-Friendly
- State Georgia
- 90 Strongly Landlord-Friendly · R+3
- County
- — inherits STATE
- City
- — inherits STATE
ZIP-level market 31907
- Rents YoY
- 4.8%
- Active inventory
- 274
- Price-to-rent
- 10.3×
Monthly cashflow live
- Estimated rent
- $1,786 high interval (Pro) →
- Mortgage (P&I)
- −$1,154
- Tax from tax record
- −$68 /mo · $815/yr
- Insurance
- −$92
- HOA
- −$0
- Vacancy / Maint / Mgmt
- −$375
- Net cashflow
- $97
Break-even live
Sensitivity live
| Price | -10% $222 | -5% $160 | +0% $97 | +5% $35 | +10% $-27 |
|---|---|---|---|---|---|
| Rent | -10% $-44 | -5% $27 | +0% $97 | +5% $168 | +10% $238 |
| Rate | -1.0pp $208 | -0.5pp $153 | base $97 | +0.5pp $40 | +1.0pp $-18 |
UW: 25.0% down · 7.5% · 30yr · 1.5% tax · 5.0% vac · 8.0% maint · 8.0% mgmt
Financing live
Cash to close
- Down payment
- $55,000
- Closing costs
- $6,600
- Reserves months
- —
- Total cash needed
- —
Loan-product check · same deal, 3 products live
Conventional
25% down · 7.5% · 30yr
- Down + closing
- —
- Monthly P&I
- —
- Monthly cashflow
- —
- DSCR
- —
- Eligible?
- —
Personal DTI + credit; lowest rate.
DSCR
20% down · 8.5% · 30yr
- Down + closing
- —
- Monthly P&I
- —
- Monthly cashflow
- —
- DSCR
- —
- Eligible?
- —
No personal income docs; deal must DSCR.
Hard money
10% down · 12.0% · 12mo
- Down + closing
- —
- Monthly P&I
- —
- Monthly cashflow
- —
- DSCR
- —
- Eligible?
- —
Short-term bridge; refi at stabilization.
Rent comps 10 comps
| Address | Beds | Baths | Sqft | Rent | $/sqft | DOM | Units | Dist |
|---|---|---|---|---|---|---|---|---|
| 4100 King Arthur Pl Columbus, GA | 3.0 | 2.0 | 1701 | $1,650 | $0.97 | 15d | 1 | 0.32mi |
| 4221 Bonnie Dr Columbus, GA | 3.0 | 2.0 | 1700 | $1,750 | $1.03 | 22d | 1 | 0.44mi |
| 3853 Rockdale Dr Columbus, GA | 4.0 | 2.0 | 1648 | $1,650 | $1.00 | 45d | 1 | 0.45mi |
| 5077 Pond View Dr Columbus, GA | 4.0 | 2.5 | 2726 | $2,800 | $1.03 | 45d | 1 | 0.84mi |
| 3110 College Ave Columbus, GA | 4.0 | 1.5 | 1604 | $1,875 | $1.17 | 22d | 1 | 1.09mi |
| 3520 Algonquin Dr Columbus, GA | 4.0 | 3.0 | 2829 | $2,350 | $0.83 | 15d | 1 | 1.13mi |
| 4478 Lapaloma Dr Columbus, GA | 3.0 | 2.5 | 1787 | $1,550 | $0.87 | 22d | 1 | 1.17mi |
| 6009 N Pointe Dr Columbus, GA | 4.0 | 2.0 | 1733 | $1,650 | $0.95 | 45d | 1 | 1.24mi |
| 5577 Terrace Pointe Ct Columbus, GA | 3.0 | 2.0 | 1667 | $1,850 | $1.11 | 22d | 1 | 1.30mi |
| 2525 Norris Rd #37 Columbus, GA | 3.0 | 2.5 | 2094 | $1,750 | $0.84 | 45d | 1 | 1.38mi |
Listing history 4 events
-
2026-04-26status Pending
-
2026-04-14price $220,000
-
2026-01-26price $240,000
-
2025-12-10$280,000 Active
ⓘ Source: listings_history table (triggers on properties + properties_extension) + one-shot
backfill from property_details.listing_events for pre-trigger history.
Tax reassessment forecast GA · Resets to sale price
- Current annual tax
- $815 · $68/mo
- Projected year-2 tax
- $2,024 · $169/mo
- Expected delta
- +$1,209/yr (+$101/mo · 148.3%)
ⓘ Screening estimate from a state-policy table — verify with the county assessor before closing.
Climate risk First Street
- Flood 1/10 Low FEMA zone X (unshaded) · 0% chance over 30 yrs
- Wildfire 1/10 Low
- Heat 7/10 Severe 7 d/yr ≥107°F today · 19 d/yr by 30 yrs out
- Wind 6/10 Major 76% chance of damaging wind over 30 yrs
- Air quality 4/10 Moderate 5 unhealthy d/yr today · 6 by 30 yrs out
Nearby sold comps map
Loading sold comps map…
Walkable amenities ~0.75 mi
Loading nearby amenities…
Taxation est. · year 1
- Rental income
- $21,429
- − Mortgage interest
- −$12,323
- − Property taxes
- −$815
- − Insurance
- −$1,100
- − Repairs & maintenance
- −$1,714
- − Management
- −$1,714
- − Depreciation
- −$6,400
- Taxable loss
- −$2,639
- Est. tax savings @ 24.0%
- +$633
- After-tax cash flow
- $1,802/yr
For passive investors: Depreciation is non-cash, so a rental often shows a tax loss while cash-flowing — sheltering income. Rental losses are passive: they offset passive income freely, and up to $25,000/yr can offset ordinary (W-2) income if you actively participate and your MAGI is under $100k (phasing out to $0 by $150k); unused losses carry forward. On sale, claimed depreciation is recaptured at up to 25%, and gains may owe capital-gains tax (a 1031 exchange can defer both). Figures are a year-1 estimate at your 24.0% rate — not tax advice; consult a CPA.
Schools (NCES district)
- District
- Muscogee County
- NCES district ID
- 1303870
- Math proficiency
- 21% ▼ -11.00%
- Reading proficiency
- 30% ▼ -7.00%
- Median HH income
- $41,176
- Composite
- 21.6/100
- National rank
- #8297
- State rank
- #120 of 174 in GA
Livability — Columbus
- Score
- 64/100
- State rank
- #254
- US rank
- #14102
Category grades
Schools grade is shown separately in the Schools card above.
Census & demographics
- Census place
- Columbus, GA
- County
- Muscogee County · 180,764 people
- City population
- 180,764
- Metro
- Columbus, GA-AL
- Population (ZIP)
- 59,110
- Household income
- $54,453
- Rent vs Own
- Severe rent burden
- 2138.0
Population outlook (Muscogee County) Hauer SSP2
- Today (2025)
- 216,729 people
- By 2030
- 224,504 · +3.6%
- By 2040
- 238,318 · +10.0%
- By 2050
- 249,027 · +14.9%
- By 2075
- 264,862 · +22.2%
- By 2100
- 254,786 · +17.6%
Race, ethnicity, and origin ACS 2023
- Neighborhood character
- Majority Black (64%)
- Race & ethnicity
- Black 64% White 22% Two or more races 8% Hispanic / Latino 6% Asian 1%
- Hispanic origin (detail)
- Mexican 2% Puerto Rican 2%
- Common ancestry
- Italian 1% Slovak 1%
- Foreign-born
- 4% · Canada, South Korea
- Languages at home
- 95% English-only · Spanish 3%
Political lean MEDSL · Muscogee
- 2024 margin
- Strong D (+23.4) · D 61.4% · R 38.0%
- 2008→2024 swing
- +3.7pp toward D · 2008: 19.7pp · 2024: 23.4pp
- All cycles
- 2024: D+23.4 2020: D+24.0 2016: D+18.6 2012: D+21.3 2008: D+19.7
Not yet ingested
- Civics
- —
Market trends
- HPI YoY
- ▼ -125.88%
- Current HPI
- 151.74
- Rent YoY
- ▲ 4.82%
- Metro
- Columbus, GA-AL
- State GDP YoY
- ▲ 2.66%
- F500 in state
- 28
Industry mix (Fortune 500 HQ in GA)
| Industry | F500 HQs | Revenue |
|---|---|---|
| Paper / Packaging | 2 | $29B |
|
||
| Retail | 1 | $160B |
|
||
| Transportation / Logistics | 1 | $91B |
|
||
| Airlines | 1 | $62B |
|
||
| Consumer Goods | 1 | $47B |
|
||
| Utilities | 1 | $25B |
|
||
Price history
-21.4% since first listed4 events — show timeline
- 2026-04-26 Pending — CBOR
- 2026-04-14 Price Changed $220,000 CBOR
- 2026-01-26 Price Changed $240,000 CBOR
- 2025-12-10 Listed $280,000 CBOR
Property tax history
-0.5%/yrLatest (2025): $815 · +0.2% YoY. Source: county tax records.
Cash-flow waterfall
monthlySold comps — $/sqft
last 12 mo · ≤1 miLoading sold comps…