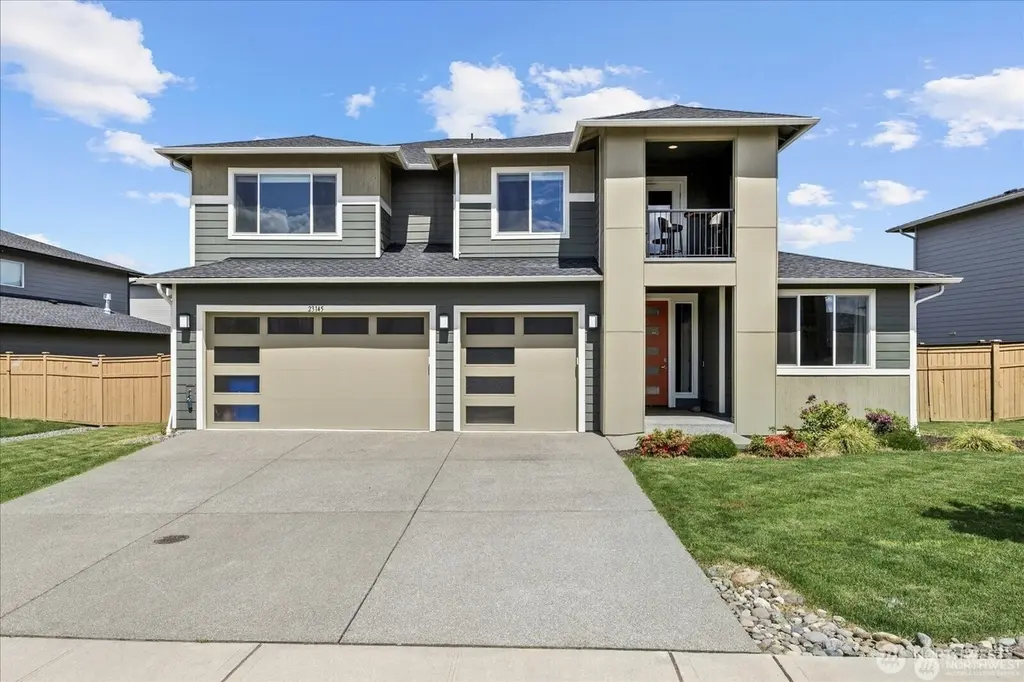
23145 65th St E · Lake Tapps, WA
Flood risk 1/10 · Minimal
- FEMA flood zone
- X (unshaded)
- Chance of flooding over 30 yrs
- 0.0%
- Est. flood insurance / yr
- $507 – $1,088
Fire risk 4/10 · Minor
- Est. fire insurance / yr
- $604 – $1,122
Heat risk 2/10 · Minimal
- Hot days now (above 88°F)
- 7 days/yr
- Hot days in 30 yrs
- 15 days/yr
Wind risk 1/10 · Minimal
- Chance of severe wind over 30 yrs
- —
Air-quality risk 6/10 · Moderate
- Unhealthy air days now
- 10 days/yr
- Unhealthy air days in 30 yrs
- 12 days/yr
Risk factors via First Street. Map © Google.
Why this score? — see what drove the D- grade
The composite is a weighted blend of 9 inputs, each scored 0–100. Each bar is that input's sub-score; the figure is the points it added to the 100-point composite (weight × sub-score).
- ARV discount +12.1/15.0
- Cash flow +7.8/30.0
- Schools +5.7/10.0
- Livability +3.4/5.0
- Rent growth +2.5/5.0
- Condition / age +2.5/5.0
- 1% rule +2.0/10.0
- DSCR +1.9/10.0
- Appreciation +0.0/10.0
$875,000
🖨 Deal sheet 📄 Offer letter ✓ Due diligence
Listing remarks
Your second chance at the most coveted 6 bedroom floor plan in Elk Run, at a massively discounted price! Step inside to be greeted by soaring vaulted ceilings, expansive natural light, and a layout designed for true multi-generational living. The main floor features two full bedroom suites—a luxurious Primary Suite plus a private Junior Suite ideal for extended household needs or long-term guests. The gourmet kitchen stands out with modern illuminated cabinetry, a butler’s pantry, and a massive quartz island perfect for entertaining. Oversized sliders open up to a large fully fenced yard with a covered outdoor living space, extending your hosting area year-round. Upstairs, gen
Key facts
- Butler's pantry
- Cozy covered patio
- Vaulted ceilings
Tags
Neighborhood map
What this means for you Summary
Snapshot
- This is a 4-bed/3.0-bath single-family listed at $875k.
Deal economics
- At list price, monthly cash flow is $-968 ($-12k/yr) — negative.
- To cash-flow at today's rent, offer at most $704k (19.5% below list).
- To meet the 1% rule (rent ≥ 1% of price), the offer needs to be $610k (30.3% below list).
- Recommended offer: $610k (30.3% below list) — sets the bar for 1% rule.
- Cap rate 5.0% vs local median 2.7% in Lake Tapps — top-decile yield for the area; either an underpriced asset or a hidden risk that comps aren't pricing in. Stress-test before assuming the spread holds.
Location & tenants
- Location reads 68/100 on livability (#289 in WA) — a middle-class / working-renter tenant base. Strengths: schools A+, crime A+, employment A+; Watch: amenities F, commute F, cost of living F.
- White River School District (suburban): math 57% / reading 68% proficiency, ranked #35 of 291 in WA (top 12%) — acceptable for families but not a draw, mixed tenant base, ~2y average lease.
- Market conditions: 235 active listings in the ZIP; 1 comparable units currently listed for rent nearby; 3,209 units permitted in Pierce County in 2024 (1,269 in 5+ unit buildings).
Forward outlook
- Local home prices are declining (-3.0%/yr); year-one equity from $6k of loan paydown is wiped out by about $26k of value loss. Plan a longer hold.
- Pierce County population projected at +26% by 2050 — long-run rental-demand tailwind backs the buy-and-hold thesis.
Negotiation context
- It's been on market 139 days — a 12% lower offer ($770k) is reasonable based on typical stale-listing flexibility.
- 3 sale attempts since 6y ago with the ask held roughly flat each time — persistent listings suggest the price (not the market) is what's stuck; bring a comps-based counter.
Questions for the listing agent
- What do current leases actually rent for vs. the listed asking? Can we see a recent rent roll and the last 12 months of T-12 income?
- It's been on market 139 days. Have you received any prior offers? Is the seller open to a 30% concession, seller financing, or rate buy-down credit?
- What does the HOA fee cover, when was the last increase, and are there any pending special assessments or reserve-fund shortfalls?
- Why hasn't it sold? Are there any deal-killer items the seller is aware of (foundation, flood, title, zoning, code violations)?
- Is there a deadline driving the sale (1031 exchange, divorce, estate, relocation)? That informs how much negotiation room exists.
- Schools are A-rated — typically a magnet for longer-tenancy family renters. What's the average tenant stay here, and is there a school-zone premium baked into asking?
- The area grade is low — what's the realistic commute time and amenity access for the typical tenant pool here? Any planned neighborhood developments (good or bad) we should know about?
- What's the average days-on-market for RENTAL listings here right now (not sales)? A rising rental-DOM trend means longer vacancies and softer asking-rent achievability than the comps imply.
- What's the recent tenant-quality profile in this submarket — average credit score on applications, eviction rate, late-payment / NSF rate, and stable-employment percentage? A property-management company in the area should have these aggregated.
- How much new for-sale + rental construction is in the pipeline within 1–3 miles? Heavy new supply typically softens prices + rents 12–24 months out; constrained supply supports both.
Investment metrics
- 1% rule
- 0.70% ✗
- Cap rate
- 4.97%
- Cash-on-cash
- -4.74%
- DSCR
- 0.79
- GRM
- 12.0
CMA / ARV
- ARV (median comp)
- $975,222
- List price
- $875,000
- Delta
- -10.28%
- Verdict
- UNDERPRICED
- Comps
- 20 within 1.0 mi
Show comp detail 12 sales within ~0.75 mi
| Address | Dist | Beds/Ba | Sqft | Sold | Price | $/sf | Match |
|---|---|---|---|---|---|---|---|
| 22802 61st St E #294 | 0.21mi | 5/3.5 (+1) | 3,445 (+2%) | 2mo | $968,725 | $281 | 77 |
| 22806 61st St E #295 | 0.20mi | 5/3.5 (+1) | 3,372 (+0%) | 10mo | $1,002,509 | $297 | 76 |
| 22816 64th Ln E | 0.16mi | 5/3.5 (+1) | 3,444 (+2%) | 10mo | $940,000 | $273 | 74 |
| 6202 229th Ave E #305 | 0.22mi | 4/2.5 | 3,086 (-8%) | 2mo | $899,000 | $291 | 72 |
| 6602 232nd Ave E | 0.09mi | 5/2.5 (+1) | 3,093 (-8%) | 5mo | $799,000 | $258 | 71 |
| 22828 61st St E #300 | 0.23mi | 5/3.5 (+1) | 3,445 (+2%) | 11mo | $976,875 | $284 | 70 |
| 6109 232nd Ave E | 0.25mi | 4/2.5 | 3,086 (-8%) | 8mo | $899,000 | $291 | 65 |
| 23106 62nd St E | 0.18mi | 5/3.5 (+1) | 2,988 (-11%) | 1mo | $944,175 | $316 | 65 |
| 22801 61st St E #293 | 0.23mi | 5/3.0 (+1) | 2,983 (-11%) | 2mo | $930,000 | $312 | 64 |
| 6903 232nd Ave E | 0.29mi | 5/2.5 (+1) | 3,169 (-6%) | 12mo | $1,020,000 | $322 | 60 |
| 23211 57th St E | 0.54mi | 4/2.5 | 3,033 (-10%) | 9mo | $957,395 | $316 | 49 |
| 7505 225th Avenue Ct E | 0.69mi | 5/2.5 (+1) | 3,156 (-6%) | 12mo | $745,000 | $236 | 40 |
Match score weights: distance 35% · size 25% · config 20% · recency 20%. Top-matched comps best support the ARV.
Projected returns pro-forma
-3.0% appreciation · 3.0% rent growth · sell at horizon
- IRR
- -24.4%
- Equity multiple
- 0.17×
- Total profit
- $-203,507
- Equity at exit
- $130,465
- IRR
- -19.8%
- Equity multiple
- -0.05×
- Total profit
- $-256,871
- Equity at exit
- $75,654
Cash invested: $245,000 (down + closing). Projections, not guarantees.
Landlord ↔ Tenant lean methodology
- Overall (STATE)
- 28 Tenant-Leaning
- State Washington
- 28 Tenant-Leaning · D+8
- County
- — inherits STATE
- City
- — inherits STATE
ZIP-level market 98321
- Active inventory
- 235
- Price-to-rent
- 12.0×
Monthly cashflow live
- Estimated rent
- $6,100 medium interval (Pro) →
- Mortgage (P&I)
- −$4,589
- Tax from tax record
- −$784 /mo · $9,406/yr
- Insurance
- −$365
- HOA
- −$50
- Vacancy / Maint / Mgmt
- −$1,281
- Net cashflow
- $-968
Break-even live
UW: 25.0% down · 7.5% · 30yr · 1.5% tax · 5.0% vac · 8.0% maint · 8.0% mgmt
Financing live
Cash to close
- Down payment
- $218,750
- Closing costs
- $26,250
- Reserves months
- —
- Total cash needed
- —
Loan-product check · same deal, 3 products live
Conventional
25% down · 7.5% · 30yr
- Down + closing
- —
- Monthly P&I
- —
- Monthly cashflow
- —
- DSCR
- —
- Eligible?
- —
Personal DTI + credit; lowest rate.
DSCR
20% down · 8.5% · 30yr
- Down + closing
- —
- Monthly P&I
- —
- Monthly cashflow
- —
- DSCR
- —
- Eligible?
- —
No personal income docs; deal must DSCR.
Hard money
10% down · 12.0% · 12mo
- Down + closing
- —
- Monthly P&I
- —
- Monthly cashflow
- —
- DSCR
- —
- Eligible?
- —
Short-term bridge; refi at stabilization.
Rent comps 1 comps
| Address | Beds | Baths | Sqft | Rent | $/sqft | DOM | Units | Dist |
|---|---|---|---|---|---|---|---|---|
| 23056 64th Street Ct E Unit 1 Buckley, WA | 5.0 | 3.5 | 3358 | $6,100 | $1.82 | 43d | 1 | 0.08mi |
HOA detail
- Monthly dues
- $50 · $600/yr
Listing history 23 events
-
2026-06-18days on market $875,000 Active 139 DOM
-
2026-06-17days on market $875,000 Active 138 DOM
-
2026-06-16days on market $875,000 Active 137 DOM
-
2026-06-15days on market $875,000 Active 136 DOM
-
2026-06-13days on market $875,000 Active 134 DOM
-
2026-06-13days on market $875,000 Active 133 DOM
-
2026-06-09days on market $875,000 Active 130 DOM
-
2026-06-08days on market $875,000 Active 129 DOM
-
2026-06-07days on market $875,000 Active 128 DOM
-
2026-06-04days on market $875,000 Active 125 DOM
-
2026-06-03days on market $875,000 Active 124 DOM
-
2026-06-02days on market $875,000 Active 123 DOM
-
2026-06-01days on market $875,000 Active 122 DOM
-
2026-05-31days on market $875,000 Active 121 DOM
-
2026-04-21status Active
-
2026-04-21price $875,000
-
2026-03-21status Pending
-
2026-02-12price $860,000
-
2025-12-30$875,000 Active
-
2021-07-06soldstatus $777,322 Closed
-
2021-05-06status Pending
-
2020-12-31$750,950
-
2020-12-31historical
ⓘ Source: listings_history table (triggers on properties + properties_extension) + one-shot
backfill from property_details.listing_events for pre-trigger history.
Tax reassessment forecast WA · Resets to sale price
- Current annual tax
- $9,406 · $784/mo
- Projected year-2 tax
- $9,406 · $784/mo
- Expected delta
- $0/yr ($0/mo · 0.0%)
ⓘ Screening estimate from a state-policy table — verify with the county assessor before closing.
Climate risk First Street
- Flood 1/10 Low FEMA zone X (unshaded) · 0% chance over 30 yrs
- Wildfire 4/10 Moderate
- Heat 2/10 Low 7 d/yr ≥88°F today · 15 d/yr by 30 yrs out
- Wind 1/10 Low
- Air quality 6/10 Major 10 unhealthy d/yr today · 12 by 30 yrs out
Nearby sold comps map
Loading sold comps map…
Walkable amenities ~0.75 mi
Loading nearby amenities…
Taxation est. · year 1
- Rental income
- $73,200
- − Mortgage interest
- −$49,014
- − Property taxes
- −$9,406
- − Insurance
- −$4,375
- − Repairs & maintenance
- −$5,856
- − Management
- −$5,856
- − HOA
- −$600
- − Depreciation
- −$25,455
- Taxable loss
- −$27,361
- Est. tax savings @ 24.0%
- +$6,567
- After-tax cash flow
- $-5,049/yr
For passive investors: Depreciation is non-cash, so a rental often shows a tax loss while cash-flowing — sheltering income. Rental losses are passive: they offset passive income freely, and up to $25,000/yr can offset ordinary (W-2) income if you actively participate and your MAGI is under $100k (phasing out to $0 by $150k); unused losses carry forward. On sale, claimed depreciation is recaptured at up to 25%, and gains may owe capital-gains tax (a 1031 exchange can defer both). Figures are a year-1 estimate at your 24.0% rate — not tax advice; consult a CPA.
Schools (NCES district)
- District
- White River School District
- NCES district ID
- 5309780
- Math proficiency
- 57% ▲ 3.00%
- Reading proficiency
- 68% ▲ 6.00%
- Median HH income
- $71,369
- Composite
- 56.68/100
- National rank
- #2423
- State rank
- #35 of 291 in WA
Livability — Lake Tapps
- Score
- 68/100
- State rank
- #289
- US rank
- #10068
Category grades
Schools grade is shown separately in the Schools card above.
Census & demographics
- Population (ZIP)
- 17,601
Population outlook (Pierce County) Hauer SSP2
- Today (2025)
- 956,648 people
- By 2030
- 1,010,862 · +5.7%
- By 2040
- 1,113,170 · +16.4%
- By 2050
- 1,206,524 · +26.1%
- By 2075
- 1,436,425 · +50.2%
- By 2100
- 1,563,654 · +63.5%
Race, ethnicity, and origin ACS 2023
- Neighborhood character
- Predominantly White (87%)
- Race & ethnicity
- White 87% Hispanic / Latino 6% Two or more races 5% Native American 2% Asian 1%
- Hispanic origin (detail)
- Mexican 3% Puerto Rican 2%
- Common ancestry
- Portuguese 7% Italian 4% Lithuanian 3%
- Foreign-born
- 2% · China, Canada
- Languages at home
- 97% English-only · Spanish 1% Other Asian/Pacific 1%
Political lean MEDSL · Pierce
- 2024 margin
- D (+10.8) · D 53.9% · R 43.1% · Other 3.0%
- 2008→2024 swing
- -1.4pp toward R · 2008: 12.2pp · 2024: 10.8pp
- All cycles
- 2024: D+10.8 2020: D+11.2 2016: D+7.5 2012: D+11.0 2008: D+12.2
Not yet ingested
- Civics
- —
Market trends
- HPI YoY
- ▼ -206.67%
- Current HPI
- 310.6568
- Rent YoY
- —
- Metro
- —
- State GDP YoY
- ▲ 4.65%
- F500 in state
- 22
Industry mix (Fortune 500 HQ in WA)
| Industry | F500 HQs | Revenue |
|---|---|---|
| Retail | 2 | $269B |
|
||
| Technology / Retail | 1 | $638B |
|
||
| Technology | 1 | $245B |
|
||
| Telecommunications | 1 | $38B |
|
||
| Food / Beverage | 1 | $36B |
|
||
| Automotive / Trucks | 1 | $34B |
|
||
Price history
+16.5% since first listed9 events — show timeline
- 2026-04-21 Relisted — NWMLS as Distributed by MLS Grid
- 2026-04-21 Price Changed $875,000 NWMLS as Distributed by MLS Grid
- 2026-03-21 Pending — NWMLS as Distributed by MLS Grid
- 2026-02-12 Price Changed $860,000 NWMLS as Distributed by MLS Grid
- 2025-12-30 Listed $875,000 NWMLS as Distributed by MLS Grid
- 2021-07-06 Sold (MLS) $777,322 NWMLS as Distributed by MLS Grid
- 2021-05-06 Pending — NWMLS as Distributed by MLS Grid
- 2020-12-31 Delisted — NWMLS as Distributed by MLS Grid
- 2020-12-31 Listed $750,950 NWMLS as Distributed by MLS Grid
Property tax history
+44.4%/yrLatest (2026): $9,406 · -1.0% YoY. Source: county tax records.
Cash-flow waterfall
monthlySold comps — $/sqft
last 12 mo · ≤1 miLoading sold comps…