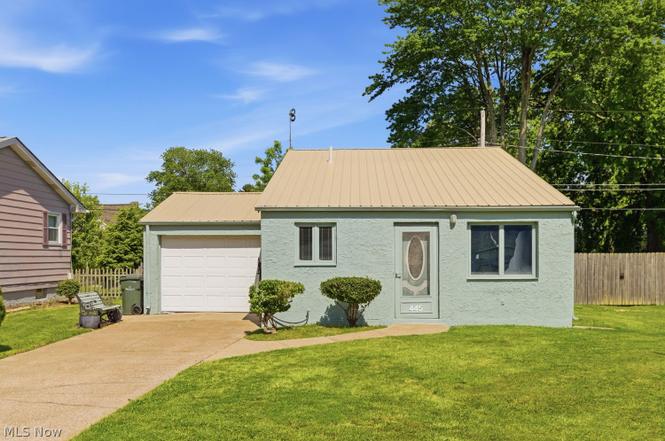
445 Morton Rd · Vermilion, OH
Flood risk 5/10 · Moderate
- FEMA flood zone
- X (unshaded)
- Chance of flooding over 30 yrs
- 0.47%
- Est. flood insurance / yr
- $473 – $860
Fire risk 1/10 · Minimal
- Est. fire insurance / yr
- $713 – $1,323
Heat risk 3/10 · Minor
- Hot days now (above 96°F)
- 7 days/yr
- Hot days in 30 yrs
- 17 days/yr
Wind risk 1/10 · Minimal
- Chance of severe wind over 30 yrs
- —
Air-quality risk 3/10 · Minor
- Unhealthy air days now
- 2 days/yr
- Unhealthy air days in 30 yrs
- 3 days/yr
Risk factors via First Street. Map © Google.
Why this score? — see what drove the B- grade
The composite is a weighted blend of 9 inputs, each scored 0–100. Each bar is that input's sub-score; the figure is the points it added to the 100-point composite (weight × sub-score).
- Cash flow +27.3/30.0
- ARV discount +11.0/15.0
- DSCR +9.5/10.0
- 1% rule +6.4/10.0
- Schools +5.0/10.0
- Livability +4.0/5.0
- Rent growth +2.5/5.0
- Condition / age +2.5/5.0
- Appreciation +0.0/10.0
$199,900
🖨 Deal sheet 📄 Offer letter ✓ Due diligence
Listing remarks MLS
Looking for a home with deeded beach access to Elberta Beach that doesn't cost an arm and a leg? Maybe a year round residence or a summer home to get out of the Florida heat? Take a look at this oh-so-cool block constructed 2 bed, 2 bath Cape Cod with an open floor plan! All appliances stay along with everything else you see inside, right down to the pots and pans. Totally turn key! Outside you will find a 1 car attached garage making bringing home groceries super easy and is equipped with 220V for those bigger jobs. The shed is plenty big and has a workshop area. And a completely fenced in back yard is ready for any furry friends you have and has served as boat storage in the past! 3 trees were removed awhile back and the stucco exterior was just redone too! The home is topped off with a metal roof that takes away future roof replacement worries. Location is everything, and this home delivers! Bike to downtown Vermilion's shops, restaurants, hardware store, marinas, waterfront attractions, and of course, your favorite ice cream stop. Spend your days at the beach, watching boats come and go, or enjoying all that this vibrant lakeside community has to offer. Don't miss this opportunity to own an affordable slice of Vermilion living. Call today to schedule your private showing!
Key facts
- Deeded beach access
- Open floor plan
- Attached garage
Tags
Property features AI
Exterior
- Parking: Attached 1-car garage
- Utilities: Public water; Public sewer
- Home design: Single-family residence; Residential property
- Construction: Stucco construction; Metal roof; Partially finished basement
- Exterior features: Metal roof; Stucco exterior; 0.12-acre lot
Interior
- Kitchen: Dishwasher; Microwave; Range; Refrigerator
- Bedrooms: 6 total rooms (bedroom count not specified)
- Bathrooms: 2 full bathrooms
- Interior features: Dishwasher; Dryer; Microwave; Range; Refrigerator; Washer; Partially finished basement
- Laundry & utility: Washer and Dryer
Neighborhood map
What this means for you Summary
Snapshot
- This is a 2-bed/1.0-bath single-family listed at $200k.
Deal economics
- At list price, monthly cash flow is $581 ($7k/yr) — positive.
- The deal already cash-flows at list — no discount required.
- Meets the 1% rule at list price ($2k rent vs $200k).
- Cap rate 9.8% vs local median 5.0% in Vermilion — top-decile yield for the area; either an underpriced asset or a hidden risk that comps aren't pricing in. Stress-test before assuming the spread holds.
Location & tenants
- Location reads 81/100 on livability (#96 in OH, #1,481 nationally) — a professional / high-income tenant draw. Strengths: crime A+, cost of living A+, housing A+; Watch: commute F.
- Vermilion Local (suburban): math 56% / reading 60% proficiency, ranked #316 of 656 in OH (top 48%) — acceptable for families but not a draw, mixed tenant base, ~2y average lease.
- Market conditions: 142 active listings in the ZIP; 1 comparable units currently listed for rent nearby; 1,098 units permitted in Lorain County in 2024 (20 in 5+ unit buildings).
- This rent runs 38% of the median local income ($72k/yr) — at the standard rent-burdened threshold; future hikes will face affordability resistance.
Forward outlook
- Local home prices are declining (-3.0%/yr); year-one equity from $1k of loan paydown is wiped out by about $6k of value loss. Plan a longer hold.
- At projected returns (-3.0% appreciation + 3.0% rent growth), your $56k cash investment doubles in ~10 years — after that, you're playing with house money.
Negotiation context
- Only 8 days on market — expect competitive offers; lowballing is unlikely to land.
- 4 sale attempts since 7y ago with the ask held roughly flat each time — persistent listings suggest the price (not the market) is what's stuck; bring a comps-based counter.
Risks & watch-outs
- Climate carrying-cost: moderate flood risk — expect insurance premiums to compound above CPI over the hold.
Questions for the listing agent
- Built in 1970 — when were the roof, HVAC, electrical panel, plumbing, and water heater last replaced?
- Is there a deadline driving the sale (1031 exchange, divorce, estate, relocation)? That informs how much negotiation room exists.
- Schools are B-rated — typically a magnet for longer-tenancy family renters. What's the average tenant stay here, and is there a school-zone premium baked into asking?
- What's the average days-on-market for RENTAL listings here right now (not sales)? A rising rental-DOM trend means longer vacancies and softer asking-rent achievability than the comps imply.
- What's the recent tenant-quality profile in this submarket — average credit score on applications, eviction rate, late-payment / NSF rate, and stable-employment percentage? A property-management company in the area should have these aggregated.
- How much new for-sale + rental construction is in the pipeline within 1–3 miles? Heavy new supply typically softens prices + rents 12–24 months out; constrained supply supports both.
Investment metrics
- 1% rule
- 1.14% ✓
- Cap rate
- 9.78%
- Cash-on-cash
- 12.45%
- DSCR
- 1.55
- GRM
- 7.3
CMA / ARV
- ARV (on-the-fly)
- $216,706
- Comps found
- 6
Show comp detail 6 sales within ~0.75 mi
| Address | Dist | Beds/Ba | Sqft | Sold | Price | $/sf | Match |
|---|---|---|---|---|---|---|---|
| 4276 Ford Ln | 0.25mi | 2/2.0 | 1,383 (+3%) | 10mo | $290,000 | $210 | 71 |
| 267 Woodridge Rd | 0.70mi | 3/1.5 (+1) | 1,368 (+2%) | 6mo | $220,000 | $161 | 53 |
| 296 Fairfax Rd | 0.71mi | 3/1.0 (+1) | 1,339 (-0%) | 14mo | $169,900 | $127 | 50 |
| 291 Aldrich Rd | 0.61mi | 3/2.0 (+1) | 1,404 (+4%) | 9mo | $129,000 | $92 | 48 |
| S/L 062 Woodlands Dr | 0.50mi | 3/2.0 (+1) | 1,465 (+9%) | 15mo | $339,900 | $232 | 40 |
| 816 Vermilion Rd | 0.69mi | 2/2.0 | 1,472 (+9%) | 16mo | $199,900 | $136 | 35 |
Match score weights: distance 35% · size 25% · config 20% · recency 20%. Top-matched comps best support the ARV.
Projected returns pro-forma
-3.0% appreciation · 3.0% rent growth · sell at horizon
- IRR
- 2.1%
- Equity multiple
- 1.08×
- Total profit
- $4,536
- Equity at exit
- $29,806
- IRR
- 11.7%
- Equity multiple
- 1.92×
- Total profit
- $51,314
- Equity at exit
- $17,284
Cash invested: $55,972 (down + closing). Projections, not guarantees.
Landlord ↔ Tenant lean methodology
- Overall (STATE)
- 73 Landlord-Friendly
- State Ohio
- 73 Landlord-Friendly · R+6
- County
- — inherits STATE
- City
- — inherits STATE
ZIP-level market 44089
- Active inventory
- 142
- Price-to-rent
- 7.3×
Monthly cashflow live
- Estimated rent
- $2,274 medium interval (Pro) →
- Mortgage (P&I)
- −$1,048
- Tax from tax record
- −$84 /mo · $1,008/yr
- Insurance
- −$83
- HOA
- −$0
- Vacancy / Maint / Mgmt
- −$478
- Net cashflow
- $581
Break-even live
UW: 25.0% down · 7.5% · 30yr · 1.5% tax · 5.0% vac · 8.0% maint · 8.0% mgmt
Financing live
Cash to close
- Down payment
- $49,975
- Closing costs
- $5,997
- Reserves months
- —
- Total cash needed
- —
Loan-product check · same deal, 3 products live
Conventional
25% down · 7.5% · 30yr
- Down + closing
- —
- Monthly P&I
- —
- Monthly cashflow
- —
- DSCR
- —
- Eligible?
- —
Personal DTI + credit; lowest rate.
DSCR
20% down · 8.5% · 30yr
- Down + closing
- —
- Monthly P&I
- —
- Monthly cashflow
- —
- DSCR
- —
- Eligible?
- —
No personal income docs; deal must DSCR.
Hard money
10% down · 12.0% · 12mo
- Down + closing
- —
- Monthly P&I
- —
- Monthly cashflow
- —
- DSCR
- —
- Eligible?
- —
Short-term bridge; refi at stabilization.
Rent comps 1 comps
| Address | Beds | Baths | Sqft | Rent | $/sqft | DOM | Units | Dist |
|---|---|---|---|---|---|---|---|---|
| 1041 Dogwood Ln Vermilion, OH | 2.0 | 2.0 | 1457 | $2,274 | $1.56 | 1d | 12 | 0.53mi |
Listing history 6 events
-
2026-06-18days on market $199,900 Active 8 DOM
-
2026-06-17days on market $199,900 Active 7 DOM
-
2026-06-16days on market $199,900 Active 6 DOM
-
2026-06-15days on market $199,900 Active 5 DOM
-
2026-06-13remarks 699-char remark
-
2026-06-13$199,900 Active 3 DOM
ⓘ Source: listings_history table (triggers on properties + properties_extension) + one-shot
backfill from property_details.listing_events for pre-trigger history.
Tax reassessment forecast OH · Partial reset (capped growth)
- Current annual tax
- $1,008 · $84/mo
- Projected year-2 tax
- $2,063 · $172/mo
- Expected delta
- +$1,055/yr (+$88/mo · 104.7%)
ⓘ Screening estimate from a state-policy table — verify with the county assessor before closing.
Climate risk First Street
- Flood 5/10 Major FEMA zone X (unshaded) · 47% chance over 30 yrs
- Wildfire 1/10 Low
- Heat 3/10 Moderate 7 d/yr ≥96°F today · 17 d/yr by 30 yrs out
- Wind 1/10 Low
- Air quality 3/10 Moderate 2 unhealthy d/yr today · 3 by 30 yrs out
Nearby sold comps map
Loading sold comps map…
Walkable amenities ~0.75 mi
Loading nearby amenities…
Taxation est. · year 1
- Rental income
- $27,288
- − Mortgage interest
- −$11,198
- − Property taxes
- −$1,008
- − Insurance
- −$1,000
- − Repairs & maintenance
- −$2,183
- − Management
- −$2,183
- − Depreciation
- −$5,815
- Taxable income
- $3,902
- Est. tax owed @ 24.0%
- −$936
- After-tax cash flow
- $6,034/yr
For passive investors: Depreciation is non-cash, so a rental often shows a tax loss while cash-flowing — sheltering income. Rental losses are passive: they offset passive income freely, and up to $25,000/yr can offset ordinary (W-2) income if you actively participate and your MAGI is under $100k (phasing out to $0 by $150k); unused losses carry forward. On sale, claimed depreciation is recaptured at up to 25%, and gains may owe capital-gains tax (a 1031 exchange can defer both). Figures are a year-1 estimate at your 24.0% rate — not tax advice; consult a CPA.
Schools (NCES district)
- District
- Vermilion Local
- NCES district ID
- 3904682
- Math proficiency
- 56% ▼ -13.00%
- Reading proficiency
- 60% ▼ -5.00%
- Median HH income
- $52,091
- Composite
- 49.61/100
- National rank
- #1981
- State rank
- #316 of 656 in OH
Livability — Vermilion
- Score
- 81/100
- State rank
- #96
- US rank
- #1481
Category grades
Schools grade is shown separately in the Schools card above.
Census & demographics
- Census place
- Vermilion, OH
- County
- Erie · 78,232 people
- Metro
- Sandusky, OH
- Population (ZIP)
- 15,873
- Household income
- $72,045
- Rent vs Own
- Severe rent burden
- 5.8
Population outlook (Lorain County) Hauer SSP2
- Today (2025)
- 314,924 people
- By 2030
- 317,546 · +0.8%
- By 2040
- 317,962 · +1.0%
- By 2050
- 312,872 · -0.7%
- By 2075
- 301,806 · -4.2%
- By 2100
- 278,271 · -11.6%
Race, ethnicity, and origin ACS 2023
- Neighborhood character
- Predominantly White (93%)
- Race & ethnicity
- White 93% Hispanic / Latino 4% Two or more races 3%
- Common ancestry
- Romanian 7% Lithuanian 4% Slovak 2%
- Foreign-born
- 1%
- Languages at home
- 98% English-only · Other Indo-European 1%
Political lean MEDSL · Lorain
- 2024 margin
- Lean R (+5.7) · D 46.7% · R 52.4%
- 2008→2024 swing
- -23.6pp toward R · 2008: 17.9pp · 2024: -5.7pp
- All cycles
- 2024: R+5.7 2020: R+2.5 2016: R+0.3 2012: D+14.4 2008: D+17.9
Not yet ingested
- Civics
- —
Market trends
- HPI YoY
- ▼ -122.76%
- Current HPI
- 206.8223
- Rent YoY
- —
- Metro
- —
- State GDP YoY
- ▲ 1.98%
- F500 in state
- 48
Industry mix (Fortune 500 HQ in OH)
| Industry | F500 HQs | Revenue |
|---|---|---|
| Insurance | 3 | $145B |
|
||
| Industrial Machinery | 3 | $49B |
|
||
| Financial Services | 3 | $24B |
|
||
| Consumer Goods | 2 | $93B |
|
||
| Aerospace / Defense | 2 | $47B |
|
||
| Utilities | 2 | $33B |
|
||
Price history
+146.8% since first listed6 events — show timeline
- 2026-06-10 Listed $199,900 MLSNOW
- 2026-06-08 Listed $199,900 FAOR
- 2025-08-01 Listing Removed — MLSNOW
- 2025-05-01 Listed $209,900 MLSNOW
- 2019-06-19 Listing Removed — MLSNOW
- 2019-06-11 Listed $81,000 MLSNOW
Property tax history
+0.3%/yrLatest (2025): $1,008 · -36.1% YoY. Source: county tax records.
Cash-flow waterfall
monthlySold comps — $/sqft
last 12 mo · ≤1 miLoading sold comps…