4700 SW Tribe St · Bentonville, AR
Flood risk No data
- FEMA flood zone
- —
- Chance of flooding over 30 yrs
- —
- Est. flood insurance / yr
- —
Fire risk No data
- Est. fire insurance / yr
- —
Heat risk No data
- Hot days now (above threshold)
- —
- Hot days in 30 yrs
- —
Wind risk No data
- Chance of severe wind over 30 yrs
- —
Air-quality risk No data
- Unhealthy air days now
- —
- Unhealthy air days in 30 yrs
- —
Risk factors via First Street. Map © Google.
Why this score? — see what drove the D- grade
The composite is a weighted blend of 9 inputs, each scored 0–100. Each bar is that input's sub-score; the figure is the points it added to the 100-point composite (weight × sub-score).
- Appreciation +10.0/10.0
- ARV discount +7.5/15.0
- Cash flow +6.6/30.0
- Schools +5.2/10.0
- Livability +4.2/5.0
- Rent growth +2.6/5.0
- Condition / age +2.5/5.0
- DSCR +0.8/10.0
- 1% rule +0.4/10.0
$392,500
🖨 Deal sheet 📄 Offer letter ✓ Due diligence
Listing remarks
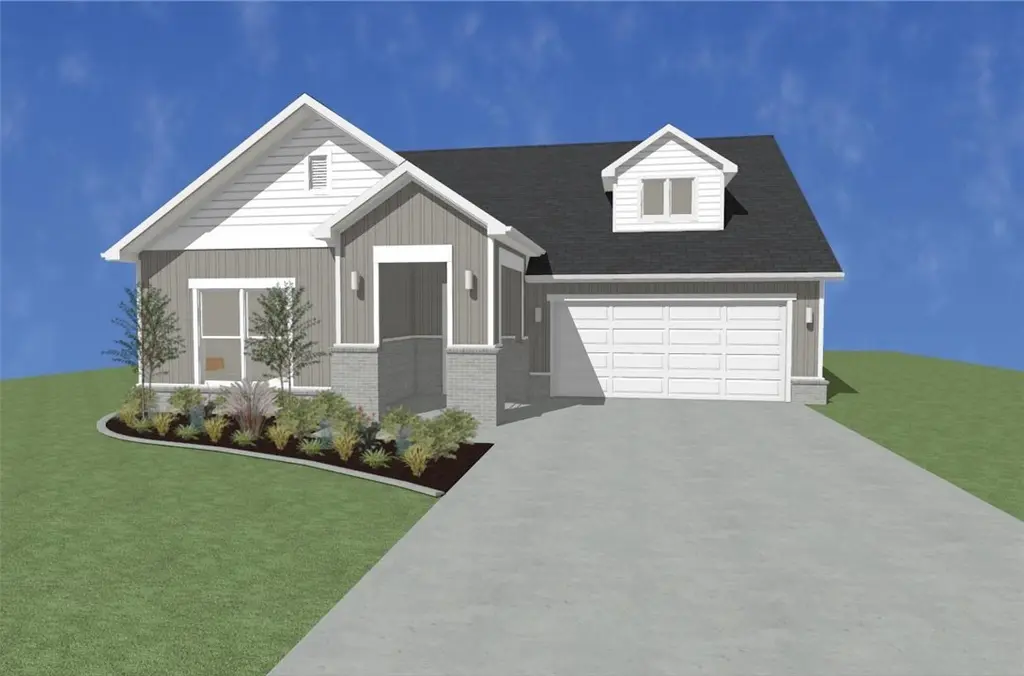
Sold before print- Emmet plan.
Key facts
- 6,098 sq ft lot
- Garage
- Built 2026
Neighborhood map
What this means for you Summary
Snapshot
- This is a 4-bed/3.0-bath land listed at $392k.
Deal economics
- At list price, monthly cash flow is $-654 ($-8k/yr) — negative.
- To cash-flow at today's rent, offer at most $277k (29.4% below list).
- To meet the 1% rule (rent ≥ 1% of price), the offer needs to be $210k (46.4% below list).
- Recommended offer: $210k (46.4% below list) — sets the bar for 1% rule.
- Cap rate 4.3% vs local median 2.6% in Bentonville — top-decile yield for the area; either an underpriced asset or a hidden risk that comps aren't pricing in. Stress-test before assuming the spread holds.
Location & tenants
- Location reads 83/100 on livability (#2 in AR, #864 nationally) — a professional / high-income tenant draw. Strengths: employment A+, housing A+, health & safety A+; Watch: amenities F.
- Bentonville School District (urban): math 59% / reading 59% proficiency, ranked #3 of 238 in AR (top 1%) — acceptable for families but not a draw, mixed tenant base, ~2y average lease.
- Market conditions: Rents flat; 690 active listings in the ZIP; 16 comparable units currently listed for rent nearby; rentals at typical pace (median 24d on market — plan ~3-4 weeks tenant-placement turnaround); high-income renter base; 4,359 units permitted in Benton County in 2024 (402 in 5+ unit buildings).
Forward outlook
- In year one you build about $42k of equity ($3k loan paydown + $39k appreciation (10.0% local appreciation)).
- Benton County population projected at +56% by 2050 — long-run rental-demand tailwind backs the buy-and-hold thesis.
- By year 2, paydown + projected appreciation supports a ~$67k cash-out refi (75% LTV) — recoverable capital for the next deal without selling this one.
Negotiation context
- Only 0 days on market — expect competitive offers; lowballing is unlikely to land.
Questions for the listing agent
- What do current leases actually rent for vs. the listed asking? Can we see a recent rent roll and the last 12 months of T-12 income?
- What does the HOA fee cover, when was the last increase, and are there any pending special assessments or reserve-fund shortfalls?
- Is there a deadline driving the sale (1031 exchange, divorce, estate, relocation)? That informs how much negotiation room exists.
- Schools are A-rated — typically a magnet for longer-tenancy family renters. What's the average tenant stay here, and is there a school-zone premium baked into asking?
- The area grade is low — what's the realistic commute time and amenity access for the typical tenant pool here? Any planned neighborhood developments (good or bad) we should know about?
- What's the average days-on-market for RENTAL listings here right now (not sales)? A rising rental-DOM trend means longer vacancies and softer asking-rent achievability than the comps imply.
- What's the recent tenant-quality profile in this submarket — average credit score on applications, eviction rate, late-payment / NSF rate, and stable-employment percentage? A property-management company in the area should have these aggregated.
- How much new for-sale + rental construction is in the pipeline within 1–3 miles? Heavy new supply typically softens prices + rents 12–24 months out; constrained supply supports both.
Investment metrics
- 1% rule
- 0.54% ✗
- Cap rate
- 4.29%
- Cash-on-cash
- -7.14%
- DSCR
- 0.68
- GRM
- 15.5
CMA / ARV
No comps found within radius.
Projected returns pro-forma
10.0% appreciation · 0.39% rent growth · sell at horizon
- IRR
- 18.7%
- Equity multiple
- 2.52×
- Total profit
- $166,543
- Equity at exit
- $353,595
- IRR
- 17.0%
- Equity multiple
- 5.67×
- Total profit
- $512,952
- Equity at exit
- $762,541
Cash invested: $109,900 (down + closing). Projections, not guarantees.
Landlord ↔ Tenant lean methodology
- Overall (STATE)
- 92 Strongly Landlord-Friendly
- State Arkansas
- 92 Strongly Landlord-Friendly · R+14
- County
- — inherits STATE
- City
- — inherits STATE
ZIP-level market 72713
- Home prices YoY
- 3.5%
- Rents YoY
- 0.4%
- Active inventory
- 690
- Price-to-rent
- 15.5×
Monthly cashflow live
- Estimated rent
- $2,104 high interval (Pro) →
- Mortgage (P&I)
- −$2,058
- Tax from tax record
- −$81 /mo · $967/yr
- Insurance
- −$164
- HOA
- −$13
- Vacancy / Maint / Mgmt
- −$442
- Net cashflow
- $-654
Break-even live
UW: 25.0% down · 7.5% · 30yr · 1.5% tax · 5.0% vac · 8.0% maint · 8.0% mgmt
Financing live
Cash to close
- Down payment
- $98,125
- Closing costs
- $11,775
- Reserves months
- —
- Total cash needed
- —
Loan-product check · same deal, 3 products live
Conventional
25% down · 7.5% · 30yr
- Down + closing
- —
- Monthly P&I
- —
- Monthly cashflow
- —
- DSCR
- —
- Eligible?
- —
Personal DTI + credit; lowest rate.
DSCR
20% down · 8.5% · 30yr
- Down + closing
- —
- Monthly P&I
- —
- Monthly cashflow
- —
- DSCR
- —
- Eligible?
- —
No personal income docs; deal must DSCR.
Hard money
10% down · 12.0% · 12mo
- Down + closing
- —
- Monthly P&I
- —
- Monthly cashflow
- —
- DSCR
- —
- Eligible?
- —
Short-term bridge; refi at stabilization.
Rent comps 16 comps
| Address | Beds | Baths | Sqft | Rent | $/sqft | DOM | Units | Dist |
|---|---|---|---|---|---|---|---|---|
| 6000 SW Desert Ave Bentonville, AR | 3.0 | 2.0 | 1669 | $2,050 | $1.23 | 14d | 1 | 0.08mi |
| 5809 SW Macasin Ave Bentonville, AR | 4.0 | 2.0 | 1745 | $2,100 | $1.20 | 23d | 1 | 0.26mi |
| 4301 SW Pawhuska St Bentonville, AR | 3.0 | 2.0 | 1782 | $1,980 | $1.11 | 23d | 1 | 0.31mi |
| 5805 SW Teppee Ave Bentonville, AR | 4.0 | 2.5 | 1854 | $2,145 | $1.16 | 23d | 1 | 0.36mi |
| 3401 SW Endearment St Bentonville, AR | 4.0 | 2.5 | 2065 | $2,000 | $0.97 | 23d | 1 | 0.90mi |
| 6812 Memphis Bentonville, AR | 3.0 | 2.5 | 1599 | $1,550 | $0.97 | 23d | 1 | 0.92mi |
| 6604 SW Dignity Ave Bentonville, AR | 3.0 | 3.0 | 1430 | $1,550 | $1.08 | 14d | 1 | 0.93mi |
| 221 Williams Ct Bentonville, AR | 3.0 | 2.0 | 1410 | $1,725 | $1.22 | 23d | 1 | 0.99mi |
| 621-623 Cosmos St Centerton, AR | 3.0 | 2.0 | 1475 | $1,795 | $1.22 | 14d | 1 | 1.00mi |
| 6800 SW Dignity Ave Bentonville, AR | 3.0 | 2.5 | 1599 | $1,895 | $1.19 | 14d | 1 | 1.00mi |
| 6802 SW Dignity Ave Bentonville, AR | 3.0 | 2.5 | 1599 | $1,895 | $1.19 | 23d | 1 | 1.01mi |
| 231 Palm St Bentonville, AR | 3.0 | 2.0 | 1828 | $2,050 | $1.12 | 23d | 1 | 1.17mi |
| 3406 SW Lucretia Rd Bentonville, AR | 4.0 | 3.0 | 2393 | $2,800 | $1.17 | 23d | 1 | 1.27mi |
| 6708 SW Shady Rd Bentonville, AR | 4.0 | 2.0 | 1500 | $1,800 | $1.20 | 23d | 1 | 1.32mi |
| 3600 SW Willowbrook Rd Bentonville, AR | 4.0 | 3.0 | 2612 | $2,600 | $1.00 | 23d | 1 | 1.39mi |
| 3800 SW Mistletoe Ave Unit 1221819P Bentonville, AR | 3.0 | 2.0 | 1593 | $5,861 | $3.68 | 14d | 1 | 1.46mi |
HOA detail
- Monthly dues
- $13 · $156/yr
Listing history 2 events
-
2026-04-20$392,500
-
2026-04-20historical
ⓘ Source: listings_history table (triggers on properties + properties_extension) + one-shot
backfill from property_details.listing_events for pre-trigger history.
Tax reassessment forecast AR · Resets to sale price
- Current annual tax
- $967 · $81/mo
- Projected year-2 tax
- $2,512 · $209/mo
- Expected delta
- +$1,545/yr (+$129/mo · 159.7%)
ⓘ Screening estimate from a state-policy table — verify with the county assessor before closing.
Nearby sold comps map
Loading sold comps map…
Walkable amenities ~0.75 mi
Loading nearby amenities…
Taxation est. · year 1
- Rental income
- $25,244
- − Mortgage interest
- −$21,986
- − Property taxes
- −$967
- − Insurance
- −$1,962
- − Repairs & maintenance
- −$2,019
- − Management
- −$2,019
- − HOA
- −$156
- − Depreciation
- −$11,418
- Taxable loss
- −$15,285
- Est. tax savings @ 24.0%
- +$3,668
- After-tax cash flow
- $-4,174/yr
For passive investors: Depreciation is non-cash, so a rental often shows a tax loss while cash-flowing — sheltering income. Rental losses are passive: they offset passive income freely, and up to $25,000/yr can offset ordinary (W-2) income if you actively participate and your MAGI is under $100k (phasing out to $0 by $150k); unused losses carry forward. On sale, claimed depreciation is recaptured at up to 25%, and gains may owe capital-gains tax (a 1031 exchange can defer both). Figures are a year-1 estimate at your 24.0% rate — not tax advice; consult a CPA.
Schools (NCES district)
- District
- Bentonville School District
- NCES district ID
- 0503060
- Math proficiency
- 59% ▼ -8.00%
- Reading proficiency
- 59% ▼ -6.00%
- Median HH income
- $66,721
- Composite
- 51.85/100
- National rank
- #1661
- State rank
- #3 of 238 in AR
Livability — Bentonville
- Score
- 83/100
- State rank
- #2
- US rank
- #864
Category grades
Schools grade is shown separately in the Schools card above.
Census & demographics
- Census place
- Bentonville, AR
- County
- Benton County · 259,241 people
- City population
- 67,689
- Metro
- Fayetteville-Springdale-Rogers, AR
- Population (ZIP)
- 28,999
- Household income
- $119,853
- Rent vs Own
- Severe rent burden
- 508.0
Population outlook (Benton County) Hauer SSP2
- Today (2025)
- 318,683 people
- By 2030
- 353,481 · +10.9%
- By 2040
- 425,280 · +33.4%
- By 2050
- 497,239 · +56.0%
- By 2075
- 662,114 · +107.8%
- By 2100
- 776,431 · +143.6%
Race, ethnicity, and origin ACS 2023
- Neighborhood character
- Diverse neighborhood (Simpson 0.66)
- Race & ethnicity
- White 54% Asian 20% Two or more races 16% Hispanic / Latino 11% Black 3%
- Hispanic origin (detail)
- Mexican 8%
- Common ancestry
- Italian 2% Slovak 2% Romanian 1%
- Foreign-born
- 22% · Canada, China, Vietnam
- Languages at home
- 79% English-only · Other Asian/Pacific 8% Spanish 6% Other Indo-European 5%
Political lean MEDSL · Benton
- 2024 margin
- Strong R (+27.0) · D 35.2% · R 62.1% · Other 2.7%
- 2008→2024 swing
- +9.6pp toward D · 2008: -36.5pp · 2024: -27.0pp
- All cycles
- 2024: R+27.0 2020: R+26.4 2016: R+34.9 2012: R+40.4 2008: R+36.5
Not yet ingested
- Civics
- —
Market trends
- HPI YoY
- ▲ 10.77%
- Current HPI
- 319.3081
- Rent YoY
- ▲ 0.39%
- Metro
- Fayetteville-Springdale-Rogers, AR
- State GDP YoY
- ▲ 3.80%
- F500 in state
- 10
Industry mix (Fortune 500 HQ in AR)
| Industry | F500 HQs | Revenue |
|---|---|---|
| Retail | 1 | $681B |
|
||
| Food / Agriculture | 1 | $53B |
|
||
| Retail / Energy | 1 | $22B |
|
||
| Transportation / Logistics | 1 | $12B |
|
||
| Energy | 1 | $4B |
|
||
Price history
2 events — show timeline
- 2026-04-20 Delisted — NWARMLS
- 2026-04-20 Listed $392,500 NWARMLS
Cash-flow waterfall
monthlySold comps — $/sqft
last 12 mo · ≤1 miLoading sold comps…