 Multi-family
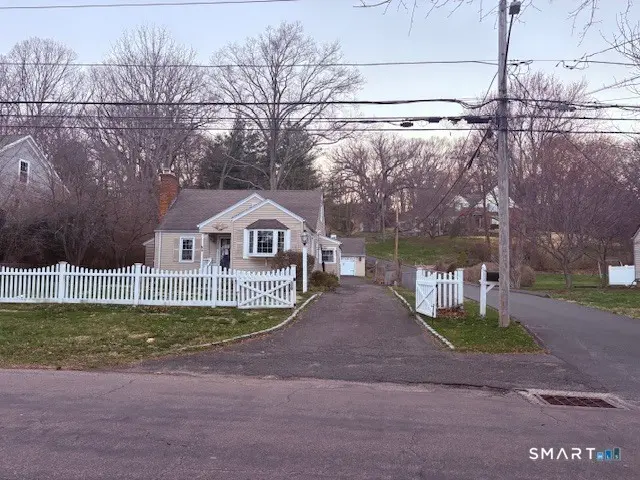
329 Bronson Rd · Southport, CT
Flood risk 1/10 · Minimal
- FEMA flood zone
- X (unshaded)
- Chance of flooding over 30 yrs
- 0.0%
- Est. flood insurance / yr
- $507 – $1,088
Fire risk 1/10 · Minimal
- Est. fire insurance / yr
- $829 – $1,539
Heat risk 6/10 · Moderate
- Hot days now (above 98°F)
- 7 days/yr
- Hot days in 30 yrs
- 15 days/yr
Wind risk 6/10 · Moderate
- Chance of severe wind over 30 yrs
- 67.0%
Air-quality risk 8/10 · Major
- Unhealthy air days now
- 13 days/yr
- Unhealthy air days in 30 yrs
- 18 days/yr
Risk factors via First Street. Map © Google.
Why this score? — see what drove the C+ grade
The composite is a weighted blend of 9 inputs, each scored 0–100. Each bar is that input's sub-score; the figure is the points it added to the 100-point composite (weight × sub-score).
- Cash flow +20.8/30.0
- ARV discount +15.0/15.0
- DSCR +6.6/10.0
- Schools +6.3/10.0
- 1% rule +5.6/10.0
- Livability +4.0/5.0
- Rent growth +2.5/5.0
- Condition / age +2.5/5.0
- Appreciation +0.0/10.0
$675,000
🖨 Deal sheet 📄 Offer letter ✓ Due diligence
Multi-family units
County records classify this as Multi-Family (2-4 Unit). Listing-text estimate: 1 unit. estimate disagrees with records
Listing remarks
Reduced!! Location, location and Location! Here is a chance to build some sweet equity that you have been waiting for! With 4 Bedrooms and 3 full bathrooms there is room for all. Living room with a fireplace along with two additional sitting room to accommodate all your guests. Partially fenced in yard, detached garage. Central air, gas heat, tankless hot water heater , 2 car detached garage, drive way long enough to accommodate all your cars and much more. Connecticut Choice Realty LLC and Raine company makes no representing of the condition of the home and the MLS information supplied. Please do your diligence. Please visit www. Hudhomestore.com and follow the directions to make an offer.
Key facts
- Gas heat
- Central air
- Detached garage
Tags
Neighborhood map
What this means for you Summary
Snapshot
- This is a 4-bed/3.0-bath multifamily listed at $675k.
Deal economics
- At list price, monthly cash flow is $927 ($11k/yr) — positive.
- The deal already cash-flows at list — no discount required.
- Meets the 1% rule at list price ($7k rent vs $675k).
Location & tenants
- Location reads 81/100 on livability (#22 in CT, #1,590 nationally) — a professional / high-income tenant draw. Strengths: crime A+, employment A+, housing A+; Watch: commute C-, amenities F, cost of living F.
- Fairfield School District (suburban): math 61% / reading 72% proficiency, ranked #21 of 153 in CT (top 14%) — acceptable for families but not a draw, mixed tenant base, ~2y average lease; only 7% free/reduced lunch — higher-income household profile.
- Zoned schools: Mill Hill School (math 67% / reading 77%, grade A-, #62 of 553 statewide, top 13%, 404 students, 10% FRL); Fairfield Ludlowe High School (math 69% / reading 85%, grade A-, #9 of 194 statewide, top 4%, 1,498 students, 15% FRL).
- Market conditions: 28 active listings in the ZIP; 10 comparable units currently listed for rent nearby; rentals lingering (median 44d on market — plan ~5-8 weeks vacancy on turnover, expect pricing pressure); 50% of comp listings sitting > 30 days — soft ceiling on asking rent; 852 units permitted in Greater Bridgeport Planning Region in 2024 (698 in 5+ unit buildings).
Forward outlook
- Local home prices are declining (-3.0%/yr); year-one equity from $5k of loan paydown is wiped out by about $20k of value loss. Plan a longer hold.
Negotiation context
- Only 8 days on market — expect competitive offers; lowballing is unlikely to land.
- 4 sale attempts; this cycle's ask has dropped $70k (9%) from the opening price — seller is motivated, your offer sets the floor, not the list.
Risks & watch-outs
- Watch-outs: built in 1946 — expect roof / HVAC / electrical / plumbing capex.
- Climate carrying-cost: major wind risk, 67% chance of damaging wind over 30y; extreme-heat days projected 7→15/yr by 2055 (HVAC capex compounding) — expect insurance premiums to compound above CPI over the hold.
Questions for the listing agent
- Built in 1946 — when were the roof, HVAC, electrical panel, plumbing, and water heater last replaced?
- Is there a deadline driving the sale (1031 exchange, divorce, estate, relocation)? That informs how much negotiation room exists.
- Schools are A-rated — typically a magnet for longer-tenancy family renters. What's the average tenant stay here, and is there a school-zone premium baked into asking?
- What's the average days-on-market for RENTAL listings here right now (not sales)? A rising rental-DOM trend means longer vacancies and softer asking-rent achievability than the comps imply.
- What's the recent tenant-quality profile in this submarket — average credit score on applications, eviction rate, late-payment / NSF rate, and stable-employment percentage? A property-management company in the area should have these aggregated.
- How much new apartment / multifamily construction is in the pipeline within 1–3 miles? Heavy new supply (>2% of stock underway) typically softens rents 12–24 months out; light construction supports rent growth.
Investment metrics
- 1% rule
- 1.06% ✓
- Cap rate
- 7.94%
- Cash-on-cash
- 5.89%
- DSCR
- 1.26
- GRM
- 7.8
CMA / ARV
- ARV (on-the-fly)
- $964,224
- Comps found
- 2
Show comp detail 2 sales within ~0.75 mi
| Address | Dist | Beds/Ba | Sqft | Sold | Price | $/sf | Match |
|---|---|---|---|---|---|---|---|
| 43 Helen St | 0.65mi | 4/2.0 | 1,890 (-5%) | 5mo | $728,888 | $386 | 54 |
| 209 S Pine Creek Rd | 0.60mi | 3/2.0 (-1) | 2,059 (+4%) | 4mo | $1,000,000 | $486 | 53 |
Match score weights: distance 35% · size 25% · config 20% · recency 20%. Top-matched comps best support the ARV.
Projected returns pro-forma
-3.0% appreciation · 3.0% rent growth · sell at horizon
- IRR
- -7.2%
- Equity multiple
- 0.73×
- Total profit
- $-50,158
- Equity at exit
- $100,645
- IRR
- 2.4%
- Equity multiple
- 1.17×
- Total profit
- $33,021
- Equity at exit
- $58,362
Cash invested: $189,000 (down + closing). Projections, not guarantees.
Landlord ↔ Tenant lean methodology
- Overall (STATE)
- 27 Tenant-Leaning
- State Connecticut
- 27 Tenant-Leaning · D+7
- County
- — inherits STATE
- City
- — inherits STATE
ZIP-level market 06890
- Active inventory
- 28
- Price-to-rent
- 7.8×
Monthly cashflow live
- Estimated rent
- $7,183 high interval (Pro) →
- Mortgage (P&I)
- −$3,540
- Tax from tax record
- −$926 /mo · $11,117/yr
- Insurance
- −$281
- HOA
- −$0
- Vacancy / Maint / Mgmt
- −$1,508
- Net cashflow
- $927
Break-even live
UW: 25.0% down · 7.5% · 30yr · 1.5% tax · 5.0% vac · 8.0% maint · 8.0% mgmt
Financing live
Cash to close
- Down payment
- $168,750
- Closing costs
- $20,250
- Reserves months
- —
- Total cash needed
- —
Loan-product check · same deal, 3 products live
Conventional
25% down · 7.5% · 30yr
- Down + closing
- —
- Monthly P&I
- —
- Monthly cashflow
- —
- DSCR
- —
- Eligible?
- —
Personal DTI + credit; lowest rate.
DSCR
20% down · 8.5% · 30yr
- Down + closing
- —
- Monthly P&I
- —
- Monthly cashflow
- —
- DSCR
- —
- Eligible?
- —
No personal income docs; deal must DSCR.
Hard money
10% down · 12.0% · 12mo
- Down + closing
- —
- Monthly P&I
- —
- Monthly cashflow
- —
- DSCR
- —
- Eligible?
- —
Short-term bridge; refi at stabilization.
Rent comps 10 comps
| Address | Beds | Baths | Sqft | Rent | $/sqft | DOM | Units | Dist |
|---|---|---|---|---|---|---|---|---|
| 20 Chelsea St Fairfield, CT | 4.0 | 2.5 | 2518 | $7,500 | $2.98 | 43d | 1 | 0.29mi |
| 798 Mill Plain Rd Fairfield, CT | 3.0 | 1.5 | 1894 | $6,000 | $3.17 | 23d | 1 | 0.72mi |
| 860 Oldfield Rd Fairfield, CT | 3.0 | 2.5 | 2150 | $6,000 | $2.79 | 43d | 1 | 0.90mi |
| 427 Westford Dr Southport, CT | 3.0 | 2.0 | 1280 | $4,800 | $3.75 | 10d | 1 | 1.08mi |
| 46 Parkway Fairfield, CT | 3.0 | 2.0 | 1831 | $5,450 | $2.98 | 14d | 1 | 1.10mi |
| 146 Oxford Rd Southport, CT | 3.0 | 2.5 | 1792 | $8,850 | $4.94 | 2d | 1 | 1.12mi |
| 447 Reef Rd Fairfield, CT | 3.0 | 2.5 | 1972 | $8,000 | $4.06 | 43d | 1 | 1.31mi |
| 503 Reef Rd Fairfield, CT | 5.0 | 2.5 | 1632 | $18,000 | $11.03 | 43d | 1 | 1.36mi |
| 510 Reef Rd Fairfield, CT | 3.0 | 1.5 | 1908 | $12,000 | $6.29 | 23d | 1 | 1.36mi |
| 27 Reef Ct Fairfield, CT | 4.0 | 1.0 | 1267 | $6,000 | $4.74 | 43d | 1 | 1.42mi |
Listing history 9 events
-
2026-04-07status Under Contract
-
2026-04-07price $675,000
-
2026-03-30historical
-
2026-03-30status Active
-
2026-03-30$745,000 Active
-
2026-03-04status Under Contract
-
2026-02-25status Active
-
2026-02-14status Under Contract
-
2026-02-04$745,000 Active
ⓘ Source: listings_history table (triggers on properties + properties_extension) + one-shot
backfill from property_details.listing_events for pre-trigger history.
Tax reassessment forecast CT · Partial reset (capped growth)
- Current annual tax
- $11,117 · $926/mo
- Projected year-2 tax
- $12,781 · $1,065/mo
- Expected delta
- +$1,664/yr (+$139/mo · 15.0%)
ⓘ Screening estimate from a state-policy table — verify with the county assessor before closing.
Climate risk First Street
- Flood 1/10 Low FEMA zone X (unshaded) · 0% chance over 30 yrs
- Wildfire 1/10 Low
- Heat 6/10 Major 7 d/yr ≥98°F today · 15 d/yr by 30 yrs out
- Wind 6/10 Major 67% chance of damaging wind over 30 yrs
- Air quality 8/10 Severe 13 unhealthy d/yr today · 18 by 30 yrs out
Nearby sold comps map
Loading sold comps map…
Walkable amenities ~0.75 mi
Loading nearby amenities…
Taxation est. · year 1
- Rental income
- $86,199
- − Mortgage interest
- −$37,810
- − Property taxes
- −$11,117
- − Insurance
- −$3,375
- − Repairs & maintenance
- −$6,896
- − Management
- −$6,896
- − Depreciation
- −$19,636
- Taxable income
- $468
- Est. tax owed @ 24.0%
- −$112
- After-tax cash flow
- $11,015/yr
For passive investors: Depreciation is non-cash, so a rental often shows a tax loss while cash-flowing — sheltering income. Rental losses are passive: they offset passive income freely, and up to $25,000/yr can offset ordinary (W-2) income if you actively participate and your MAGI is under $100k (phasing out to $0 by $150k); unused losses carry forward. On sale, claimed depreciation is recaptured at up to 25%, and gains may owe capital-gains tax (a 1031 exchange can defer both). Figures are a year-1 estimate at your 24.0% rate — not tax advice; consult a CPA.
Schools (NCES district)
- District
- Fairfield School District
- NCES district ID
- 0901530
- Math proficiency
- 61% ▼ -10.00%
- Reading proficiency
- 72% ▼ -7.00%
- Median HH income
- $119,139
- Composite
- 63.03/100
- National rank
- #650
- State rank
- #21 of 153 in CT
Livability — Southport
- Score
- 81/100
- State rank
- #22
- US rank
- #1590
Category grades
Schools grade is shown separately in the Schools card above.
Census & demographics
- Population (ZIP)
- 4,566
Population outlook (Greater Bridgeport County) Hauer SSP2
- By 2040
- 365,581
Race, ethnicity, and origin ACS 2023
- Neighborhood character
- Predominantly White (89%)
- Race & ethnicity
- White 89% Asian 5% Two or more races 5% Hispanic / Latino 4%
- Common ancestry
- Romanian 6% Slovak 5% Lithuanian 2%
- Foreign-born
- 8% · Canada, Dominican Republic
- Languages at home
- 90% English-only · Other Indo-European 5% Spanish 3% Russian/Polish/Slavic 1%
Political lean MEDSL · Greater Bridgeport
- 2024 margin
- Strong D (+23.3) · D 60.9% · R 37.6% · Other 1.5%
- All cycles
- 2024: D+23.3
Not yet ingested
- Civics
- —
Market trends
- HPI YoY
- ▼ -103.54%
- Current HPI
- 188.7723
- Rent YoY
- —
- Metro
- —
- State GDP YoY
- ▲ 1.06%
- F500 in state
- 38
Industry mix (Fortune 500 HQ in CT)
| Industry | F500 HQs | Revenue |
|---|---|---|
| Industrial Machinery | 4 | $38B |
|
||
| Insurance | 3 | $71B |
|
||
| Financial Services | 2 | $25B |
|
||
| Transportation / Logistics | 2 | $18B |
|
||
| Healthcare | 1 | $247B |
|
||
| Telecommunications | 1 | $55B |
|
||
Price history
-9.4% since first listed9 events — show timeline
- 2026-04-07 Pending — Smart MLS
- 2026-04-07 Price Changed $675,000 Smart MLS
- 2026-03-30 Listing Removed — Smart MLS
- 2026-03-30 Relisted — Smart MLS
- 2026-03-30 Listed $745,000 Smart MLS
- 2026-03-04 Pending — Smart MLS
- 2026-02-25 Relisted — Smart MLS
- 2026-02-14 Pending — Smart MLS
- 2026-02-04 Listed $745,000 Smart MLS
Property tax history
+1.5%/yrLatest (2023): $11,117 · +1.0% YoY. Source: county tax records.
Cash-flow waterfall
monthlySold comps — $/sqft
last 12 mo · ≤1 miLoading sold comps…