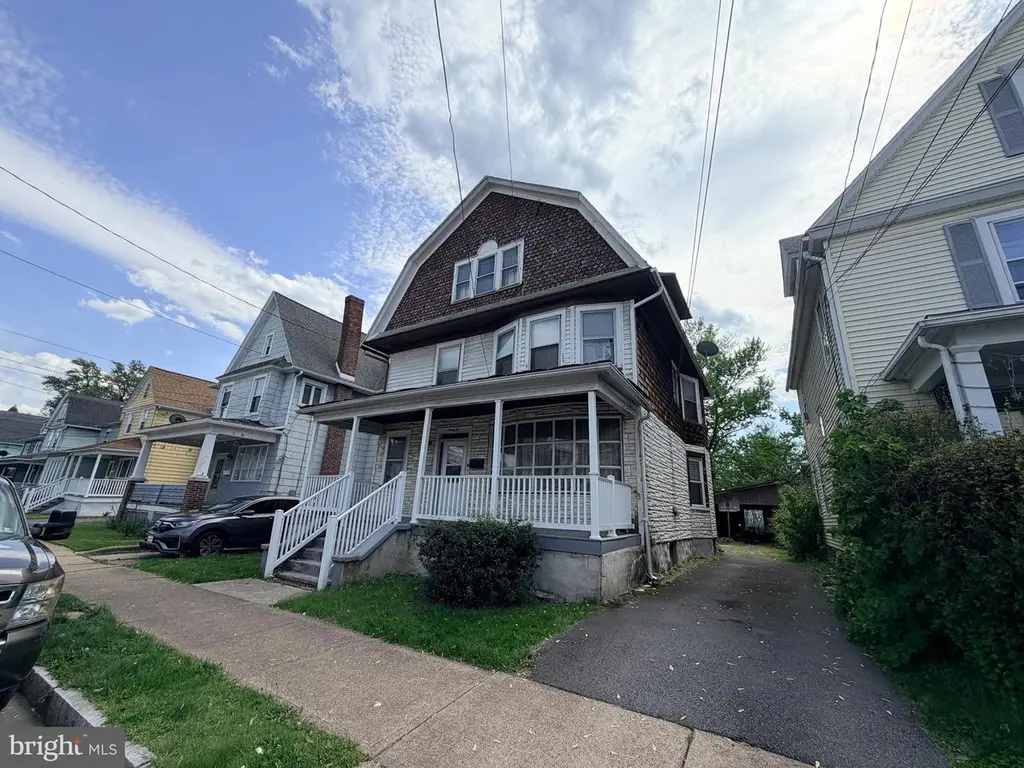
92 Elizabeth St · Wilkes-Barre, PA
Flood risk 6/10 · Moderate
- FEMA flood zone
- X
- Chance of flooding over 30 yrs
- 0.27%
- Est. flood insurance / yr
- $507 – $1,088
Fire risk 3/10 · Minor
- Est. fire insurance / yr
- $511 – $949
Heat risk 4/10 · Minor
- Hot days now (above 97°F)
- 7 days/yr
- Hot days in 30 yrs
- 16 days/yr
Wind risk 3/10 · Minor
- Chance of severe wind over 30 yrs
- 5.0%
Air-quality risk 2/10 · Minimal
- Unhealthy air days now
- 1 days/yr
- Unhealthy air days in 30 yrs
- 2 days/yr
Risk factors via First Street. Map © Google.
Why this score? — see what drove the B+ grade
The composite is a weighted blend of 9 inputs, each scored 0–100. Each bar is that input's sub-score; the figure is the points it added to the 100-point composite (weight × sub-score).
- Cash flow +30.0/30.0
- ARV discount +15.0/15.0
- 1% rule +10.0/10.0
- DSCR +10.0/10.0
- Rent growth +4.2/5.0
- Livability +2.5/5.0
- Condition / age +2.5/5.0
- Schools +2.1/10.0
- Appreciation +0.0/10.0
$158,500
🖨 Deal sheet (PDF) 📄 Offer letter ✓ Due diligence
Listing remarks
Opportunities like this don’t last long in today’s market! Welcome to 92 Elizabeth St in Wilkes-Barre — a charming and spacious home packed with potential for homeowners and investors alike. From the moment you step inside, you’ll appreciate the inviting layout, generous living spaces, and natural light flowing throughout the home. Whether you’re looking for your next primary residence or a smart addition to your portfolio, this property checks the boxes. Conveniently located near shopping, schools, restaurants, parks, and major highways, this home offers both comfort and accessibility. The private backyard provides the perfect space for relaxing, entertaining,
Key facts
- 4,792 sq ft lot
- Built 1900
- Listed 41 days
Property features AI
Finance
- Other: Fee simple ownership
Exterior
- Parking: Driveway
- Utilities: Public water; Public sewer; Natural gas service
- Home design: Detached property; Above-grade finished area reported as estimated
- Construction: Vinyl siding; Concrete perimeter foundation; Other structures above and below grade
- Exterior features: Not located in a federal flood zone; Tidal water: no
Interior
- Bedrooms: Five bedrooms on the first upper level
- Bathrooms: Two full bathrooms (all upper levels); One half bathroom on the main level
- Heating & cooling: Radiator heating; Natural gas heating and natural gas hot water
- Interior features: Unfinished basement; Living area reported as estimated
Neighborhood map
What this means for you Summary
Snapshot
- This is a 5-bed/2.5-bath single-family listed at $158k.
Deal economics
- At list price, monthly cash flow is $903 ($11k/yr) — positive.
- The deal already cash-flows at list — no discount required.
- Meets the 1% rule at list price ($3k rent vs $158k).
- Recommended offer: $154k (3.0% below list) — sets the bar for market timing.
- Cap rate 13.1% vs local median 5.7% in Wilkes-Barre — top-decile yield for the area; either an underpriced asset or a hidden risk that comps aren't pricing in. Stress-test before assuming the spread holds.
Location & tenants
- Location reads: area grade B — affects rentability + tenant quality, not the cash-flow math above.
- Wilkes-Barre Area SD (urban): math 19% / reading 32% proficiency, ranked #469 of 539 in PA (top 87%) — low school quality limits family demand, transient renter base, plan for 1-2y turnover; 61% free/reduced lunch — lower-income household profile, screen leases tightly.
- Zoned schools: Dr David W Kistler El Sch (math 11% / reading 29%, grade F, #1,248 of 1,518 statewide, top 83%, 916 students, 100% FRL) — zoned schools average 100% FRL vs 61% district-wide (39 pts higher); higher-poverty schools than district average — tighter screening recommended.
- Market conditions: Rents rising fast (+6.8%/yr); 221 active listings in the ZIP; 4 comparable units currently listed for rent nearby; rentals lingering (median 45d on market — plan ~5-8 weeks vacancy on turnover, expect pricing pressure); 50% of comp listings sitting > 30 days — soft ceiling on asking rent; 349 units permitted in Luzerne County in 2024 (16 in 5+ unit buildings).
- At $2,530/mo this rent would consume 54% of the median local household income ($56k/yr) (locally 1632% of renters already pay >50% of income on rent) — very limited rent-growth headroom before tenants either downsize or default.
Forward outlook
- Local home prices are declining (-3.0%/yr); year-one equity from $1k of loan paydown is wiped out by about $5k of value loss. Plan a longer hold.
- Luzerne County population projected at +4% by 2050 — modest demand growth; plan on rents tracking national, not racing it.
- At projected returns (-3.0% appreciation + 6.8% rent growth), your $44k cash investment doubles in ~5 years — after that, you're playing with house money.
Negotiation context
- It's been on market 41 days — a 3% lower offer ($154k) is reasonable based on typical stale-listing flexibility.
Risks & watch-outs
- Watch-outs: built in 1900 — expect roof / HVAC / electrical / plumbing capex.
- Climate carrying-cost: major flood risk — expect insurance premiums to compound above CPI over the hold.
Questions for the listing agent
- It's been on market 41 days. Have you received any prior offers? Is the seller open to a 3% concession, seller financing, or rate buy-down credit?
- Built in 1900 — when were the roof, HVAC, electrical panel, plumbing, and water heater last replaced?
- Is there a deadline driving the sale (1031 exchange, divorce, estate, relocation)? That informs how much negotiation room exists.
- What's the average days-on-market for RENTAL listings here right now (not sales)? A rising rental-DOM trend means longer vacancies and softer asking-rent achievability than the comps imply.
- What's the recent tenant-quality profile in this submarket — average credit score on applications, eviction rate, late-payment / NSF rate, and stable-employment percentage? A property-management company in the area should have these aggregated.
- How much new for-sale + rental construction is in the pipeline within 1–3 miles? Heavy new supply typically softens prices + rents 12–24 months out; constrained supply supports both.
Investment metrics
- 1% rule
- 1.60% ✓
- Cap rate
- 13.13%
- Cash-on-cash
- 24.42%
- DSCR
- 2.09
- GRM
- 5.2
CMA / ARV
- ARV (median comp)
- $205,053
- List price
- $158,500
- Delta
- -22.70%
- Verdict
- UNDERPRICED
- Comps
- 20 within 1.0 mi
Show comp detail 12 sales within ~0.75 mi
| Address | Dist | Beds/Ba | Sqft | Sold | Price | $/sf | Match |
|---|---|---|---|---|---|---|---|
| 533 S Franklin St | 0.21mi | 6/3.0 (+1) | 2,810 (+5%) | 2mo | $270,000 | $96 | 72 |
| 489 Franklin St | 0.27mi | 6/1.5 (+1) | 2,532 (-5%) | 2mo | $259,000 | $102 | 69 |
| 60 Mallery Pl | 0.38mi | 5/2.5 | 2,465 (-8%) | 2mo | $285,000 | $116 | 68 |
| 14 Dauphin St | 0.15mi | 4/2.5 (-1) | 2,508 (-6%) | 19mo | $269,900 | $108 | 62 |
| 169 Sambourne St | 0.23mi | 6/2.0 (+1) | 2,577 (-3%) | 18mo | $93,000 | $36 | 61 |
| 356 S River St | 0.47mi | 6/2.5 (+1) | 2,700 (+1%) | 14mo | $270,000 | $100 | 59 |
| 104 Charles St | 0.28mi | 6/2.5 (+1) | 2,512 (-6%) | 15mo | $170,000 | $68 | 59 |
| 102 Old River Rd | 0.36mi | 5/3.5 | 2,925 (+10%) | 16mo | $255,000 | $87 | 50 |
| 88 Dagobert St | 0.67mi | 4/2.5 (-1) | 2,747 (+3%) | 15mo | $300,000 | $109 | 46 |
| 276 Academy St | 0.36mi | 4/2.0 (-1) | 2,397 (-10%) | 19mo | $250,000 | $104 | 43 |
| 131 Reliance Dr | 0.66mi | 4/2.5 (-1) | 2,775 (+4%) | 18mo | $410,000 | $148 | 42 |
| 89 McLean St | 0.63mi | 5/2.0 | 2,274 (-15%) | 13mo | $205,000 | $90 | 34 |
Match score weights: distance 35% · size 25% · config 20% · recency 20%. Top-matched comps best support the ARV.
Projected returns pro-forma
-3.0% appreciation · 6.84% rent growth · sell at horizon
- IRR
- 22.0%
- Equity multiple
- 1.95×
- Total profit
- $42,018
- Equity at exit
- $23,633
- IRR
- 32.5%
- Equity multiple
- 4.51×
- Total profit
- $155,886
- Equity at exit
- $13,704
Cash invested: $44,380 (down + closing). Projections, not guarantees.
Landlord ↔ Tenant lean methodology
- Overall (STATE)
- 62 Landlord-Friendly
- State Pennsylvania
- 62 Landlord-Friendly · EVEN
- County
- — inherits STATE
- City
- — inherits STATE
ZIP-level market 18702
- Rents YoY
- 6.8%
- Active inventory
- 221
- Price-to-rent
- 5.2×
Monthly cashflow live
- Estimated rent
- $2,530 medium interval (Pro) →
- Mortgage (P&I)
- −$831
- Tax est. 1.5%
- −$198 /mo · $2,378/yr
- Insurance
- −$66
- HOA
- −$0
- Vacancy / Maint / Mgmt
- −$531
- Net cashflow
- $903
Break-even live
Sensitivity live
| Price | -10% $1,013 | -5% $958 | +0% $903 | +5% $848 | +10% $793 |
|---|---|---|---|---|---|
| Rent | -10% $703 | -5% $803 | +0% $903 | +5% $1,003 | +10% $1,103 |
| Rate | -1.0pp $983 | -0.5pp $943 | base $903 | +0.5pp $862 | +1.0pp $820 |
UW: 25.0% down · 7.5% · 30yr · 1.5% tax · 5.0% vac · 8.0% maint · 8.0% mgmt
Financing live
Cash to close
- Down payment
- $39,625
- Closing costs
- $4,755
- Reserves months
- —
- Total cash needed
- —
Loan-product check · same deal, 3 products live
Conventional
25% down · 7.5% · 30yr
- Down + closing
- —
- Monthly P&I
- —
- Monthly cashflow
- —
- DSCR
- —
- Eligible?
- —
Personal DTI + credit; lowest rate.
DSCR
20% down · 8.5% · 30yr
- Down + closing
- —
- Monthly P&I
- —
- Monthly cashflow
- —
- DSCR
- —
- Eligible?
- —
No personal income docs; deal must DSCR.
Hard money
10% down · 12.0% · 12mo
- Down + closing
- —
- Monthly P&I
- —
- Monthly cashflow
- —
- DSCR
- —
- Eligible?
- —
Short-term bridge; refi at stabilization.
Rent comps 4 comps
| Address | Beds | Baths | Sqft | Rent | $/sqft | DOM | Units | Dist |
|---|---|---|---|---|---|---|---|---|
| 533 S Franklin St Wilkes Barre, PA | 6.0 | 3.0 | 2810 | $3,000 | $1.07 | 45d | 1 | 0.18mi |
| 21 Edison St Wilkes Barre, PA | 4.0 | 1.5 | 2900 | $1,400 | $0.48 | 15d | 1 | 0.34mi |
| 381 S River St Wilkes-Barre, PA | 6.0 | 2.0 | 1908 | $2,400 | $1.26 | 45d | 1 | 0.40mi |
| 249 Parrish St Wilkes Barre, PA | 5.0 | 2.0 | 2214 | $2,000 | $0.90 | 15d | 1 | 0.72mi |
Listing history 15 events
-
2026-06-18days on market $158,500 Active 41 DOM
-
2026-06-17days on market $158,500 Active 40 DOM
-
2026-06-16days on market $158,500 Active 39 DOM
-
2026-06-15days on market $158,500 Active 38 DOM
-
2026-06-14days on market $158,500 Active 36 DOM
-
2026-06-13days on market $158,500 Active 35 DOM
-
2026-06-10pricedays on market $158,500 Active 33 DOM
-
2026-06-09days on market $165,000 Active 32 DOM
-
2026-06-08days on market $165,000 Active 31 DOM
-
2026-06-07days on market $165,000 Active 30 DOM
-
2026-06-02days on market $165,000 Active 25 DOM
-
2026-06-01pricedays on market $165,000 Active 24 DOM
-
2026-05-31days on market $172,000 Active 23 DOM
-
2026-05-30days on market $172,000 Active 22 DOM
-
2026-05-08$175,000 Active 983-char remark
ⓘ Source: listings_history table (triggers on properties + properties_extension) + one-shot
backfill from property_details.listing_events for pre-trigger history.
Climate risk First Street
- Flood 6/10 Major FEMA zone X · 27% chance over 30 yrs
- Wildfire 3/10 Moderate
- Heat 4/10 Moderate 7 d/yr ≥97°F today · 16 d/yr by 30 yrs out
- Wind 3/10 Moderate 5% chance of damaging wind over 30 yrs
- Air quality 2/10 Low 1 unhealthy d/yr today · 2 by 30 yrs out
Nearby sold comps map
Loading sold comps map…
Walkable amenities ~0.75 mi
Loading nearby amenities…
Taxation est. · year 1
- Rental income
- $30,355
- − Mortgage interest
- −$8,878
- − Property taxes
- −$2,378
- − Insurance
- −$792
- − Repairs & maintenance
- −$2,428
- − Management
- −$2,428
- − Depreciation
- −$4,611
- Taxable income
- $8,839
- Est. tax owed @ 24.0%
- −$2,121
- After-tax cash flow
- $8,715/yr
For passive investors: Depreciation is non-cash, so a rental often shows a tax loss while cash-flowing — sheltering income. Rental losses are passive: they offset passive income freely, and up to $25,000/yr can offset ordinary (W-2) income if you actively participate and your MAGI is under $100k (phasing out to $0 by $150k); unused losses carry forward. On sale, claimed depreciation is recaptured at up to 25%, and gains may owe capital-gains tax (a 1031 exchange can defer both). Figures are a year-1 estimate at your 24.0% rate — not tax advice; consult a CPA.
Schools (NCES district)
- District
- Wilkes-Barre Area SD
- NCES district ID
- 4226300
- Math proficiency
- 19% ▼ -2.00%
- Reading proficiency
- 32% ▼ -9.00%
- Median HH income
- $37,420
- Composite
- 21.22/100
- National rank
- #8409
- State rank
- #469 of 539 in PA
Livability — Wilkes-Barre
No livability data for this city. (Only ~50 U.S. cities are tracked.)
Census & demographics
- Census place
- Wilkes-Barre, PA
- County
- Luzerne County · 118,885 people
- City population
- 73,981
- Metro
- Scranton--Wilkes-Barre, PA
- Population (ZIP)
- 41,970
- Household income
- $56,378
- Rent vs Own
- Severe rent burden
- 1632.0
Population outlook (Luzerne County) Hauer SSP2
- Today (2025)
- 319,505 people
- By 2030
- 319,943 · +0.1%
- By 2040
- 322,643 · +1.0%
- By 2050
- 330,817 · +3.5%
- By 2075
- 379,145 · +18.7%
- By 2100
- 431,908 · +35.2%
Race, ethnicity, and origin ACS 2023
- Neighborhood character
- Diverse neighborhood (Simpson 0.59)
- Race & ethnicity
- White 58% Hispanic / Latino 25% Black 12% Two or more races 11% Asian 2%
- Hispanic origin (detail)
- Mexican 6% Puerto Rican 6% Dominican 9%
- Common ancestry
- Romanian 14% Scotch-Irish 2% Iranian 1%
- Foreign-born
- 13% · Canada, Jamaica
- Languages at home
- 79% English-only · Spanish 17% Other Asian/Pacific 1% Other Indo-European 1%
Political lean MEDSL · Luzerne
- 2024 margin
- R (+19.2) · D 40.0% · R 59.2%
- 2008→2024 swing
- -27.6pp toward R · 2008: 8.4pp · 2024: -19.2pp
- All cycles
- 2024: R+19.2 2020: R+14.4 2016: R+19.6 2012: D+4.8 2008: D+8.4
Not yet ingested
- Civics
- —
Market trends
- HPI YoY
- ▼ -156.99%
- Current HPI
- 216.9373
- Rent YoY
- ▲ 6.84%
- Metro
- Scranton--Wilkes-Barre, PA
- State GDP YoY
- ▲ 1.68%
- F500 in state
- 34
Industry mix (Fortune 500 HQ in PA)
| Industry | F500 HQs | Revenue |
|---|---|---|
| Healthcare | 2 | $309B |
|
||
| Insurance | 2 | $27B |
|
||
| Telecommunications / Media | 1 | $124B |
|
||
| Industrial Distribution | 1 | $22B |
|
||
| Financial Services | 1 | $20B |
|
||
| Chemicals / Materials | 1 | $18B |
|
||
Price history
-9.4% since first listed4 events — show timeline
- 2026-06-10 Price Changed $158,500 BRIGHT MLS
- 2026-06-01 Price Changed $165,000 BRIGHT MLS
- 2026-05-21 Price Changed $172,000 BRIGHT MLS
- 2026-05-08 Listed $175,000 BRIGHT MLS
Property tax history
+20.4%/yrLatest (2026): $15,359 · +0.1% YoY. Source: county tax records.
Cash-flow waterfall
monthlySold comps — $/sqft
last 12 mo · ≤1 miLoading sold comps…