 Multi-family
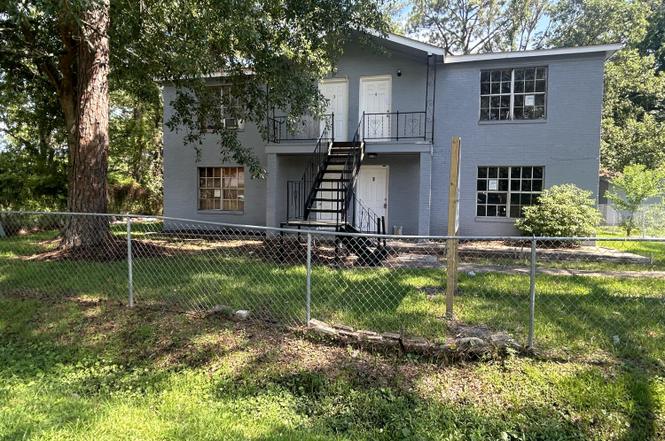
6418 Walnut St · Moss Point, MS
Flood risk 8/10 · Major
- FEMA flood zone
- X (shaded)
- Chance of flooding over 30 yrs
- 0.99%
- Est. flood insurance / yr
- $507 – $1,088
Fire risk 7/10 · Major
- Est. fire insurance / yr
- $1,241 – $2,305
Heat risk 10/10 · Severe
- Hot days now (above 105°F)
- 7 days/yr
- Hot days in 30 yrs
- 22 days/yr
Wind risk 9/10 · Severe
- Chance of severe wind over 30 yrs
- 99.0%
Air-quality risk 3/10 · Minor
- Unhealthy air days now
- 2 days/yr
- Unhealthy air days in 30 yrs
- 3 days/yr
Risk factors via First Street. Map © Google.
Why this score? — see what drove the D+ grade
The composite is a weighted blend of 9 inputs, each scored 0–100. Each bar is that input's sub-score; the figure is the points it added to the 100-point composite (weight × sub-score).
- Cash flow +13.9/30.0
- Appreciation +7.3/10.0
- ARV discount +6.9/15.0
- DSCR +4.2/10.0
- Livability +3.4/5.0
- 1% rule +2.9/10.0
- Rent growth +2.5/5.0
- Condition / age +2.5/5.0
- Schools +1.6/10.0
$164,000
🖨 Deal sheet (PDF) 📄 Offer letter ✓ Due diligence
Multi-family units
County records classify this as Multi-Family (5+ Unit). Listing-text estimate: 1 unit. estimate disagrees with records
5+ unit building — per-unit beds/baths from public records are typically unavailable; the breakdown below (if shown) is an estimate from the listing text.
Listing remarks MLS
INCOME!!!! REMODELED!!! 4-plex!! , all units are ready to rent. will make a great cash flow. Owner/Agent
Key facts
- 8,712 sq ft lot
- Built 1972
- Listed 105 days
Property features AI
Finance
- Financial info: Four total units
Exterior
- Parking: Driveway
- Utilities: Public water; Public sewer; Water available
- Home design: Quadruplex; Two levels; Brick construction; Permanent foundation
- Construction: Brick construction; Permanent foundation; Shingle roof; Two-story building
- Exterior features: Shingle roof; Public water available; Public sewer
Interior
- Bathrooms: Four bathrooms
- Interior features: Central heating; Central air; Window air conditioning units
Neighborhood map
What this means for you Summary
Snapshot
- This is a 4-bed/4.0-bath multifamily listed at $164k.
Deal economics
- At list price, monthly cash flow is $-48 ($-577/yr) — negative.
- To cash-flow at today's rent, offer at most $156k (5.2% below list).
- To meet the 1% rule (rent ≥ 1% of price), the offer needs to be $130k (20.7% below list).
- Recommended offer: $130k (20.7% below list) — sets the bar for 1% rule.
Location & tenants
- Location reads 67/100 on livability (#77 in MS) — a middle-class / working-renter tenant base. Strengths: cost of living A+, housing A+, crime A-; Watch: health & safety D+, amenities F, commute F.
- Moss Point Separate School District (suburban): math 17% / reading 22% proficiency, ranked #94 of 130 in MS (top 72%) — low school quality limits family demand, transient renter base, plan for 1-2y turnover; 83% free/reduced lunch — lower-income household profile, screen leases tightly.
- Zoned schools: Moss Point Kreole Primary School (394 students, 100% FRL); Magnolia Middle School (math 19% / reading 23%, grade F, #112 of 179 statewide, top 64%, 381 students, 100% FRL); Moss Point High School (math 27% / reading 27%, grade F, #101 of 197 statewide, top 54%, 455 students, 100% FRL) — zoned schools average 100% FRL vs 83% district-wide (17 pts higher); higher-poverty schools than district average — tighter screening recommended.
- Market conditions: 88 active listings in the ZIP; 1 comparable units currently listed for rent nearby; 516 units permitted in Jackson County in 2024 (6 in 5+ unit buildings).
Forward outlook
- In year one you build about $9k of equity ($1k loan paydown + $8k appreciation (4.6% local appreciation)).
- At projected returns (4.6% appreciation + 3.0% rent growth), your $46k cash investment doubles in ~5 years — after that, you're playing with house money.
- By year 5, paydown + projected appreciation supports a ~$38k cash-out refi (75% LTV) — recoverable capital for the next deal without selling this one.
Negotiation context
- It's been on market 105 days — a 9% lower offer ($149k) is reasonable based on typical stale-listing flexibility.
- 5 sale attempts since 12y ago with the ask held roughly flat each time — persistent listings suggest the price (not the market) is what's stuck; bring a comps-based counter.
Risks & watch-outs
- Watch-outs: flood insurance adds $66/mo.
- Climate carrying-cost: severe flood risk; severe wind risk, 99% chance of damaging wind over 30y; major wildfire risk; extreme-heat days projected 7→22/yr by 2055 (HVAC capex compounding) — expect insurance premiums to compound above CPI over the hold.
Questions for the listing agent
- What do current leases actually rent for vs. the listed asking? Can we see a recent rent roll and the last 12 months of T-12 income?
- It's been on market 105 days. Have you received any prior offers? Is the seller open to a 21% concession, seller financing, or rate buy-down credit?
- Built in 1972 — when were the roof, HVAC, electrical panel, plumbing, and water heater last replaced?
- What's the actual annual flood-insurance premium (NFIP or private), and is the property in a SFHA with mandatory coverage?
- Why hasn't it sold? Are there any deal-killer items the seller is aware of (foundation, flood, title, zoning, code violations)?
- Is there a deadline driving the sale (1031 exchange, divorce, estate, relocation)? That informs how much negotiation room exists.
- Schools are D-rated, which usually means shorter tenancies and higher turnover. Who's the typical renter profile here, and what's been the actual vacancy rate?
- The area grade is low — what's the realistic commute time and amenity access for the typical tenant pool here? Any planned neighborhood developments (good or bad) we should know about?
- What's the average days-on-market for RENTAL listings here right now (not sales)? A rising rental-DOM trend means longer vacancies and softer asking-rent achievability than the comps imply.
- What's the recent tenant-quality profile in this submarket — average credit score on applications, eviction rate, late-payment / NSF rate, and stable-employment percentage? A property-management company in the area should have these aggregated.
- How much new apartment / multifamily construction is in the pipeline within 1–3 miles? Heavy new supply (>2% of stock underway) typically softens rents 12–24 months out; light construction supports rent growth.
Investment metrics
- 1% rule
- 0.79% ✗
- Cap rate
- 6.43%
- Cash-on-cash
- 0.48%
- DSCR
- 1.02
- GRM
- 10.5
CMA / ARV
- ARV (on-the-fly)
- $162,000
- Comps found
- 2
Show comp detail 2 sales within ~0.75 mi
| Address | Dist | Beds/Ba | Sqft | Sold | Price | $/sf | Match |
|---|---|---|---|---|---|---|---|
| 4009 Hilma St | 0.13mi | 4/2.0 | 2,030 (+0%) | 14mo | $140,000 | $69 | 74 |
| 6430 Jasmine St | 0.08mi | 4/4.0 | 2,258 (+12%) | 17mo | $179,900 | $80 | 63 |
Match score weights: distance 35% · size 25% · config 20% · recency 20%. Top-matched comps best support the ARV.
Projected returns pro-forma
4.6% appreciation · 3.0% rent growth · sell at horizon
- IRR
- 10.8%
- Equity multiple
- 1.68×
- Total profit
- $31,020
- Equity at exit
- $88,999
- IRR
- 12.2%
- Equity multiple
- 3.14×
- Total profit
- $98,253
- Equity at exit
- $150,438
Cash invested: $45,920 (down + closing). Projections, not guarantees.
Landlord ↔ Tenant lean methodology
- Overall (STATE)
- 90 Strongly Landlord-Friendly
- State Mississippi
- 90 Strongly Landlord-Friendly · R+11
- County
- — inherits STATE
- City
- — inherits STATE
ZIP-level market 39563
- Home prices YoY
- 3.0%
- Active inventory
- 88
- Price-to-rent
- 10.5×
Monthly cashflow live
- Estimated rent
- $1,300 medium interval (Pro) →
- Mortgage (P&I)
- −$860
- Tax from tax record
- −$80 /mo · $963/yr
- Insurance
- −$68
- Flood insurance flood zone
- −$66 /mo · $798/yr
- HOA
- −$0
- Vacancy / Maint / Mgmt
- −$273
- Net cashflow
- $-48
Break-even live
Sensitivity live
| Price | -10% $45 | -5% $-2 | +0% $-48 | +5% $-94 | +10% $-141 |
|---|---|---|---|---|---|
| Rent | -10% $-151 | -5% $-99 | +0% $-48 | +5% $3 | +10% $55 |
| Rate | -1.0pp $35 | -0.5pp $-6 | base $-48 | +0.5pp $-91 | +1.0pp $-134 |
UW: 25.0% down · 7.5% · 30yr · 1.5% tax · 5.0% vac · 8.0% maint · 8.0% mgmt
Financing live
Cash to close
- Down payment
- $41,000
- Closing costs
- $4,920
- Reserves months
- —
- Total cash needed
- —
Loan-product check · same deal, 3 products live
Conventional
25% down · 7.5% · 30yr
- Down + closing
- —
- Monthly P&I
- —
- Monthly cashflow
- —
- DSCR
- —
- Eligible?
- —
Personal DTI + credit; lowest rate.
DSCR
20% down · 8.5% · 30yr
- Down + closing
- —
- Monthly P&I
- —
- Monthly cashflow
- —
- DSCR
- —
- Eligible?
- —
No personal income docs; deal must DSCR.
Hard money
10% down · 12.0% · 12mo
- Down + closing
- —
- Monthly P&I
- —
- Monthly cashflow
- —
- DSCR
- —
- Eligible?
- —
Short-term bridge; refi at stabilization.
Rent comps 1 comps
| Address | Beds | Baths | Sqft | Rent | $/sqft | DOM | Units | Dist |
|---|---|---|---|---|---|---|---|---|
| 5443 Hubert St Moss Point, MS | 3.0 | 2.0 | 1750 | $1,300 | $0.74 | 23d | 1 | 1.04mi |
Listing history 31 events
-
2026-06-22days on market $164,000 Active 105 DOM
-
2026-06-18days on market $164,000 Active 102 DOM
-
2026-06-17days on market $164,000 Active 101 DOM
-
2026-06-16days on market $164,000 Active 100 DOM
-
2026-06-15days on market $164,000 Active 99 DOM
-
2026-06-14days on market $164,000 Active 97 DOM
-
2026-06-13days on market $164,000 Active 96 DOM
-
2026-06-10days on market $164,000 Active 94 DOM
-
2026-06-09days on market $164,000 Active 93 DOM
-
2026-06-08days on market $164,000 Active 92 DOM
-
2026-06-07days on market $164,000 Active 91 DOM
-
2026-06-02days on market $164,000 Active 86 DOM
-
2026-06-01days on market $164,000 Active 85 DOM
-
2026-05-31days on market $164,000 Active 84 DOM
-
2026-05-30days on market $164,000 Active 83 DOM
-
2026-04-13price $164,000
-
2026-03-08$170,000 Active
-
2025-10-05historical
-
2025-08-20price $129,900
-
2025-07-05status Active
-
2025-04-05historical
-
2025-03-25price $135,000
-
2025-03-06price $140,000
-
2025-01-31price $150,000
-
2024-09-25price $160,000
-
2024-07-02$170,000 Active
-
2021-06-11soldstatus
-
2015-12-21soldstatus 104-char remark
Show marketing remark (104 chars)
INCOME!!!! REMODELED!!! 4-plex!! , all units are ready to rent. will make a great cash flow. Owner/Agent
-
2015-06-02$52,500 104-char remark
Show marketing remark (104 chars)
INCOME!!!! REMODELED!!! 4-plex!! , all units are ready to rent. will make a great cash flow. Owner/Agent
-
2014-10-21soldstatus
-
2014-06-21$38,900
ⓘ Source: listings_history table (triggers on properties + properties_extension) + one-shot
backfill from property_details.listing_events for pre-trigger history.
Tax reassessment forecast MS · Resets to sale price
- Current annual tax
- $963 · $80/mo
- Projected year-2 tax
- $1,296 · $108/mo
- Expected delta
- +$333/yr (+$28/mo · 34.5%)
ⓘ Screening estimate from a state-policy table — verify with the county assessor before closing.
Climate risk First Street
- Flood 8/10 Severe FEMA zone X (shaded) · 99% chance over 30 yrs
- Wildfire 7/10 Severe
- Heat 10/10 Extreme 7 d/yr ≥105°F today · 22 d/yr by 30 yrs out
- Wind 9/10 Extreme 99% chance of damaging wind over 30 yrs
- Air quality 3/10 Moderate 2 unhealthy d/yr today · 3 by 30 yrs out
Nearby sold comps map
Loading sold comps map…
Walkable amenities ~0.75 mi
Loading nearby amenities…
Taxation est. · year 1
- Rental income
- $15,600
- − Mortgage interest
- −$9,187
- − Property taxes
- −$963
- − Insurance
- −$1,618
- − Repairs & maintenance
- −$1,248
- − Management
- −$1,248
- − Depreciation
- −$4,771
- Taxable loss
- −$3,434
- Est. tax savings @ 24.0%
- +$824
- After-tax cash flow
- $247/yr
For passive investors: Depreciation is non-cash, so a rental often shows a tax loss while cash-flowing — sheltering income. Rental losses are passive: they offset passive income freely, and up to $25,000/yr can offset ordinary (W-2) income if you actively participate and your MAGI is under $100k (phasing out to $0 by $150k); unused losses carry forward. On sale, claimed depreciation is recaptured at up to 25%, and gains may owe capital-gains tax (a 1031 exchange can defer both). Figures are a year-1 estimate at your 24.0% rate — not tax advice; consult a CPA.
Schools (NCES district)
- District
- Moss Point Separate School District
- NCES district ID
- 2803000
- Math proficiency
- 17% ▼ -3.00%
- Reading proficiency
- 22% ▬ 0.00%
- Median HH income
- $38,041
- Composite
- 16.34/100
- National rank
- #9205
- State rank
- #94 of 130 in MS
Livability — Moss Point
- Score
- 67/100
- State rank
- #77
- US rank
- #10398
Category grades
Schools grade is shown separately in the Schools card above.
Census & demographics
- Census place
- Moss Point, MS
- City population
- 12,023
- Population (ZIP)
- 12,023
Population outlook (Jackson County) Hauer SSP2
- Today (2025)
- 146,926 people
- By 2030
- 148,442 · +1.0%
- By 2040
- 149,631 · +1.8%
- By 2050
- 148,723 · +1.2%
- By 2075
- 147,845 · +0.6%
- By 2100
- 144,510 · -1.6%
Race, ethnicity, and origin ACS 2023
- Neighborhood character
- Predominantly Black (74%)
- Race & ethnicity
- Black 74% White 18% Hispanic / Latino 4% Two or more races 2%
- Common ancestry
- Lithuanian 0%
- Foreign-born
- 1% · Canada
- Languages at home
- 97% English-only · Spanish 3%
Political lean MEDSL · Jackson
- 2024 margin
- Solid R (+39.9) · D 29.5% · R 69.4% · Other 1.1%
- 2008→2024 swing
- -6.4pp toward R · 2008: -33.5pp · 2024: -39.9pp
- All cycles
- 2024: R+39.9 2020: R+34.6 2016: R+39.9 2012: R+36.1 2008: R+33.5
Not yet ingested
- Civics
- —
Market trends
- HPI YoY
- ▲ 4.60%
- Current HPI
- 155.3138
- Rent YoY
- —
- Metro
- —
- State GDP YoY
- —
- F500 in state
- 0
Price history
+321.6% since first listed16 events — show timeline
- 2026-04-13 Price Changed $164,000 MLSU
- 2026-03-08 Listed $170,000 MLSU
- 2025-10-05 Listing Removed — MLSU
- 2025-08-20 Price Changed $129,900 MLSU
- 2025-07-05 Relisted — MLSU
- 2025-04-05 Listing Removed — MLSU
- 2025-03-25 Price Changed $135,000 MLSU
- 2025-03-06 Price Changed $140,000 MLSU
- 2025-01-31 Price Changed $150,000 MLSU
- 2024-09-25 Price Changed $160,000 MLSU
- 2024-07-02 Listed $170,000 MLSU
- 2021-06-11 Sold (Public Records) — Public Records
- 2015-12-21 Sold (MLS) — MLSU
- 2015-06-02 Listed $52,500 MLSU
- 2014-10-21 Sold (MLS) — MLSU
- 2014-06-21 Listed $38,900 MLSU
Property tax history
+0.7%/yrLatest (2025): $963 · +2.5% YoY. Source: county tax records.
Cash-flow waterfall
monthlySold comps — $/sqft
last 12 mo · ≤1 miLoading sold comps…