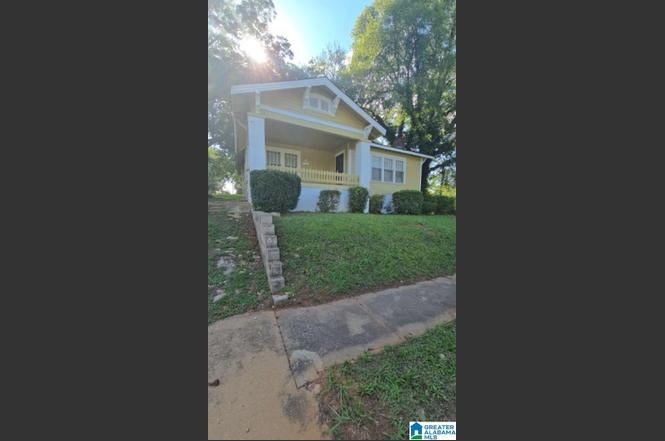
5108 Court M · Birmingham, AL
Flood risk 1/10 · Minimal
- FEMA flood zone
- X (unshaded)
- Chance of flooding over 30 yrs
- 0.0%
- Est. flood insurance / yr
- $507 – $1,088
Fire risk 1/10 · Minimal
- Est. fire insurance / yr
- $916 – $1,700
Heat risk 6/10 · Moderate
- Hot days now (above 108°F)
- 7 days/yr
- Hot days in 30 yrs
- 19 days/yr
Wind risk 6/10 · Moderate
- Chance of severe wind over 30 yrs
- 27.0%
Air-quality risk 4/10 · Minor
- Unhealthy air days now
- 5 days/yr
- Unhealthy air days in 30 yrs
- 5 days/yr
Risk factors via First Street. Map © Google.
Why this score? — see what drove the B grade
The composite is a weighted blend of 9 inputs, each scored 0–100. Each bar is that input's sub-score; the figure is the points it added to the 100-point composite (weight × sub-score).
- Cash flow +30.0/30.0
- ARV discount +12.9/15.0
- DSCR +10.0/10.0
- 1% rule +9.1/10.0
- Rent growth +4.3/5.0
- Livability +3.4/5.0
- Condition / age +2.5/5.0
- Schools +0.9/10.0
- Appreciation +0.0/10.0
$84,900
🖨 Deal sheet 📄 Offer letter ✓ Due diligence
Listing remarks
Step into this large, stately home featuring gleaming hardwood floors and a spacious kitchen ready for your new island. With two bedrooms and one bath, plus a versatile bonus room that can serve as a third bedroom for your toddler or teen, this home adapts to your family’s needs. The oversized backyard and lot are perfect for hosting family reunions, weekend barbecues, or giving kids room to play. Recent updates include a new roof and fresh paint throughout, making this property move-in ready. With zero-money-down options available, this is an opportunity you don’t want to miss. Call Tina Tyus today to schedule your showing. The home is easy to access with lockbox code 1211 on t
Key facts
- Fresh paint
- Spacious kitchen
- Oversized backyard
Tags
Property features AI
Finance
- Other: Located in the Ivanhoe subdivision; Fire district: Bessemer
- Financial info: Fire fee assessed yearly ($120); Monthly garbage fee ($25)
- HOA & community: No association fee
Exterior
- Parking: Driveway parking; Off-street parking; One carport space
- Utilities: Public water; Connected sewer; Internet service available (cable and fiber options in area); Electric water heater
- Home design: Existing (previously built) structure; Wood construction; Crawl space foundation
- Construction: Wood construction; Crawl space foundation
- Exterior features: Fenced yard; Open patio; Porch; Garden/patio; Sidewalks; Street lights; Interior lot; Paved road access
Interior
- Kitchen: Eating area; Laminate countertops; Refrigerator; Gas stove
- Bedrooms: Master bedroom on main level; Two additional bedrooms on main level
- Flooring: Hardwood floors; Vinyl floors
- Bathrooms: One full bathroom with tub/shower combo; Linen closet
- Heating & cooling: Space heaters for heating; Window air-conditioning units
- Interior features: Smooth ceilings; No special interior features listed
- Laundry & utility: Main-level laundry room; Washer hookup; Electric dryer hookup; Electric water heater
Neighborhood map
What this means for you Summary
Snapshot
- This is a 3-bed/1.0-bath single-family listed at $85k.
Deal economics
- At list price, monthly cash flow is $352 ($4k/yr) — positive.
- The deal already cash-flows at list — no discount required.
- Meets the 1% rule at list price ($1k rent vs $85k).
- Cap rate 11.3% vs local median 6.2% in Birmingham — top-decile yield for the area; either an underpriced asset or a hidden risk that comps aren't pricing in. Stress-test before assuming the spread holds.
Location & tenants
- Location reads 67/100 on livability (#78 in AL) — a middle-class / working-renter tenant base. Strengths: commute A+, cost of living A+, housing A+; Watch: amenities C-, crime F, employment F.
- Birmingham City (urban): math 4% / reading 20% proficiency, ranked #116 of 129 in AL (top 90%) — low school quality limits family demand, transient renter base, plan for 1-2y turnover; 82% free/reduced lunch — lower-income household profile, screen leases tightly.
- Zoned schools: Minor Elementary School (math 0% / reading 14%, grade F, #601 of 627 statewide, top 98%, 454 students, 90% FRL).
- Market conditions: Rents rising fast (+7.2%/yr); 122 active listings in the ZIP; 40 comparable units currently listed for rent nearby; rentals at typical pace (median 24d on market — plan ~3-4 weeks tenant-placement turnaround); 48% of comp listings sitting > 30 days — soft ceiling on asking rent; lower-income renter base — watch delinquency; 2,114 units permitted in Jefferson County in 2024 (556 in 5+ unit buildings).
- This rent runs 37% of the median local income ($39k/yr) — at the standard rent-burdened threshold; future hikes will face affordability resistance.
Forward outlook
- Local home prices are declining (-3.0%/yr); year-one equity from $587 of loan paydown is wiped out by about $3k of value loss. Plan a longer hold.
- Jefferson County population projected to shrink 4% by 2050 — rents likely to lag national; underwrite the cash flow, not the appreciation.
- At projected returns (-3.0% appreciation + 7.2% rent growth), your $24k cash investment doubles in ~6 years — after that, you're playing with house money.
Negotiation context
- Only 1 days on market — expect competitive offers; lowballing is unlikely to land.
- Current owner paid $26k; list at $85k implies a 227% gain — meaningful room to come down on a strong offer.
Risks & watch-outs
- Watch-outs: built in 1940 — expect roof / HVAC / electrical / plumbing capex.
- Climate carrying-cost: major wind risk, 27% chance of damaging wind over 30y; extreme-heat days projected 7→19/yr by 2055 (HVAC capex compounding) — expect insurance premiums to compound above CPI over the hold.
Questions for the listing agent
- Built in 1940 — when were the roof, HVAC, electrical panel, plumbing, and water heater last replaced?
- Is there a deadline driving the sale (1031 exchange, divorce, estate, relocation)? That informs how much negotiation room exists.
- Schools are F-rated, which usually means shorter tenancies and higher turnover. Who's the typical renter profile here, and what's been the actual vacancy rate?
- Crime grade is F in this area — have there been break-ins, vandalism, or insurance claims at this property in the last 3 years? What carrier currently insures it and at what premium?
- What's the average days-on-market for RENTAL listings here right now (not sales)? A rising rental-DOM trend means longer vacancies and softer asking-rent achievability than the comps imply.
- What's the recent tenant-quality profile in this submarket — average credit score on applications, eviction rate, late-payment / NSF rate, and stable-employment percentage? A property-management company in the area should have these aggregated.
- How much new for-sale + rental construction is in the pipeline within 1–3 miles? Heavy new supply typically softens prices + rents 12–24 months out; constrained supply supports both.
Investment metrics
- 1% rule
- 1.41% ✓
- Cap rate
- 11.27%
- Cash-on-cash
- 17.79%
- DSCR
- 1.79
- GRM
- 5.9
CMA / ARV
- ARV (on-the-fly)
- $96,460
- Comps found
- 12
Show comp detail 12 sales within ~0.75 mi
| Address | Dist | Beds/Ba | Sqft | Sold | Price | $/sf | Match |
|---|---|---|---|---|---|---|---|
| 1037 W 51st St | 0.19mi | 3/2.0 | 1,392 (-6%) | 3mo | $174,000 | $125 | 74 |
| 1611 50th St Ensley | 0.39mi | 3/1.5 | 1,482 (-0%) | 7mo | $98,000 | $66 | 74 |
| 1527 46th Street Ensley | 0.43mi | 3/1.0 | 1,571 (+6%) | 6mo | $35,000 | $22 | 65 |
| 1265 Meadow Ln | 0.73mi | 3/2.0 | 1,456 (-2%) | 1mo | $79,900 | $55 | 58 |
| 6000 Court H | 0.65mi | 4/1.0 (+1) | 1,456 (-2%) | 5mo | $153,000 | $105 | 58 |
| 1607 43rd St | 0.65mi | 3/2.0 | 1,435 (-3%) | 5mo | $85,000 | $59 | 56 |
| 1508 W 51st St | 0.33mi | 3/1.5 | 1,264 (-15%) | 2mo | $30,000 | $24 | 56 |
| 1601 48th St | 0.49mi | 3/1.0 | 1,313 (-12%) | 7mo | $84,900 | $65 | 53 |
| 1341 41st St | 0.66mi | 3/1.0 | 1,340 (-10%) | 5mo | $106,000 | $79 | 48 |
| 4637 Avenue R | 0.70mi | 2/1.0 (-1) | 1,378 (-7%) | 3mo | $28,500 | $21 | 48 |
| 1523 44th St E | 0.54mi | 3/2.0 | 1,307 (-12%) | 5mo | $133,000 | $102 | 47 |
| 827 60th St | 0.65mi | 3/2.0 | 1,650 (+11%) | 4mo | $60,000 | $36 | 44 |
Match score weights: distance 35% · size 25% · config 20% · recency 20%. Top-matched comps best support the ARV.
Projected returns pro-forma
-3.0% appreciation · 7.24% rent growth · sell at horizon
- IRR
- 14.1%
- Equity multiple
- 1.59×
- Total profit
- $14,048
- Equity at exit
- $12,659
- IRR
- 25.9%
- Equity multiple
- 3.74×
- Total profit
- $65,120
- Equity at exit
- $7,341
Cash invested: $23,772 (down + closing). Projections, not guarantees.
Landlord ↔ Tenant lean methodology
- Overall (STATE)
- 90 Strongly Landlord-Friendly
- State Alabama
- 90 Strongly Landlord-Friendly · R+15
- County
- — inherits STATE
- City
- — inherits STATE
ZIP-level market 35208
- Home prices YoY
- -18.1%
- Rents YoY
- 7.2%
- Active inventory
- 122
- Price-to-rent
- 5.9×
Monthly cashflow live
- Estimated rent
- $1,199 high interval (Pro) →
- Mortgage (P&I)
- −$445
- Tax from tax record
- −$114 /mo · $1,369/yr
- Insurance
- −$35
- HOA
- −$0
- Vacancy / Maint / Mgmt
- −$252
- Net cashflow
- $352
Break-even live
UW: 25.0% down · 7.5% · 30yr · 1.5% tax · 5.0% vac · 8.0% maint · 8.0% mgmt
Financing live
Cash to close
- Down payment
- $21,225
- Closing costs
- $2,547
- Reserves months
- —
- Total cash needed
- —
Loan-product check · same deal, 3 products live
Conventional
25% down · 7.5% · 30yr
- Down + closing
- —
- Monthly P&I
- —
- Monthly cashflow
- —
- DSCR
- —
- Eligible?
- —
Personal DTI + credit; lowest rate.
DSCR
20% down · 8.5% · 30yr
- Down + closing
- —
- Monthly P&I
- —
- Monthly cashflow
- —
- DSCR
- —
- Eligible?
- —
No personal income docs; deal must DSCR.
Hard money
10% down · 12.0% · 12mo
- Down + closing
- —
- Monthly P&I
- —
- Monthly cashflow
- —
- DSCR
- —
- Eligible?
- —
Short-term bridge; refi at stabilization.
Rent comps 40 comps
| Address | Beds | Baths | Sqft | Rent | $/sqft | DOM | Units | Dist |
|---|---|---|---|---|---|---|---|---|
| 4716 Court M Birmingham, AL | 4.0 | 1.0 | 932 | $1,200 | $1.29 | 43d | 1 | 0.20mi |
| 1417 Bessemer Rd Birmingham, AL | 3.0 | 1.0 | 1688 | $1,200 | $0.71 | 43d | 1 | 0.21mi |
| 1112 47th St W Birmingham, AL | 2.0 | 1.0 | 1166 | $975 | $0.84 | 43d | 1 | 0.28mi |
| 1037 47th Street Ensley Unit ENSLEY Birmingham, AL | 3.0 | 2.0 | 1299 | $1,000 | $0.77 | 43d | 1 | 0.30mi |
| 1345 46th Street Ensley Unit ENSLEY Birmingham, AL | 3.0 | 2.0 | 1617 | $1,175 | $0.73 | 3d | 1 | 0.31mi |
| 1410 46th Street Ensley Unit ENSLEY Birmingham, AL | 3.0 | 1.0 | 1200 | $1,000 | $0.83 | 43d | 1 | 0.36mi |
| 5316 Court I Birmingham, AL | 3.0 | 2.0 | 1284 | $1,200 | $0.93 | 43d | 1 | 0.38mi |
| 5604 Terrace O Birmingham, AL | 4.0 | 1.0 | 1072 | $1,325 | $1.24 | 43d | 1 | 0.39mi |
| 1563 Martin Ave Birmingham, AL | 4.0 | 2.0 | 1848 | $1,495 | $0.81 | 1d | 1 | 0.40mi |
| 5521 Court I Birmingham, AL | 3.0 | 2.0 | 1545 | $1,100 | $0.71 | 43d | 1 | 0.41mi |
| 1556 Burgin Ave Birmingham, AL | 4.0 | 1.0 | 1168 | $1,100 | $0.94 | 19d | 1 | 0.41mi |
| 1556 Burgin Ave Birmingham, AL | 3.0 | 1.0 | 1168 | $1,100 | $0.94 | 21d | 1 | 0.41mi |
| 5516 Avenue P Birmingham, AL | 2.0 | 1.0 | 888 | $1,000 | $1.13 | 43d | 1 | 0.42mi |
| 5717 Avenue O Unit O Birmingham, AL | 3.0 | 2.0 | 1029 | $1,250 | $1.21 | 43d | 1 | 0.43mi |
| 5300 Avenue I Birmingham, AL | 4.0 | 2.0 | 1360 | $1,500 | $1.10 | 2d | 1 | 0.43mi |
| 829 51st Street Ensley Birmingham, AL | 3.0 | 1.0 | 1203 | $1,340 | $1.11 | 3d | 1 | 0.44mi |
| 1632 51st St W Birmingham, AL | 3.0 | 1.0 | 1337 | $1,000 | $0.75 | 2d | 1 | 0.44mi |
| 1632 51st Street Ensley Unit ENSLEY Birmingham, AL | 3.0 | 1.0 | 1337 | $1,100 | $0.82 | 43d | 1 | 0.45mi |
| 1515 45th Street Ensley Unit ENSLEY Birmingham, AL | 3.0 | 1.0 | 1440 | $875 | $0.61 | 3d | 1 | 0.45mi |
| 5725 Avenue O Unit O Birmingham, AL | 3.0 | 1.0 | 957 | $1,073 | $1.12 | 23d | 1 | 0.45mi |
| 1606 49th Street Ensley Unit ENSLEY Birmingham, AL | 3.0 | 2.0 | 1136 | $1,100 | $0.97 | 43d | 1 | 0.47mi |
| 920 47th Street Ensley Birmingham, AL | 3.0 | 1.0 | 1070 | $895 | $0.84 | 3d | 1 | 0.48mi |
| 1509 44th Street Ensley Unit ENSLEY Birmingham, AL | 3.0 | 1.5 | 1260 | $1,123 | $0.89 | 11d | 1 | 0.50mi |
| 5713 Avenue P Unit P Birmingham, AL | 3.0 | 1.0 | 1300 | $1,100 | $0.85 | 19d | 1 | 0.51mi |
| 1436 44th Street Ensley Unit ENSLEY Birmingham, AL | 4.0 | 2.0 | 1435 | $1,495 | $1.04 | 1d | 1 | 0.51mi |
| 5808 Court O Birmingham, AL | 3.0 | 1.5 | 1227 | $1,100 | $0.90 | 43d | 1 | 0.52mi |
| 5709 Court H Birmingham, AL | 4.0 | 1.5 | 1455 | $1,400 | $0.96 | 1d | 1 | 0.55mi |
| 1340 Pineview Rd Birmingham, AL | 3.0 | 2.0 | 1116 | $1,075 | $0.96 | 43d | 1 | 0.57mi |
| 5219 Court Q Birmingham, AL | 3.0 | 2.0 | 1082 | $1,200 | $1.11 | 19d | 1 | 0.57mi |
| 5219 Court G Unit G Fairfield, AL | 3.0 | 1.0 | 1140 | $950 | $0.83 | 23d | 1 | 0.57mi |
| 1604 44th Street Ensley Unit ENSLEY Birmingham, AL | 3.0 | 1.0 | 1100 | $1,200 | $1.09 | 23d | 1 | 0.59mi |
| 813 46th St Fairfield, AL | 2.0 | 1.0 | 1100 | $825 | $0.75 | 10d | 1 | 0.59mi |
| 1341 Pineview Rd Birmingham, AL | 4.0 | 2.0 | 1409 | $1,300 | $0.92 | 43d | 1 | 0.60mi |
| 5406 Court G Unit G Fairfield, AL | 3.0 | 2.0 | 1449 | $1,199 | $0.83 | 11d | 1 | 0.61mi |
| 4619 Terrace Q Birmingham, AL | 3.0 | 2.0 | 1198 | $900 | $0.75 | 43d | 1 | 0.61mi |
| 5320 Ter Q Unit Q Birmingham, AL | 3.0 | 2.0 | 1116 | $1,250 | $1.12 | 43d | 1 | 0.62mi |
| 1607 43rd Street Ensley Unit ENSLEY Birmingham, AL | 3.0 | 2.0 | 1435 | $1,150 | $0.80 | 23d | 1 | 0.63mi |
| 5503 Myron Massey Blvd Fairfield, AL | 3.0 | 2.0 | 1119 | $1,200 | $1.07 | 43d | 1 | 0.65mi |
| 1526 42nd Street Ensley Unit ENSLEY Birmingham, AL | 4.0 | 1.5 | 1600 | $1,050 | $0.66 | 43d | 1 | 0.66mi |
| 1757 48th Street Ensley Unit ENSLEY Birmingham, AL | 4.0 | 2.0 | 1164 | $1,295 | $1.11 | 3d | 1 | 0.67mi |
Listing history 2 events
-
2026-06-17remarks 687-char remark
-
2026-06-17$84,900 Active 1 DOM
ⓘ Source: listings_history table (triggers on properties + properties_extension) + one-shot
backfill from property_details.listing_events for pre-trigger history.
Tax reassessment forecast AL · Resets to sale price
- Current annual tax
- $1,369 · $114/mo
- Projected year-2 tax
- $1,369 · $114/mo
- Expected delta
- $0/yr ($0/mo · 0.0%)
ⓘ Screening estimate from a state-policy table — verify with the county assessor before closing.
Climate risk First Street
- Flood 1/10 Low FEMA zone X (unshaded) · 0% chance over 30 yrs
- Wildfire 1/10 Low
- Heat 6/10 Major 7 d/yr ≥108°F today · 19 d/yr by 30 yrs out
- Wind 6/10 Major 27% chance of damaging wind over 30 yrs
- Air quality 4/10 Moderate 5 unhealthy d/yr today · 5 by 30 yrs out
Nearby sold comps map
Loading sold comps map…
Walkable amenities ~0.75 mi
Loading nearby amenities…
Taxation est. · year 1
- Rental income
- $14,387
- − Mortgage interest
- −$4,756
- − Property taxes
- −$1,369
- − Insurance
- −$424
- − Repairs & maintenance
- −$1,151
- − Management
- −$1,151
- − Depreciation
- −$2,470
- Taxable income
- $3,066
- Est. tax owed @ 24.0%
- −$736
- After-tax cash flow
- $3,494/yr
For passive investors: Depreciation is non-cash, so a rental often shows a tax loss while cash-flowing — sheltering income. Rental losses are passive: they offset passive income freely, and up to $25,000/yr can offset ordinary (W-2) income if you actively participate and your MAGI is under $100k (phasing out to $0 by $150k); unused losses carry forward. On sale, claimed depreciation is recaptured at up to 25%, and gains may owe capital-gains tax (a 1031 exchange can defer both). Figures are a year-1 estimate at your 24.0% rate — not tax advice; consult a CPA.
Schools (NCES district)
- District
- Birmingham City
- NCES district ID
- 0100390
- Math proficiency
- 4% ▼ -17.00%
- Reading proficiency
- 20% ▼ -4.00%
- Median HH income
- $31,988
- Composite
- 9.49/100
- National rank
- #9850
- State rank
- #116 of 129 in AL
Livability — Birmingham
- Score
- 67/100
- State rank
- #78
- US rank
- #10412
Category grades
Schools grade is shown separately in the Schools card above.
Census & demographics
- Census place
- Birmingham, AL
- County
- Jefferson County · 527,445 people
- City population
- 210,422
- Metro
- Birmingham-Hoover, AL
- Population (ZIP)
- 13,412
- Household income
- $38,561
- Rent vs Own
- Severe rent burden
- 573.0
Population outlook (Jefferson County) Hauer SSP2
- Today (2025)
- 669,185 people
- By 2030
- 669,694 · +0.1%
- By 2040
- 661,388 · -1.2%
- By 2050
- 643,086 · -3.9%
- By 2075
- 577,267 · -13.7%
- By 2100
- 474,758 · -29.1%
Race, ethnicity, and origin ACS 2023
- Neighborhood character
- Predominantly Black (94%)
- Race & ethnicity
- Black 94% White 4% Hispanic / Latino 2% Two or more races 1%
- Foreign-born
- 3% · Canada
- Languages at home
- 96% English-only · Spanish 2%
Political lean MEDSL · Jefferson
- 2024 margin
- D (+10.4) · D 54.6% · R 44.2% · Other 1.2%
- 2008→2024 swing
- +5.4pp toward D · 2008: 5.1pp · 2024: 10.4pp
- All cycles
- 2024: D+10.4 2020: D+13.2 2016: D+7.2 2012: D+6.0 2008: D+5.1
Not yet ingested
- Civics
- —
Market trends
- HPI YoY
- ▼ -33.99%
- Current HPI
- 153.414
- Rent YoY
- ▲ 7.24%
- Metro
- Birmingham-Hoover, AL
- State GDP YoY
- ▲ 2.94%
- F500 in state
- 4
Industry mix (Fortune 500 HQ in AL)
| Industry | F500 HQs | Revenue |
|---|---|---|
| Financial Services | 1 | $8B |
|
||
| Healthcare | 1 | $5B |
|
||
Price history
+226.5% since first listed2 events — show timeline
- 2026-06-17 Listed $84,900 Greater Alabama MLS
- 1986-12-03 Sold (Public Records) $26,000 Public Records
Property tax history
+3.6%/yrLatest (2025): $1,369 · +0.0% YoY. Source: county tax records.
Cash-flow waterfall
monthlySold comps — $/sqft
last 12 mo · ≤1 miLoading sold comps…