 63-Plex
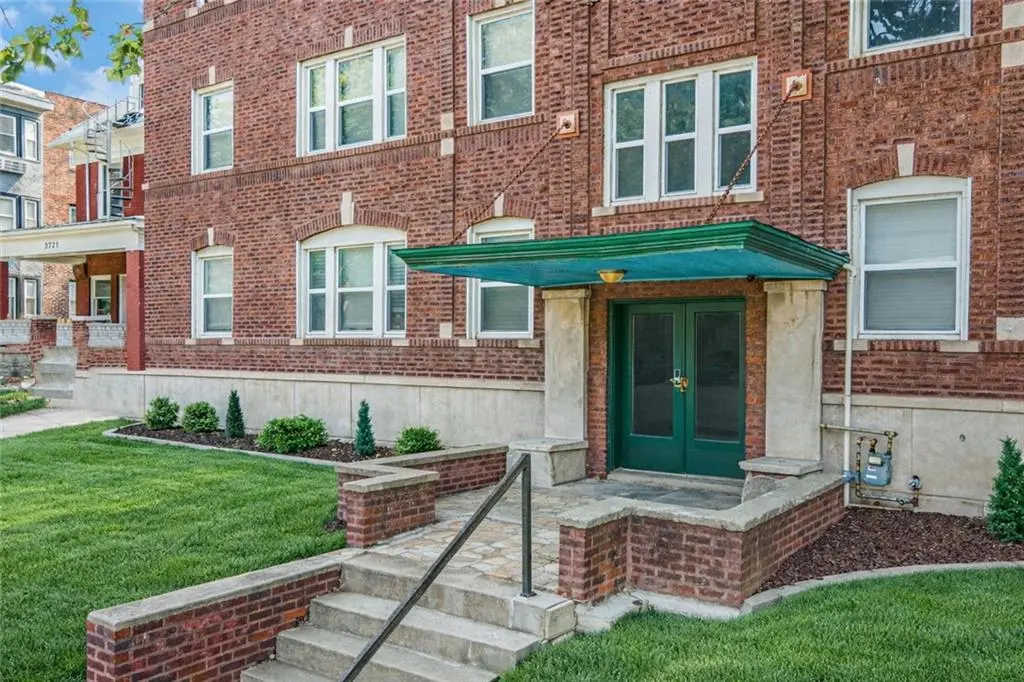
3732 Southwest Trfy · Kansas City, MO
Flood risk 1/10 · Minimal
- FEMA flood zone
- X (unshaded)
- Chance of flooding over 30 yrs
- 0.0%
- Est. flood insurance / yr
- $507 – $1,088
Fire risk 1/10 · Minimal
- Est. fire insurance / yr
- $1,054 – $1,958
Heat risk 4/10 · Minor
- Hot days now (above 106°F)
- 7 days/yr
- Hot days in 30 yrs
- 17 days/yr
Wind risk 2/10 · Minimal
- Chance of severe wind over 30 yrs
- —
Air-quality risk 3/10 · Minor
- Unhealthy air days now
- 2 days/yr
- Unhealthy air days in 30 yrs
- 3 days/yr
Risk factors via First Street. Map © Google.
Why this score? — see what drove the D+ grade
The composite is a weighted blend of 9 inputs, each scored 0–100. Each bar is that input's sub-score; the figure is the points it added to the 100-point composite (weight × sub-score).
- Cash flow +19.6/30.0
- ARV discount +7.5/15.0
- DSCR +6.2/10.0
- 1% rule +5.2/10.0
- Livability +3.9/5.0
- Rent growth +3.4/5.0
- Condition / age +2.5/5.0
- Schools +1.5/10.0
- Appreciation +0.0/10.0
$6,550,000
🖨 Deal sheet 📄 Offer letter ✓ Due diligence
Multi-family units
County records classify this as Multi-Family (5+ Unit). Listing-text estimate: 63 units. confirmed
5+ unit building — per-unit beds/baths from public records are typically unavailable; the breakdown below (if shown) is an estimate from the listing text.
Listing remarks MLS
The Madelyn is an exceptional 63-unit investment opportunity in the heart of Kansas City’s vibrant Valentine neighborhood, where historic charm complements modern updates and walkability. This package spans seven buildings with off-street parking lots, originally constructed in 1923 and meticulously maintained and updated. All of the buildings have new windows, new electrical, new plumbing, and central heat and air. The Madelyn features a mix of one- and two-bedroom units, with renovated spaces boasting modernized kitchens, stainless appliances, quartz countertops, and designer tile in kitchens and bathrooms. Charming original hardwood floors add warmth and charm, complemented by light streaming through oversized replacement windows. 30% of the units have been upgraded to a luxury standard within the last five years, and each building includes its own coin-operated laundry room for tenant convenience. The neighborhood is highly walkable with a Walk Score of 88 and is strategically located minutes from major employers and medical hubs, including KU Medical, less than a mile away, and Children’s Mercy Hospital, under three miles from your doorstep—the city’s largest hospital and second-largest employer, respectively. Just 1.6 miles from the iconic Country Club Plaza, residents enjoy proximity to upscale shopping, dining, and entertainment, with the bars and eateries of Valentine and Westport within easy walking distance. Offering ample parking and a prime location, this 63-unit package presents investors with a rare chance to acquire an irreplaceable multifamily asset with significant income upside in one of Kansas City’s most desirable neighborhoods.
Key facts
- Renovated spaces
- New plumbing
- Central heat and air
Tags
Neighborhood map
What this means for you Summary
Snapshot
- This is a 31×1bd/1ba + 32×2bd/1ba units multifamily listed at $6.55M.
Deal economics
- At list price, monthly cash flow is $8k ($90k/yr) — positive. Per door: $119/mo.
- The deal already cash-flows at list — no discount required.
- Meets the 1% rule at list price ($67k rent vs $6.55M).
- Recommended offer: $6.16M (6.0% below list) — sets the bar for market timing.
- Cap rate 7.7% vs local median 3.9% in Kansas City — top-decile yield for the area; either an underpriced asset or a hidden risk that comps aren't pricing in. Stress-test before assuming the spread holds.
Location & tenants
- Location reads 78/100 on livability (#28 in MO, #2,671 nationally) — a middle-class / working-renter tenant base. Strengths: amenities A+, commute A+, cost of living A+; Watch: schools C-, crime F.
- Kansas City 33 (urban): math 12% / reading 24% proficiency, ranked #308 of 324 in MO (top 95%) — low school quality limits family demand, transient renter base, plan for 1-2y turnover; 75% free/reduced lunch — lower-income household profile, screen leases tightly.
- Market conditions: Rents rising (+3.4%/yr); 162 active listings in the ZIP; 4,002 units permitted in Jackson County in 2024 (2,271 in 5+ unit buildings).
- At $66,796/mo this rent would consume 1299% of the median local household income ($62k/yr) (locally 1606% of renters already pay >50% of income on rent) — very limited rent-growth headroom before tenants either downsize or default.
Forward outlook
- Local home prices are declining (-3.0%/yr); year-one equity from $45k of loan paydown is wiped out by about $196k of value loss. Plan a longer hold.
- Jackson County population projected at +4% by 2050 — modest demand growth; plan on rents tracking national, not racing it.
Negotiation context
- It's been on market 76 days — a 6% lower offer ($6.16M) is reasonable based on typical stale-listing flexibility.
Risks & watch-outs
- Watch-outs: built in 1923 — expect roof / HVAC / electrical / plumbing capex.
Questions for the listing agent
- It's been on market 76 days. Have you received any prior offers? Is the seller open to a 6% concession, seller financing, or rate buy-down credit?
- Can we see the unit-by-unit rent roll, current vacancy, and any below-market leases? What's the average tenancy length?
- What capital expenditures (roof, boiler, parking lot, exteriors) have been made in the last 5 years, and what's planned in the next 2?
- Built in 1923 — when were the roof, HVAC, electrical panel, plumbing, and water heater last replaced?
- Why hasn't it sold? Are there any deal-killer items the seller is aware of (foundation, flood, title, zoning, code violations)?
- Is there a deadline driving the sale (1031 exchange, divorce, estate, relocation)? That informs how much negotiation room exists.
- Crime grade is F in this area — have there been break-ins, vandalism, or insurance claims at this property in the last 3 years? What carrier currently insures it and at what premium?
- The area grade is low — what's the realistic commute time and amenity access for the typical tenant pool here? Any planned neighborhood developments (good or bad) we should know about?
- What's the average days-on-market for RENTAL listings here right now (not sales)? A rising rental-DOM trend means longer vacancies and softer asking-rent achievability than the comps imply.
- What's the recent tenant-quality profile in this submarket — average credit score on applications, eviction rate, late-payment / NSF rate, and stable-employment percentage? A property-management company in the area should have these aggregated.
- How much new apartment / multifamily construction is in the pipeline within 1–3 miles? Heavy new supply (>2% of stock underway) typically softens rents 12–24 months out; light construction supports rent growth.
Investment metrics
- 1% rule
- 1.02% ✓
- Cap rate
- 7.67%
- Cash-on-cash
- 4.91%
- DSCR
- 1.22
- GRM
- 8.2
CMA / ARV
- ARV (median comp)
- $534,977
- List price
- $6,550,000
- Delta
- 1124.35%
- Verdict
- OVERPRICED
- Comps
- 20 within 1.0 mi
Projected returns pro-forma
-3.0% appreciation · 3.42% rent growth · sell at horizon
- IRR
- -8.2%
- Equity multiple
- 0.70×
- Total profit
- $-554,142
- Equity at exit
- $976,626
- IRR
- 1.9%
- Equity multiple
- 1.14×
- Total profit
- $254,221
- Equity at exit
- $566,324
Cash invested: $1,834,000 (down + closing). Projections, not guarantees.
Landlord ↔ Tenant lean methodology
- Overall (STATE)
- 81 Strongly Landlord-Friendly
- State Missouri
- 81 Strongly Landlord-Friendly · R+10
- County
- — inherits STATE
- City
- — inherits STATE
ZIP-level market 64111
- Rents YoY
- 3.4%
- Active inventory
- 162
- Price-to-rent
- 531.6×
Monthly cashflow live
- Estimated rent
- $66,796 high interval (Pro) →
- Mortgage (P&I)
- −$34,349
- Tax est. 1.5%
- −$8,188 /mo · $98,250/yr
- Insurance
- −$2,729
- HOA
- −$0
- Vacancy / Maint / Mgmt
- −$14,027
- Net cashflow
- $7,503
Break-even live
63-unit breakdown (identical units grouped — click to expand)
| Units | Beds | Baths | Est. rent |
|---|---|---|---|
| 31× units | 1 | 1 | $31,837 |
| #1 | 1 | 1 | $1,027 |
| #2 | 1 | 1 | $1,027 |
| #3 | 1 | 1 | $1,027 |
| #4 | 1 | 1 | $1,027 |
| #5 | 1 | 1 | $1,027 |
| #6 | 1 | 1 | $1,027 |
| #7 | 1 | 1 | $1,027 |
| #8 | 1 | 1 | $1,027 |
| #9 | 1 | 1 | $1,027 |
| #10 | 1 | 1 | $1,027 |
| #11 | 1 | 1 | $1,027 |
| #12 | 1 | 1 | $1,027 |
| #13 | 1 | 1 | $1,027 |
| #14 | 1 | 1 | $1,027 |
| #15 | 1 | 1 | $1,027 |
| #16 | 1 | 1 | $1,027 |
| #17 | 1 | 1 | $1,027 |
| #18 | 1 | 1 | $1,027 |
| #19 | 1 | 1 | $1,027 |
| #20 | 1 | 1 | $1,027 |
| #21 | 1 | 1 | $1,027 |
| #22 | 1 | 1 | $1,027 |
| #23 | 1 | 1 | $1,027 |
| #24 | 1 | 1 | $1,027 |
| #25 | 1 | 1 | $1,027 |
| #26 | 1 | 1 | $1,027 |
| #27 | 1 | 1 | $1,027 |
| #28 | 1 | 1 | $1,027 |
| #29 | 1 | 1 | $1,027 |
| #30 | 1 | 1 | $1,027 |
| #31 | 1 | 1 | $1,027 |
| 32× units | 2 | 1 | $34,976 |
| #32 | 2 | 1 | $1,093 |
| #33 | 2 | 1 | $1,093 |
| #34 | 2 | 1 | $1,093 |
| #35 | 2 | 1 | $1,093 |
| #36 | 2 | 1 | $1,093 |
| #37 | 2 | 1 | $1,093 |
| #38 | 2 | 1 | $1,093 |
| #39 | 2 | 1 | $1,093 |
| #40 | 2 | 1 | $1,093 |
| #41 | 2 | 1 | $1,093 |
| #42 | 2 | 1 | $1,093 |
| #43 | 2 | 1 | $1,093 |
| #44 | 2 | 1 | $1,093 |
| #45 | 2 | 1 | $1,093 |
| #46 | 2 | 1 | $1,093 |
| #47 | 2 | 1 | $1,093 |
| #48 | 2 | 1 | $1,093 |
| #49 | 2 | 1 | $1,093 |
| #50 | 2 | 1 | $1,093 |
| #51 | 2 | 1 | $1,093 |
| #52 | 2 | 1 | $1,093 |
| #53 | 2 | 1 | $1,093 |
| #54 | 2 | 1 | $1,093 |
| #55 | 2 | 1 | $1,093 |
| #56 | 2 | 1 | $1,093 |
| #57 | 2 | 1 | $1,093 |
| #58 | 2 | 1 | $1,093 |
| #59 | 2 | 1 | $1,093 |
| #60 | 2 | 1 | $1,093 |
| #61 | 2 | 1 | $1,093 |
| #62 | 2 | 1 | $1,093 |
| #63 | 2 | 1 | $1,093 |
| Total (63 units) | $66,796 | ||
UW: 25.0% down · 7.5% · 30yr · 1.5% tax · 5.0% vac · 8.0% maint · 8.0% mgmt
Financing live
Cash to close
- Down payment
- $1,637,500
- Closing costs
- $196,500
- Reserves months
- —
- Total cash needed
- —
Loan-product check · same deal, 3 products live
Conventional
25% down · 7.5% · 30yr
- Down + closing
- —
- Monthly P&I
- —
- Monthly cashflow
- —
- DSCR
- —
- Eligible?
- —
Personal DTI + credit; lowest rate.
DSCR
20% down · 8.5% · 30yr
- Down + closing
- —
- Monthly P&I
- —
- Monthly cashflow
- —
- DSCR
- —
- Eligible?
- —
No personal income docs; deal must DSCR.
Hard money
10% down · 12.0% · 12mo
- Down + closing
- —
- Monthly P&I
- —
- Monthly cashflow
- —
- DSCR
- —
- Eligible?
- —
Short-term bridge; refi at stabilization.
Listing history 17 events
-
2026-06-18days on market $6,550,000 Active 76 DOM
-
2026-06-17days on market $6,550,000 Active 75 DOM
-
2026-06-16days on market $6,550,000 Active 74 DOM
-
2026-06-15days on market $6,550,000 Active 73 DOM
-
2026-06-13days on market $6,550,000 Active 71 DOM
-
2026-06-09days on market $6,550,000 Active 67 DOM
-
2026-06-08days on market $6,550,000 Active 66 DOM
-
2026-06-07days on market $6,550,000 Active 65 DOM
-
2026-06-05days on market $6,550,000 Active 62 DOM
-
2026-06-03days on market $6,550,000 Active 61 DOM
-
2026-06-02days on market $6,550,000 Active 60 DOM
-
2026-06-01days on market $6,550,000 Active 59 DOM
-
2026-05-31days on market $6,550,000 Active 58 DOM
-
2026-04-03$6,550,000 Active 1707-char remark
Show marketing remark (1707 chars)
The Madelyn is an exceptional 63-unit investment opportunity in the heart of Kansas City’s vibrant Valentine neighborhood, where historic charm complements modern updates and walkability. This package spans seven buildings with off-street parking lots, originally constructed in 1923 and meticulously maintained and updated. All of the buildings have new windows, new electrical, new plumbing, and central heat and air. The Madelyn features a mix of one- and two-bedroom units, with renovated spaces boasting modernized kitchens, stainless appliances, quartz countertops, and designer tile in kitchens and bathrooms. Charming original hardwood floors add warmth and charm, complemented by light streaming through oversized replacement windows. 30% of the units have been upgraded to a luxury standard within the last five years, and each building includes its own coin-operated laundry room for tenant convenience. The neighborhood is highly walkable with a Walk Score of 88 and is strategically located minutes from major employers and medical hubs, including KU Medical, less than a mile away, and Children’s Mercy Hospital, under three miles from your doorstep—the city’s largest hospital and second-largest employer, respectively. Just 1.6 miles from the iconic Country Club Plaza, residents enjoy proximity to upscale shopping, dining, and entertainment, with the bars and eateries of Valentine and Westport within easy walking distance. Offering ample parking and a prime location, this 63-unit package presents investors with a rare chance to acquire an irreplaceable multifamily asset with significant income upside in one of Kansas City’s most desirable neighborhoods.
-
2001-08-06soldstatus
-
2001-08-06soldstatus
-
1986-01-14soldstatus
ⓘ Source: listings_history table (triggers on properties + properties_extension) + one-shot
backfill from property_details.listing_events for pre-trigger history.
Climate risk First Street
- Flood 1/10 Low FEMA zone X (unshaded) · 0% chance over 30 yrs
- Wildfire 1/10 Low
- Heat 4/10 Moderate 7 d/yr ≥106°F today · 17 d/yr by 30 yrs out
- Wind 2/10 Low
- Air quality 3/10 Moderate 2 unhealthy d/yr today · 3 by 30 yrs out
Nearby sold comps map
Loading sold comps map…
Walkable amenities ~0.75 mi
Loading nearby amenities…
Taxation est. · year 1
- Rental income
- $801,552
- − Mortgage interest
- −$366,902
- − Property taxes
- −$98,250
- − Insurance
- −$32,750
- − Repairs & maintenance
- −$64,124
- − Management
- −$64,124
- − Depreciation
- −$190,545
- Taxable loss
- −$15,144
- Est. tax savings @ 24.0%
- +$3,634
- After-tax cash flow
- $93,674/yr
For passive investors: Depreciation is non-cash, so a rental often shows a tax loss while cash-flowing — sheltering income. Rental losses are passive: they offset passive income freely, and up to $25,000/yr can offset ordinary (W-2) income if you actively participate and your MAGI is under $100k (phasing out to $0 by $150k); unused losses carry forward. On sale, claimed depreciation is recaptured at up to 25%, and gains may owe capital-gains tax (a 1031 exchange can defer both). Figures are a year-1 estimate at your 24.0% rate — not tax advice; consult a CPA.
Schools (NCES district)
- District
- Kansas City 33
- NCES district ID
- 2916400
- Math proficiency
- 12% ▼ -8.00%
- Reading proficiency
- 24% ▬ 0.00%
- Median HH income
- $35,227
- Composite
- 14.8/100
- National rank
- #9387
- State rank
- #308 of 324 in MO
Livability — Kansas City
- Score
- 78/100
- State rank
- #28
- US rank
- #2671
Category grades
Schools grade is shown separately in the Schools card above.
Census & demographics
- Census place
- Kansas City, MO
- County
- Jackson County · 687,798 people
- City population
- 439,467
- Metro
- Kansas City, MO-KS
- Population (ZIP)
- 16,887
- Household income
- $61,729
- Rent vs Own
- Severe rent burden
- 1606.0
Population outlook (Jackson County) Hauer SSP2
- Today (2025)
- 719,589 people
- By 2030
- 731,456 · +1.6%
- By 2040
- 746,689 · +3.8%
- By 2050
- 749,289 · +4.1%
- By 2075
- 736,227 · +2.3%
- By 2100
- 668,210 · -7.1%
Race, ethnicity, and origin ACS 2023
- Neighborhood character
- Predominantly White (70%)
- Race & ethnicity
- White 70% Hispanic / Latino 10% Black 10% Two or more races 9% Asian 3%
- Hispanic origin (detail)
- Mexican 8%
- Common ancestry
- Lithuanian 3% Slovak 2% Serbian 2%
- Foreign-born
- 6% · Canada, China
- Languages at home
- 90% English-only · Spanish 5% Other Asian/Pacific 1% Chinese 1%
Political lean MEDSL · Jackson
- 2024 margin
- D (+19.3) · D 58.9% · R 39.5% · Other 1.6%
- 2008→2024 swing
- -6.1pp toward R · 2008: 25.4pp · 2024: 19.3pp
- All cycles
- 2024: D+19.3 2020: D+22.0 2016: D+16.6 2012: D+19.0 2008: D+25.4
Not yet ingested
- Civics
- —
Market trends
- HPI YoY
- ▼ -341.84%
- Current HPI
- 282.068
- Rent YoY
- ▲ 3.42%
- Metro
- Kansas City, MO-KS
- State GDP YoY
- ▲ 1.84%
- F500 in state
- 20
Industry mix (Fortune 500 HQ in MO)
| Industry | F500 HQs | Revenue |
|---|---|---|
| Healthcare | 1 | $163B |
|
||
| Insurance | 1 | $21B |
|
||
| Industrial Technology | 1 | $17B |
|
||
| Retail | 1 | $16B |
|
||
| Industrial Distribution | 1 | $10B |
|
||
| Utilities | 1 | $9B |
|
||
Price history
4 events — show timeline
- 2026-04-03 Listed $6,550,000 Heartland MLS as Distributed by MLS Grid
- 2001-08-06 Sold (Public Records) — Public Records
- 2001-08-06 Sold (Public Records) — Public Records
- 1986-01-14 Sold (Public Records) — Public Records
Property tax history
+6.4%/yrLatest (2025): $3,773 · +4.1% YoY. Source: county tax records.
Cash-flow waterfall
monthlySold comps — $/sqft
last 12 mo · ≤1 miLoading sold comps…