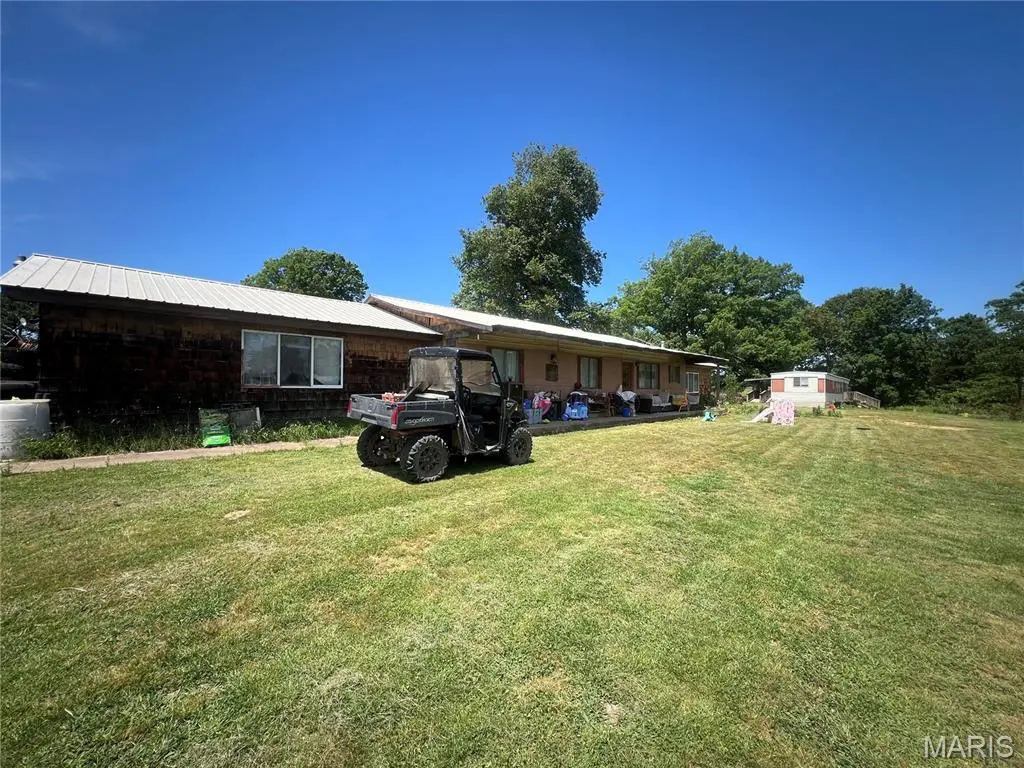
7687 Ripley Route A · Maynard, AR
Flood risk 1/10 · Minimal
- FEMA flood zone
- X (unshaded)
- Chance of flooding over 30 yrs
- 0.0%
- Est. flood insurance / yr
- $473 – $860
Fire risk 5/10 · Moderate
- Est. fire insurance / yr
- $1,054 – $1,958
Heat risk 6/10 · Moderate
- Hot days now (above 108°F)
- 7 days/yr
- Hot days in 30 yrs
- 21 days/yr
Wind risk 4/10 · Minor
- Chance of severe wind over 30 yrs
- 9.0%
Air-quality risk 2/10 · Minimal
- Unhealthy air days now
- 0 days/yr
- Unhealthy air days in 30 yrs
- 1 days/yr
Risk factors via First Street. Map © Google.
Why this score? — see what drove the D grade
The composite is a weighted blend of 9 inputs, each scored 0–100. Each bar is that input's sub-score; the figure is the points it added to the 100-point composite (weight × sub-score).
- Cash flow +12.0/30.0
- Appreciation +7.6/10.0
- ARV discount +7.5/15.0
- DSCR +3.5/10.0
- Livability +2.8/5.0
- Schools +2.7/10.0
- Rent growth +2.5/5.0
- Condition / age +2.5/5.0
- 1% rule +2.2/10.0
$179,900
🖨 Deal sheet (PDF) 📄 Offer letter ✓ Due diligence
Listing remarks
Country Living With Multi-Generational Potential on 6 Acres Bring your horses, start your garden, and enjoy peaceful country living with this versatile 6-acre property, fenced and cross-fenced pasture, and direct access from paved state highway A. The home offers approximately 1,828 square feet with 4 bedrooms and 1.5 baths. Inside, you’ll find a spacious family room, separate laundry room, central heat and air, and a durable 50-year metal roof. Major updates include an air conditioner that is only 6 years old and a well pump and holding tank replaced just 2 years ago. Outside, the acreage is already set up for country life with fenced pasture, a horse(not included) already enjoying t
Key facts
- Durable metal roof
- Updated mobile home
- Garden area
Tags
Property features AI
Finance
- Financial info: $559 annual tax (2025)
Exterior
- Utilities: Well water; Septic tank; Electricity (220 volts); Propane available; Phone connected; Electricity connected; Water connected; Sewer connected
- Home design: Single-family residential; One level
- Construction: Shake siding
- Exterior features: Adjoins open ground; Farm frontage; Few trees; Level ground; Pasture
Interior
- Bedrooms: Four bedrooms on the main level
- Bathrooms: One full bathroom and one half bathroom on the main level (2 total)
- Heating & cooling: Electric heating; Central air conditioning
- Interior features: Gas fireplace (1)
Neighborhood map
What this means for you Summary
Snapshot
- This is a 4-bed/1.5-bath other listed at $180k.
Deal economics
- At list price, monthly cash flow is $-44 ($-525/yr) — negative.
- To cash-flow at today's rent, offer at most $172k (4.3% below list).
- To meet the 1% rule (rent ≥ 1% of price), the offer needs to be $129k (28.1% below list).
- Recommended offer: $129k (28.1% below list) — sets the bar for 1% rule.
Location & tenants
- Location reads 55/100 on livability (#414 in AR) — a working-class tenant base; expect higher turnover. Strengths: cost of living A+, housing B+; Watch: health & safety C-, crime F, amenities F.
- Doniphan R-I (rural): math 27% / reading 39% proficiency, ranked #254 of 324 in MO (top 78%) — families likely to look elsewhere, expect single-tenant / working-renter base with shorter leases; 63% free/reduced lunch — lower-income household profile, screen leases tightly.
- Zoned schools: Doniphan Elem. (378 students, 99% FRL); Doniphan Middle (math 15% / reading 33%, grade F, #326 of 391 statewide, top 84%, 361 students, 99% FRL); Doniphan High (math 54% / reading 57%, grade C, #61 of 521 statewide, top 12%, 476 students, 99% FRL) — zoned schools average 99% FRL vs 63% district-wide (36 pts higher); higher-poverty schools than district average — tighter screening recommended.
Forward outlook
- In year one you build about $10k of equity ($1k loan paydown + $9k appreciation (5.1% local appreciation)).
- Ripley County population projected at -20% by 2050 — secular population decline; favor cash flow + early exit over multi-decade hold.
- At projected returns (5.1% appreciation + 3.0% rent growth), your $50k cash investment doubles in ~5 years — after that, you're playing with house money.
- By year 4, paydown + projected appreciation supports a ~$36k cash-out refi (75% LTV) — recoverable capital for the next deal without selling this one.
Negotiation context
- It's been on market 41 days — a 3% lower offer ($175k) is reasonable based on typical stale-listing flexibility.
Risks & watch-outs
- Climate carrying-cost: moderate wildfire risk; extreme-heat days projected 7→21/yr by 2055 (HVAC capex compounding) — expect insurance premiums to compound above CPI over the hold.
Questions for the listing agent
- What do current leases actually rent for vs. the listed asking? Can we see a recent rent roll and the last 12 months of T-12 income?
- It's been on market 41 days. Have you received any prior offers? Is the seller open to a 28% concession, seller financing, or rate buy-down credit?
- Is there a deadline driving the sale (1031 exchange, divorce, estate, relocation)? That informs how much negotiation room exists.
- Schools are F-rated, which usually means shorter tenancies and higher turnover. Who's the typical renter profile here, and what's been the actual vacancy rate?
- Crime grade is F in this area — have there been break-ins, vandalism, or insurance claims at this property in the last 3 years? What carrier currently insures it and at what premium?
- The area grade is low — what's the realistic commute time and amenity access for the typical tenant pool here? Any planned neighborhood developments (good or bad) we should know about?
- What's the average days-on-market for RENTAL listings here right now (not sales)? A rising rental-DOM trend means longer vacancies and softer asking-rent achievability than the comps imply.
- What's the recent tenant-quality profile in this submarket — average credit score on applications, eviction rate, late-payment / NSF rate, and stable-employment percentage? A property-management company in the area should have these aggregated.
- How much new for-sale + rental construction is in the pipeline within 1–3 miles? Heavy new supply typically softens prices + rents 12–24 months out; constrained supply supports both.
Investment metrics
- 1% rule
- 0.72% ✗
- Cap rate
- 6.00%
- Cash-on-cash
- -1.04%
- DSCR
- 0.95
- GRM
- 11.6
CMA / ARV
No comps found within radius.
Projected returns pro-forma
5.14% appreciation · 3.0% rent growth · sell at horizon
- IRR
- 12.3%
- Equity multiple
- 1.79×
- Total profit
- $40,028
- Equity at exit
- $103,476
- IRR
- 13.3%
- Equity multiple
- 3.43×
- Total profit
- $122,612
- Equity at exit
- $179,864
Cash invested: $50,372 (down + closing). Projections, not guarantees.
Landlord ↔ Tenant lean methodology
- Overall (STATE)
- 92 Strongly Landlord-Friendly
- State Arkansas
- 92 Strongly Landlord-Friendly · R+14
- County
- — inherits STATE
- City
- — inherits STATE
ZIP-level market 63935
- Home prices YoY
- 4.4%
- Price-to-rent
- 11.6×
Monthly cashflow live
- Estimated rent
- $1,293 medium interval (Pro) →
- Mortgage (P&I)
- −$943
- Tax from tax record
- −$47 /mo · $559/yr
- Insurance
- −$75
- HOA
- −$0
- Vacancy / Maint / Mgmt
- −$271
- Net cashflow
- $-44
Break-even live
Sensitivity live
| Price | -10% $58 | -5% $7 | +0% $-44 | +5% $-95 | +10% $-146 |
|---|---|---|---|---|---|
| Rent | -10% $-146 | -5% $-95 | +0% $-44 | +5% $7 | +10% $58 |
| Rate | -1.0pp $47 | -0.5pp $2 | base $-44 | +0.5pp $-90 | +1.0pp $-138 |
UW: 25.0% down · 7.5% · 30yr · 1.5% tax · 5.0% vac · 8.0% maint · 8.0% mgmt
Financing live
Cash to close
- Down payment
- $44,975
- Closing costs
- $5,397
- Reserves months
- —
- Total cash needed
- —
Loan-product check · same deal, 3 products live
Conventional
25% down · 7.5% · 30yr
- Down + closing
- —
- Monthly P&I
- —
- Monthly cashflow
- —
- DSCR
- —
- Eligible?
- —
Personal DTI + credit; lowest rate.
DSCR
20% down · 8.5% · 30yr
- Down + closing
- —
- Monthly P&I
- —
- Monthly cashflow
- —
- DSCR
- —
- Eligible?
- —
No personal income docs; deal must DSCR.
Hard money
10% down · 12.0% · 12mo
- Down + closing
- —
- Monthly P&I
- —
- Monthly cashflow
- —
- DSCR
- —
- Eligible?
- —
Short-term bridge; refi at stabilization.
Listing history 18 events
-
2026-06-22days on market $179,900 Active 41 DOM
-
2026-06-21days on market $179,900 Active 40 DOM
-
2026-06-21days on market $179,900 Active 39 DOM
-
2026-06-18days on market $179,900 Active 37 DOM
-
2026-06-17days on market $179,900 Active 36 DOM
-
2026-06-16days on market $179,900 Active 35 DOM
-
2026-06-15days on market $179,900 Active 34 DOM
-
2026-06-13days on market $179,900 Active 32 DOM
-
2026-06-12days on market $179,900 Active 31 DOM
-
2026-06-09days on market $179,900 Active 28 DOM
-
2026-06-08days on market $179,900 Active 27 DOM
-
2026-06-07days on market $179,900 Active 26 DOM
-
2026-06-07days on market $179,900 Active 25 DOM
-
2026-06-04days on market $179,900 Active 22 DOM
-
2026-06-02days on market $179,900 Active 21 DOM
-
2026-06-01days on market $179,900 Active 20 DOM
-
2026-05-31days on market $179,900 Active 19 DOM
-
2026-05-12$179,900 Active 986-char remark
ⓘ Source: listings_history table (triggers on properties + properties_extension) + one-shot
backfill from property_details.listing_events for pre-trigger history.
Tax reassessment forecast AR · Resets to sale price
- Current annual tax
- $559 · $47/mo
- Projected year-2 tax
- $1,151 · $96/mo
- Expected delta
- +$593/yr (+$49/mo · 106.1%)
ⓘ Screening estimate from a state-policy table — verify with the county assessor before closing.
Climate risk First Street
- Flood 1/10 Low FEMA zone X (unshaded) · 0% chance over 30 yrs
- Wildfire 5/10 Major
- Heat 6/10 Major 7 d/yr ≥108°F today · 21 d/yr by 30 yrs out
- Wind 4/10 Moderate 9% chance of damaging wind over 30 yrs
- Air quality 2/10 Low 0 unhealthy d/yr today · 1 by 30 yrs out
Nearby sold comps map
Loading sold comps map…
Walkable amenities ~0.75 mi
Loading nearby amenities…
Taxation est. · year 1
- Rental income
- $15,512
- − Mortgage interest
- −$10,077
- − Property taxes
- −$559
- − Insurance
- −$900
- − Repairs & maintenance
- −$1,241
- − Management
- −$1,241
- − Depreciation
- −$5,233
- Taxable loss
- −$3,739
- Est. tax savings @ 24.0%
- +$897
- After-tax cash flow
- $373/yr
For passive investors: Depreciation is non-cash, so a rental often shows a tax loss while cash-flowing — sheltering income. Rental losses are passive: they offset passive income freely, and up to $25,000/yr can offset ordinary (W-2) income if you actively participate and your MAGI is under $100k (phasing out to $0 by $150k); unused losses carry forward. On sale, claimed depreciation is recaptured at up to 25%, and gains may owe capital-gains tax (a 1031 exchange can defer both). Figures are a year-1 estimate at your 24.0% rate — not tax advice; consult a CPA.
Schools (NCES district)
- District
- Doniphan R-I
- NCES district ID
- 2910920
- Math proficiency
- 27% ▼ -3.00%
- Reading proficiency
- 39% ▼ -1.00%
- Median HH income
- $31,818
- Composite
- 26.91/100
- National rank
- #7085
- State rank
- #254 of 324 in MO
Livability — Maynard
- Score
- 55/100
- State rank
- #414
- US rank
- #23648
Category grades
Schools grade is shown separately in the Schools card above.
Census & demographics
- Population (ZIP)
- 8,017
Population outlook (Ripley County) Hauer SSP2
- Today (2025)
- 13,011 people
- By 2030
- 12,515 · -3.8%
- By 2040
- 11,512 · -11.5%
- By 2050
- 10,427 · -19.9%
- By 2075
- 7,833 · -39.8%
- By 2100
- 5,692 · -56.3%
Race, ethnicity, and origin ACS 2023
- Neighborhood character
- Predominantly White (93%)
- Race & ethnicity
- White 93% Two or more races 5% Hispanic / Latino 1%
- Common ancestry
- Romanian 3% Slovak 3% Serbian 2%
- Foreign-born
- 1% · Canada
Political lean MEDSL · Ripley
- 2024 margin
- Solid R (+73.0) · D 13.2% · R 86.2%
- 2008→2024 swing
- -43.0pp toward R · 2008: -30.1pp · 2024: -73.0pp
- All cycles
- 2024: R+73.0 2020: R+70.1 2016: R+66.9 2012: R+44.6 2008: R+30.1
Not yet ingested
- Civics
- —
Market trends
- HPI YoY
- ▲ 5.14%
- Current HPI
- 122.3339
- Rent YoY
- —
- Metro
- —
- State GDP YoY
- ▲ 3.80%
- F500 in state
- 10
Industry mix (Fortune 500 HQ in AR)
| Industry | F500 HQs | Revenue |
|---|---|---|
| Retail | 1 | $681B |
|
||
| Food / Agriculture | 1 | $53B |
|
||
| Retail / Energy | 1 | $22B |
|
||
| Transportation / Logistics | 1 | $12B |
|
||
| Energy | 1 | $4B |
|
||
Price history
1 event — show timeline
- 2026-05-12 Listed $179,900 MARIS as Distributed by MLS Grid
Property tax history
+2.2%/yrLatest (2025): $559 · +3.8% YoY. Source: county tax records.
Cash-flow waterfall
monthlySold comps — $/sqft
last 12 mo · ≤1 miLoading sold comps…