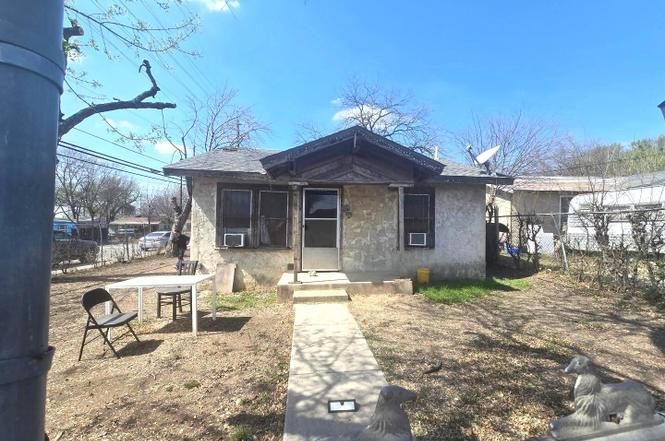
403 N San Felipe · San Antonio, TX
Flood risk 1/10 · Minimal
- FEMA flood zone
- X (unshaded)
- Chance of flooding over 30 yrs
- 0.0%
- Est. flood insurance / yr
- $507 – $1,088
Fire risk 1/10 · Minimal
- Est. fire insurance / yr
- $1,222 – $2,270
Heat risk 8/10 · Major
- Hot days now (above 109°F)
- 7 days/yr
- Hot days in 30 yrs
- 21 days/yr
Wind risk 6/10 · Moderate
- Chance of severe wind over 30 yrs
- 77.0%
Air-quality risk 2/10 · Minimal
- Unhealthy air days now
- 1 days/yr
- Unhealthy air days in 30 yrs
- 1 days/yr
Risk factors via First Street. Map © Google.
Why this score? — see what drove the B- grade
The composite is a weighted blend of 9 inputs, each scored 0–100. Each bar is that input's sub-score; the figure is the points it added to the 100-point composite (weight × sub-score).
- Cash flow +29.8/30.0
- DSCR +10.0/10.0
- 1% rule +8.8/10.0
- ARV discount +7.5/15.0
- Livability +4.0/5.0
- Rent growth +3.7/5.0
- Condition / age +2.5/5.0
- Schools +1.3/10.0
- Appreciation +0.0/10.0
$70,000
🖨 Deal sheet 📄 Offer letter ✓ Due diligence
Listing remarks
Location, Location, Location! Discover the incredible potential of this fixer-upper corner lot, ideally situated just steps away from a reputable school! This property offers not just a house, but a canvas for your dreams to take shape. Perfect for first-time homebuyers, savvy investors, or anyone looking to create their own slice of paradise in a thriving community. Buyer to verify schools
Key facts
- 5,749 sq ft lot
- Built 1940
- Listed 108 days
Property features AI
Finance
- Financial info: Down payment assistance resources available
- HOA & community: Subdivision: LOMA AREA 2 ED
Exterior
- Utilities: Water system; Sewer system; Natural gas available
- Home design: Pre-owned property; Approximate age: 86 years
- Construction: Cedar post foundation; Composition roof
- Exterior features: Siding exterior
Interior
- Kitchen: Stove/Range; Eat-in kitchen (11 x 9)
- Bedrooms: Master bedroom on lower level (11 x 11); Second bedroom (8 x 12)
- Flooring: Linoleum flooring
- Bathrooms: One full bathroom
- Heating & cooling: Natural gas heating; Other heating (see remarks); Other air conditioning (see remarks)
- Interior features: Ceiling fans; Some window coverings remain; Eat-in kitchen; One living area
- Laundry & utility: Washer connection; Dryer connection
Neighborhood map
What this means for you Summary
Snapshot
- This is a 1-bed/1.0-bath single-family listed at $70k.
Deal economics
- At list price, monthly cash flow is $258 ($3k/yr) — positive.
- The deal already cash-flows at list — no discount required.
- Meets the 1% rule at list price ($965 rent vs $70k).
- Recommended offer: $64k (9.0% below list) — sets the bar for market timing.
- Cap rate 10.7% vs local median 3.8% in San Antonio — top-decile yield for the area; either an underpriced asset or a hidden risk that comps aren't pricing in. Stress-test before assuming the spread holds.
Location & tenants
- Location reads 80/100 on livability (#31 in TX, #1,616 nationally) — a professional / high-income tenant draw. Strengths: amenities A+, commute A+, cost of living A+; Watch: crime F.
- Edgewood ISD (urban): math 12% / reading 21% proficiency, ranked #812 of 826 in TX (top 98%) — low school quality limits family demand, transient renter base, plan for 1-2y turnover.
- Zoned schools: Roosevelt El (math 8% / reading 17%, grade F, #4,180 of 4,322 statewide, top 97%, 305 students, 95% FRL); Memorial H S (math 22% / reading 29%, grade F, #1,246 of 1,632 statewide, top 77%, 872 students, 92% FRL) — zoned schools average 93% FRL vs 24% district-wide (69 pts higher); higher-poverty schools than district average — tighter screening recommended.
- Market conditions: Rents rising fast (+4.9%/yr); 91 active listings in the ZIP; 10 comparable units currently listed for rent nearby; rentals at typical pace (median 24d on market — plan ~3-4 weeks tenant-placement turnaround); 8,308 units permitted in Bexar County in 2024 (2,506 in 5+ unit buildings).
Forward outlook
- Local home prices are declining (-3.0%/yr); year-one equity from $484 of loan paydown is wiped out by about $2k of value loss. Plan a longer hold.
- Bexar County population projected at +50% by 2050 — long-run rental-demand tailwind backs the buy-and-hold thesis.
- At projected returns (-3.0% appreciation + 4.9% rent growth), your $20k cash investment doubles in ~7 years — after that, you're playing with house money.
Negotiation context
- It's been on market 108 days — a 9% lower offer ($64k) is reasonable based on typical stale-listing flexibility.
Risks & watch-outs
- Watch-outs: built in 1940 — expect roof / HVAC / electrical / plumbing capex.
- Climate carrying-cost: major wind risk, 77% chance of damaging wind over 30y; extreme-heat days projected 7→21/yr by 2055 (HVAC capex compounding) — expect insurance premiums to compound above CPI over the hold.
Questions for the listing agent
- It's been on market 108 days. Have you received any prior offers? Is the seller open to a 9% concession, seller financing, or rate buy-down credit?
- Built in 1940 — when were the roof, HVAC, electrical panel, plumbing, and water heater last replaced?
- Why hasn't it sold? Are there any deal-killer items the seller is aware of (foundation, flood, title, zoning, code violations)?
- Is there a deadline driving the sale (1031 exchange, divorce, estate, relocation)? That informs how much negotiation room exists.
- Crime grade is F in this area — have there been break-ins, vandalism, or insurance claims at this property in the last 3 years? What carrier currently insures it and at what premium?
- What's the average days-on-market for RENTAL listings here right now (not sales)? A rising rental-DOM trend means longer vacancies and softer asking-rent achievability than the comps imply.
- What's the recent tenant-quality profile in this submarket — average credit score on applications, eviction rate, late-payment / NSF rate, and stable-employment percentage? A property-management company in the area should have these aggregated.
- How much new for-sale + rental construction is in the pipeline within 1–3 miles? Heavy new supply typically softens prices + rents 12–24 months out; constrained supply supports both.
Investment metrics
- 1% rule
- 1.38% ✓
- Cap rate
- 10.71%
- Cash-on-cash
- 15.78%
- DSCR
- 1.70
- GRM
- 6.0
CMA / ARV
No comps found within radius.
Projected returns pro-forma
-3.0% appreciation · 4.92% rent growth · sell at horizon
- IRR
- 8.9%
- Equity multiple
- 1.36×
- Total profit
- $7,003
- Equity at exit
- $10,437
- IRR
- 19.7%
- Equity multiple
- 2.81×
- Total profit
- $35,460
- Equity at exit
- $6,052
Cash invested: $19,600 (down + closing). Projections, not guarantees.
Landlord ↔ Tenant lean methodology
- Overall (STATE)
- 87 Strongly Landlord-Friendly
- State Texas
- 87 Strongly Landlord-Friendly · R+5
- County
- — inherits STATE
- City
- — inherits STATE
ZIP-level market 78228
- Home prices YoY
- -22.1%
- Rents YoY
- 4.9%
- Active inventory
- 91
- Price-to-rent
- 6.0×
Monthly cashflow live
- Estimated rent
- $965 high interval (Pro) →
- Mortgage (P&I)
- −$367
- Tax from tax record
- −$108 /mo · $1,299/yr
- Insurance
- −$29
- HOA
- −$0
- Vacancy / Maint / Mgmt
- −$203
- Net cashflow
- $258
Break-even live
UW: 25.0% down · 7.5% · 30yr · 1.5% tax · 5.0% vac · 8.0% maint · 8.0% mgmt
Financing live
Cash to close
- Down payment
- $17,500
- Closing costs
- $2,100
- Reserves months
- —
- Total cash needed
- —
Loan-product check · same deal, 3 products live
Conventional
25% down · 7.5% · 30yr
- Down + closing
- —
- Monthly P&I
- —
- Monthly cashflow
- —
- DSCR
- —
- Eligible?
- —
Personal DTI + credit; lowest rate.
DSCR
20% down · 8.5% · 30yr
- Down + closing
- —
- Monthly P&I
- —
- Monthly cashflow
- —
- DSCR
- —
- Eligible?
- —
No personal income docs; deal must DSCR.
Hard money
10% down · 12.0% · 12mo
- Down + closing
- —
- Monthly P&I
- —
- Monthly cashflow
- —
- DSCR
- —
- Eligible?
- —
Short-term bridge; refi at stabilization.
Rent comps 10 comps
| Address | Beds | Baths | Sqft | Rent | $/sqft | DOM | Units | Dist |
|---|---|---|---|---|---|---|---|---|
| 2426 Cincinnati Ave San Antonio, TX | 2.0 | 1.0 | 700 | $975 | $1.39 | 23d | 1 | 0.88mi |
| 2503 Arbor Pl San Antonio, TX | 2.0 | 1.0 | 750 | $800 | $1.07 | 43d | 1 | 0.91mi |
| 2331 Cincinnati Ave Unit 2345 04 San Antonio, TX | 1.0 | 1.0 | 750 | $900 | $1.20 | 3d | 1 | 0.96mi |
| 2331 Cincinnati Ave San Antonio, TX | 1.0–3.0 | 1.0 | 850 | $900 | $1.06 | 12d | 3 | 0.98mi |
| 1218 NW 23rd St Unit 2 San Antonio, TX | 1.0 | 10.5 | 548 | $950 | $1.73 | 23d | 1 | 1.12mi |
| 3301 W Woodlawn Ave San Antonio, TX | 1.0–2.0 | 1.0 | 825 | $682 | $0.83 | 23d | 3 | 1.23mi |
| 2825 W Woodlawn Ave Unit 2825-WW San Antonio, TX | 2.0 | 1.0 | 700 | $1,195 | $1.71 | 3d | 1 | 1.25mi |
| 102 E Cheryl Dr San Antonio, TX | 1.0 | 1.0 | 515 | $785 | $1.52 | 16d | 3 | 1.41mi |
| 102 E Cheryl Dr #2 San Antonio, TX | 1.0 | 1.0 | 600 | $800 | $1.33 | 43d | 1 | 1.42mi |
| 1171 Bandera Rd San Antonio, TX | 1.0–2.0 | 1.0 | 750 | $800 | $1.07 | 23d | 5 | 1.49mi |
Listing history 17 events
-
2026-06-18days on market $70,000 Active 108 DOM
-
2026-06-17days on market $70,000 Active 107 DOM
-
2026-06-16days on market $70,000 Active 106 DOM
-
2026-06-15days on market $70,000 Active 105 DOM
-
2026-06-14status $70,000 Active 103 DOM
-
2026-06-13days on market $70,000 Price Change 103 DOM
-
2026-06-12days on market $70,000 Price Change 102 DOM
-
2026-06-09days on market $70,000 Price Change 99 DOM
-
2026-06-08days on market $70,000 Price Change 98 DOM
-
2026-06-08days on market $70,000 Price Change 97 DOM
-
2026-06-07days on market $70,000 Price Change 96 DOM
-
2026-06-04pricestatus $70,000 Price Change 93 DOM
-
2026-06-03days on market $80,000 Active 93 DOM
-
2026-06-02days on market $80,000 Active 92 DOM
-
2026-06-01days on market $80,000 Active 91 DOM
-
2026-05-31remarks 394-char remark
-
2026-05-31$80,000 Active 90 DOM
ⓘ Source: listings_history table (triggers on properties + properties_extension) + one-shot
backfill from property_details.listing_events for pre-trigger history.
Tax reassessment forecast TX · Resets to sale price
- Current annual tax
- $1,299 · $108/mo
- Projected year-2 tax
- $1,299 · $108/mo
- Expected delta
- $0/yr ($0/mo · 0.0%)
ⓘ Screening estimate from a state-policy table — verify with the county assessor before closing.
Climate risk First Street
- Flood 1/10 Low FEMA zone X (unshaded) · 0% chance over 30 yrs
- Wildfire 1/10 Low
- Heat 8/10 Severe 7 d/yr ≥109°F today · 21 d/yr by 30 yrs out
- Wind 6/10 Major 77% chance of damaging wind over 30 yrs
- Air quality 2/10 Low 1 unhealthy d/yr today · 1 by 30 yrs out
Nearby sold comps map
Loading sold comps map…
Walkable amenities ~0.75 mi
Loading nearby amenities…
Taxation est. · year 1
- Rental income
- $11,580
- − Mortgage interest
- −$3,921
- − Property taxes
- −$1,299
- − Insurance
- −$350
- − Repairs & maintenance
- −$926
- − Management
- −$926
- − Depreciation
- −$2,036
- Taxable income
- $2,120
- Est. tax owed @ 24.0%
- −$509
- After-tax cash flow
- $2,585/yr
For passive investors: Depreciation is non-cash, so a rental often shows a tax loss while cash-flowing — sheltering income. Rental losses are passive: they offset passive income freely, and up to $25,000/yr can offset ordinary (W-2) income if you actively participate and your MAGI is under $100k (phasing out to $0 by $150k); unused losses carry forward. On sale, claimed depreciation is recaptured at up to 25%, and gains may owe capital-gains tax (a 1031 exchange can defer both). Figures are a year-1 estimate at your 24.0% rate — not tax advice; consult a CPA.
Schools (NCES district)
- District
- Edgewood ISD
- NCES district ID
- 4818150
- Math proficiency
- 12% ▼ -18.00%
- Reading proficiency
- 21% ▼ -5.00%
- Median HH income
- $27,419
- Composite
- 12.82/100
- National rank
- #9597
- State rank
- #812 of 826 in TX
Livability — San Antonio
- Score
- 80/100
- State rank
- #31
- US rank
- #1616
Category grades
Schools grade is shown separately in the Schools card above.
Census & demographics
- Census place
- San Antonio, TX
- County
- Bexar County · 1,990,555 people
- City population
- 1,806,925
- Metro
- San Antonio-New Braunfels, TX
- Population (ZIP)
- 56,165
- Household income
- $52,976
- Rent vs Own
- Severe rent burden
- 2709.0
Population outlook (Bexar County) Hauer SSP2
- Today (2025)
- 2,336,851 people
- By 2030
- 2,560,728 · +9.6%
- By 2040
- 3,020,569 · +29.3%
- By 2050
- 3,493,522 · +49.5%
- By 2075
- 4,668,459 · +99.8%
- By 2100
- 5,533,242 · +136.8%
Race, ethnicity, and origin ACS 2023
- Neighborhood character
- Predominantly Hispanic (88%)
- Race & ethnicity
- Hispanic / Latino 88% Two or more races 43% White 8% Black 2%
- Hispanic origin (detail)
- Mexican 80%
- Common ancestry
- Italian 1% Lithuanian 1%
- Foreign-born
- 15% · Canada
- Languages at home
- 46% English-only · Spanish 53% Other Indo-European 1%
Political lean MEDSL · Bexar
- 2024 margin
- Lean D (+9.8) · D 54.3% · R 44.6% · Other 1.1%
- 2008→2024 swing
- +4.2pp toward D · 2008: 5.6pp · 2024: 9.8pp
- All cycles
- 2024: D+9.8 2020: D+18.2 2016: D+13.5 2012: D+4.6 2008: D+5.6
Not yet ingested
- Civics
- —
Market trends
- HPI YoY
- ▼ -74.04%
- Current HPI
- 261.1558
- Rent YoY
- ▲ 4.92%
- Metro
- San Antonio-New Braunfels, TX
- State GDP YoY
- ▲ 3.95%
- F500 in state
- 110
Industry mix (Fortune 500 HQ in TX)
| Industry | F500 HQs | Revenue |
|---|---|---|
| Energy | 16 | $1,198B |
|
||
| Technology | 5 | $198B |
|
||
| Engineering / Construction | 4 | $72B |
|
||
| Energy Services | 3 | $60B |
|
||
| Utilities | 3 | $41B |
|
||
| Healthcare | 2 | $330B |
|
||
Price history
1 event — show timeline
- 2026-03-02 Listed $80,000 LERA
Property tax history
+3.5%/yrLatest (2025): $1,299 · +10.0% YoY. Source: county tax records.
Cash-flow waterfall
monthlySold comps — $/sqft
last 12 mo · ≤1 miLoading sold comps…