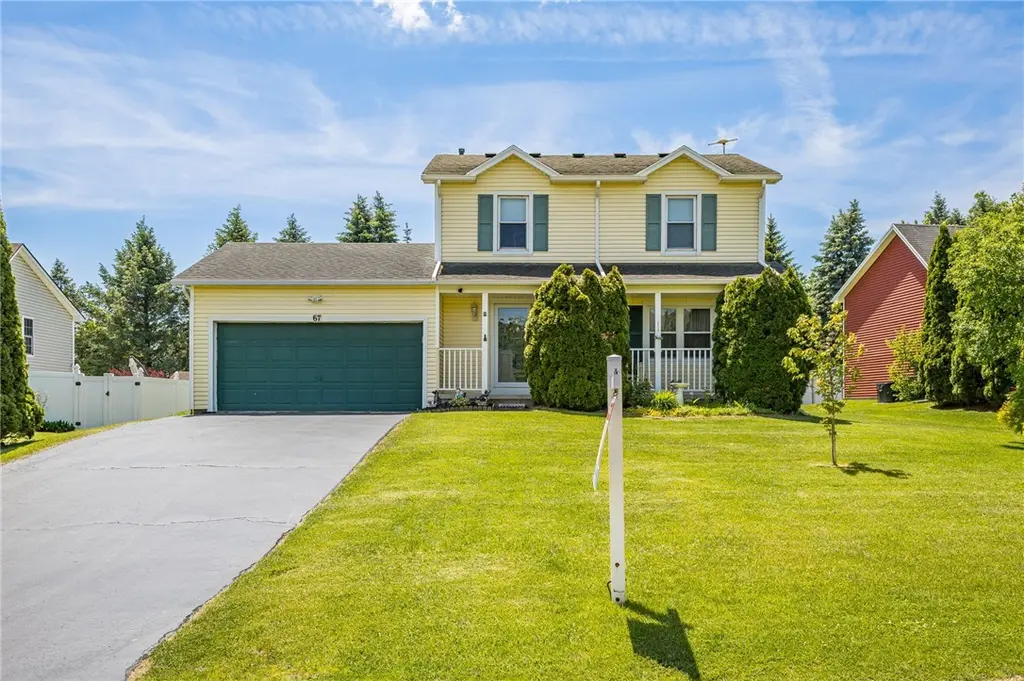
67 Grangerford · Scottsville, NY
Flood risk 1/10 · Minimal
- FEMA flood zone
- X (unshaded)
- Chance of flooding over 30 yrs
- 0.0%
- Est. flood insurance / yr
- $473 – $860
Fire risk 2/10 · Minimal
- Est. fire insurance / yr
- $691 – $1,283
Heat risk 2/10 · Minimal
- Hot days now (above 95°F)
- 7 days/yr
- Hot days in 30 yrs
- 15 days/yr
Wind risk 1/10 · Minimal
- Chance of severe wind over 30 yrs
- —
Air-quality risk 2/10 · Minimal
- Unhealthy air days now
- 1 days/yr
- Unhealthy air days in 30 yrs
- 1 days/yr
Risk factors via First Street. Map © Google.
Why this score? — see what drove the D grade
The composite is a weighted blend of 9 inputs, each scored 0–100. Each bar is that input's sub-score; the figure is the points it added to the 100-point composite (weight × sub-score).
- ARV discount +11.3/15.0
- Cash flow +10.7/30.0
- Schools +5.2/10.0
- 1% rule +3.9/10.0
- Livability +3.6/5.0
- DSCR +3.1/10.0
- Rent growth +2.5/5.0
- Condition / age +2.5/5.0
- Appreciation +0.0/10.0
$249,900
🖨 Deal sheet (PDF) 📄 Offer letter ✓ Due diligence
Listing remarks
Delayed Showings Begin 6/4/26 & Delayed Negotiations to be 6/10/26 @ Noon ~ Solid From Top to Bottom! ~ Great Walkable Neighborhood ~ Updates Include High End Kitchen, Flooring, Windows, HVAC, Roof, Bathrooms etc ~ Just Move In! ~ Large Back Deck ~ Above Ground Pool opened and ready for you to enjoy on closing day ~ Finished Room in basement perfect for Exercise Room, Home Office, Playroom, Guest Room or whatever your needs may be. 12 Minutes or less to URMC / Strong Memorial Hospital, R. I. T, URMC Marketplace facility, Rt 390 and the NYS Thruway Interchange.
Key facts
- Large back deck
- High end kitchen
- Above ground pool
Tags
Property features AI
Exterior
- Parking: Attached garage with garage door opener and electrical; 2 garage spaces
- Utilities: Electricity connected; Public water connected; Sewer connected; Cable available; High-speed internet available
- Home design: Two-story home; Resale property; Vinyl siding
- Construction: Block foundation; Vinyl siding exterior; Existing construction
- Exterior features: Blacktop driveway; Deck; Above-ground pool
Interior
- Kitchen: Appliances negotiable; Solid surface counters
- Bedrooms: Total rooms include office, other room and bonus room (7 rooms total)
- Flooring: Carpet; Luxury vinyl; Varies
- Bathrooms: 1 full bathroom; 1 half bathroom; 1 main-level bathroom
- Heating & cooling: Gas forced air heating; Central air conditioning
- Interior features: Home office; Living/dining room; Solid surface counters; Thermal windows; See remarks / other interior details
- Laundry & utility: Gas water heater
Neighborhood map
What this means for you Summary
Snapshot
- This is a 3-bed/1.5-bath single-family listed at $250k.
Deal economics
- At list price, monthly cash flow is $-118 ($-1k/yr) — negative.
- To cash-flow at today's rent, offer at most $229k (8.3% below list).
- To meet the 1% rule (rent ≥ 1% of price), the offer needs to be $222k (11.3% below list).
- Recommended offer: $222k (11.3% below list) — sets the bar for 1% rule.
- Cap rate 5.7% vs local median 3.8% in Scottsville — top-decile yield for the area; either an underpriced asset or a hidden risk that comps aren't pricing in. Stress-test before assuming the spread holds.
Location & tenants
- Location reads 71/100 on livability (#409 in NY) — a middle-class / working-renter tenant base. Strengths: housing A+, crime A-, cost of living B+; Watch: amenities F, commute F, health & safety D-.
- Rush-Henrietta Central School District (suburban): math 62% / reading 57% proficiency, ranked #237 of 590 in NY (top 40%) — acceptable for families but not a draw, mixed tenant base, ~2y average lease.
- Zoned schools: Ethel K Fyle Elementary School (math 74% / reading 64%, grade A-, #447 of 2,108 statewide, top 24%, 424 students, 55% FRL); Henry V Burger Junior High School (math 48% / reading 56%, grade C+, #241 of 729 statewide, top 35%, 691 students, 43% FRL); Rush-Henrietta Senior High School (math 97% / reading 72%, grade A, #379 of 1,100 statewide, top 36%, 1,300 students, 43% FRL) — zoned schools average 47% FRL vs 29% district-wide (18 pts higher); higher-poverty schools than district average — tighter screening recommended.
- Market conditions: 40 active listings in the ZIP; 1 comparable units currently listed for rent nearby; high-income renter base; 1,169 units permitted in Monroe County in 2024 (591 in 5+ unit buildings).
Forward outlook
- Local home prices are declining (-3.0%/yr); year-one equity from $2k of loan paydown is wiped out by about $7k of value loss. Plan a longer hold.
- Monroe County population projected to shrink 6% by 2050 — rents likely to lag national; underwrite the cash flow, not the appreciation.
Negotiation context
- Only 7 days on market — expect competitive offers; lowballing is unlikely to land.
Questions for the listing agent
- What do current leases actually rent for vs. the listed asking? Can we see a recent rent roll and the last 12 months of T-12 income?
- Is there a deadline driving the sale (1031 exchange, divorce, estate, relocation)? That informs how much negotiation room exists.
- The area grade is low — what's the realistic commute time and amenity access for the typical tenant pool here? Any planned neighborhood developments (good or bad) we should know about?
- What's the average days-on-market for RENTAL listings here right now (not sales)? A rising rental-DOM trend means longer vacancies and softer asking-rent achievability than the comps imply.
- What's the recent tenant-quality profile in this submarket — average credit score on applications, eviction rate, late-payment / NSF rate, and stable-employment percentage? A property-management company in the area should have these aggregated.
- How much new for-sale + rental construction is in the pipeline within 1–3 miles? Heavy new supply typically softens prices + rents 12–24 months out; constrained supply supports both.
Investment metrics
- 1% rule
- 0.89% ✗
- Cap rate
- 5.73%
- Cash-on-cash
- -2.02%
- DSCR
- 0.91
- GRM
- 9.4
CMA / ARV
- ARV (on-the-fly)
- $273,000
- Comps found
- 12
Show comp detail 12 sales within ~0.75 mi
| Address | Dist | Beds/Ba | Sqft | Sold | Price | $/sf | Match |
|---|---|---|---|---|---|---|---|
| 76 Grangerford Hts | 0.04mi | 3/1.5 | 1,350 (+4%) | 2mo | $295,000 | $219 | 90 |
| 367 Farrell Road Ext | 0.07mi | 3/1.5 | 1,300 (0%) | 11mo | $254,000 | $195 | 88 |
| 84 Grangerford Hts | 0.04mi | 3/1.5 | 1,300 (0%) | 18mo | $250,000 | $192 | 83 |
| 7 Fieldstone Ln | 0.48mi | 3/1.5 | 1,373 (+6%) | 0mo | $310,000 | $226 | 68 |
| 43 Grangerford Hts | 0.04mi | 3/1.0 | 1,450 (+12%) | 12mo | $216,000 | $149 | 67 |
| 111 Farrell Road Ext | 0.57mi | 3/1.5 | 1,300 (0%) | 10mo | $271,000 | $208 | 65 |
| 540 Countess Dr | 0.39mi | 3/1.5 | 1,288 (-1%) | 22mo | $270,000 | $210 | 62 |
| 13 Sundew Ln | 0.43mi | 3/1.0 | 1,307 (+0%) | 21mo | $292,500 | $224 | 60 |
| 131 Grangerford Hts | 0.11mi | 3/2.0 | 1,490 (+15%) | 12mo | $250,000 | $168 | 59 |
| 115 Cave Holw | 0.53mi | 3/1.5 | 1,300 (0%) | 22mo | $230,000 | $177 | 57 |
| 87 Mickens Bnd | 0.63mi | 3/1.5 | 1,364 (+5%) | 21mo | $310,000 | $227 | 45 |
| 79 Mickens Bnd | 0.65mi | 3/1.5 | 1,488 (+14%) | 3mo | $330,000 | $222 | 43 |
Match score weights: distance 35% · size 25% · config 20% · recency 20%. Top-matched comps best support the ARV.
Projected returns pro-forma
-3.0% appreciation · 3.0% rent growth · sell at horizon
- IRR
- -19.6%
- Equity multiple
- 0.32×
- Total profit
- $-47,875
- Equity at exit
- $37,261
- IRR
- -12.2%
- Equity multiple
- 0.27×
- Total profit
- $-50,857
- Equity at exit
- $21,607
Cash invested: $69,972 (down + closing). Projections, not guarantees.
Landlord ↔ Tenant lean methodology
- Overall (STATE)
- 15 Strongly Tenant-Friendly
- State New York
- 15 Strongly Tenant-Friendly · D+10
- County
- — inherits STATE
- City
- — inherits STATE
ZIP-level market 14586
- Home prices YoY
- -8.5%
- Active inventory
- 40
- Price-to-rent
- 9.4×
Monthly cashflow live
- Estimated rent
- $2,217 medium interval (Pro) →
- Mortgage (P&I)
- −$1,311
- Tax from tax record
- −$455 /mo · $5,459/yr
- Insurance
- −$104
- HOA
- −$0
- Vacancy / Maint / Mgmt
- −$466
- Net cashflow
- $-118
Break-even live
Sensitivity live
| Price | -10% $24 | -5% $-47 | +0% $-118 | +5% $-189 | +10% $-259 |
|---|---|---|---|---|---|
| Rent | -10% $-293 | -5% $-205 | +0% $-118 | +5% $-30 | +10% $57 |
| Rate | -1.0pp $8 | -0.5pp $-54 | base $-118 | +0.5pp $-183 | +1.0pp $-248 |
UW: 25.0% down · 7.5% · 30yr · 1.5% tax · 5.0% vac · 8.0% maint · 8.0% mgmt
Financing live
Cash to close
- Down payment
- $62,475
- Closing costs
- $7,497
- Reserves months
- —
- Total cash needed
- —
Loan-product check · same deal, 3 products live
Conventional
25% down · 7.5% · 30yr
- Down + closing
- —
- Monthly P&I
- —
- Monthly cashflow
- —
- DSCR
- —
- Eligible?
- —
Personal DTI + credit; lowest rate.
DSCR
20% down · 8.5% · 30yr
- Down + closing
- —
- Monthly P&I
- —
- Monthly cashflow
- —
- DSCR
- —
- Eligible?
- —
No personal income docs; deal must DSCR.
Hard money
10% down · 12.0% · 12mo
- Down + closing
- —
- Monthly P&I
- —
- Monthly cashflow
- —
- DSCR
- —
- Eligible?
- —
Short-term bridge; refi at stabilization.
Rent comps 1 comps
| Address | Beds | Baths | Sqft | Rent | $/sqft | DOM | Units | Dist |
|---|---|---|---|---|---|---|---|---|
| 312 Countess Dr West Henrietta, NY | 1.0–2.0 | 1.0–1.5 | 866 | $1,810 | $2.09 | 4d | 24 | 0.32mi |
Listing history 7 events
-
2026-06-13statusdays on market $249,900 Pending 7 DOM
-
2026-06-10days on market $249,900 Active 6 DOM
-
2026-06-09days on market $249,900 Active 5 DOM
-
2026-06-09days on market $249,900 Active 4 DOM
-
2026-06-07days on market $249,900 Active 3 DOM
-
2026-06-05remarks 568-char remark
-
2026-06-05$249,900 Active 1 DOM
ⓘ Source: listings_history table (triggers on properties + properties_extension) + one-shot
backfill from property_details.listing_events for pre-trigger history.
Tax reassessment forecast NY · Partial reset (capped growth)
- Current annual tax
- $5,459 · $455/mo
- Projected year-2 tax
- $5,459 · $455/mo
- Expected delta
- $0/yr ($0/mo · 0.0%)
ⓘ Screening estimate from a state-policy table — verify with the county assessor before closing.
Climate risk First Street
- Flood 1/10 Low FEMA zone X (unshaded) · 0% chance over 30 yrs
- Wildfire 2/10 Low
- Heat 2/10 Low 7 d/yr ≥95°F today · 15 d/yr by 30 yrs out
- Wind 1/10 Low
- Air quality 2/10 Low 1 unhealthy d/yr today · 1 by 30 yrs out
Nearby sold comps map
Loading sold comps map…
Walkable amenities ~0.75 mi
Loading nearby amenities…
Taxation est. · year 1
- Rental income
- $26,609
- − Mortgage interest
- −$13,998
- − Property taxes
- −$5,459
- − Insurance
- −$1,250
- − Repairs & maintenance
- −$2,129
- − Management
- −$2,129
- − Depreciation
- −$7,270
- Taxable loss
- −$5,625
- Est. tax savings @ 24.0%
- +$1,350
- After-tax cash flow
- $-63/yr
For passive investors: Depreciation is non-cash, so a rental often shows a tax loss while cash-flowing — sheltering income. Rental losses are passive: they offset passive income freely, and up to $25,000/yr can offset ordinary (W-2) income if you actively participate and your MAGI is under $100k (phasing out to $0 by $150k); unused losses carry forward. On sale, claimed depreciation is recaptured at up to 25%, and gains may owe capital-gains tax (a 1031 exchange can defer both). Figures are a year-1 estimate at your 24.0% rate — not tax advice; consult a CPA.
Schools (NCES district)
- District
- Rush-Henrietta Central School District
- NCES district ID
- 3625170
- Math proficiency
- 62% ▼ -6.00%
- Reading proficiency
- 57% ▲ 1.00%
- Median HH income
- $58,682
- Composite
- 51.52/100
- National rank
- #1720
- State rank
- #237 of 590 in NY
Livability — Scottsville
- Score
- 71/100
- State rank
- #409
- US rank
- #7059
Category grades
Schools grade is shown separately in the Schools card above.
Census & demographics
- County
- Monroe County · 674,131 people
- City population
- 4,450
- Metro
- Rochester, NY
- Population (ZIP)
- 13,291
- Household income
- $124,457
- Rent vs Own
- Severe rent burden
- 458.0
Population outlook (Monroe County) Hauer SSP2
- Today (2025)
- 759,460 people
- By 2030
- 757,154 · -0.3%
- By 2040
- 740,644 · -2.5%
- By 2050
- 714,443 · -5.9%
- By 2075
- 645,883 · -15.0%
- By 2100
- 547,084 · -28.0%
Race, ethnicity, and origin ACS 2023
- Neighborhood character
- Predominantly White (69%)
- Race & ethnicity
- White 69% Asian 15% Black 7% Two or more races 5% Hispanic / Latino 4%
- Common ancestry
- Romanian 4% Iranian 2% Lithuanian 2%
- Foreign-born
- 16% · China, India, Vietnam
- Languages at home
- 81% English-only · Other Indo-European 7% Spanish 4% Chinese 3%
Political lean MEDSL · Monroe
- 2024 margin
- D (+19.1) · D 59.5% · R 40.5%
- 2008→2024 swing
- +1.4pp toward D · 2008: 17.7pp · 2024: 19.1pp
- All cycles
- 2024: D+19.1 2020: D+21.0 2016: D+14.1 2012: D+17.4 2008: D+17.7
Not yet ingested
- Civics
- —
Market trends
- HPI YoY
- ▼ -24.58%
- Current HPI
- 265.7183
- Rent YoY
- —
- Metro
- Rochester, NY
- State GDP YoY
- ▲ 2.60%
- F500 in state
- 92
Industry mix (Fortune 500 HQ in NY)
| Industry | F500 HQs | Revenue |
|---|---|---|
| Financial Services | 10 | $950B |
|
||
| Consumer Goods | 9 | $162B |
|
||
| Insurance | 4 | $225B |
|
||
| Telecommunications | 2 | $144B |
|
||
| Pharmaceuticals | 2 | $112B |
|
||
| Media / Entertainment | 2 | $69B |
|
||
Price history
1 event — show timeline
- 2026-06-04 Listed $249,900 UNYREIS
Property tax history
+5.8%/yrLatest (2025): $5,459 · +13.3% YoY. Source: county tax records.
Cash-flow waterfall
monthlySold comps — $/sqft
last 12 mo · ≤1 miLoading sold comps…