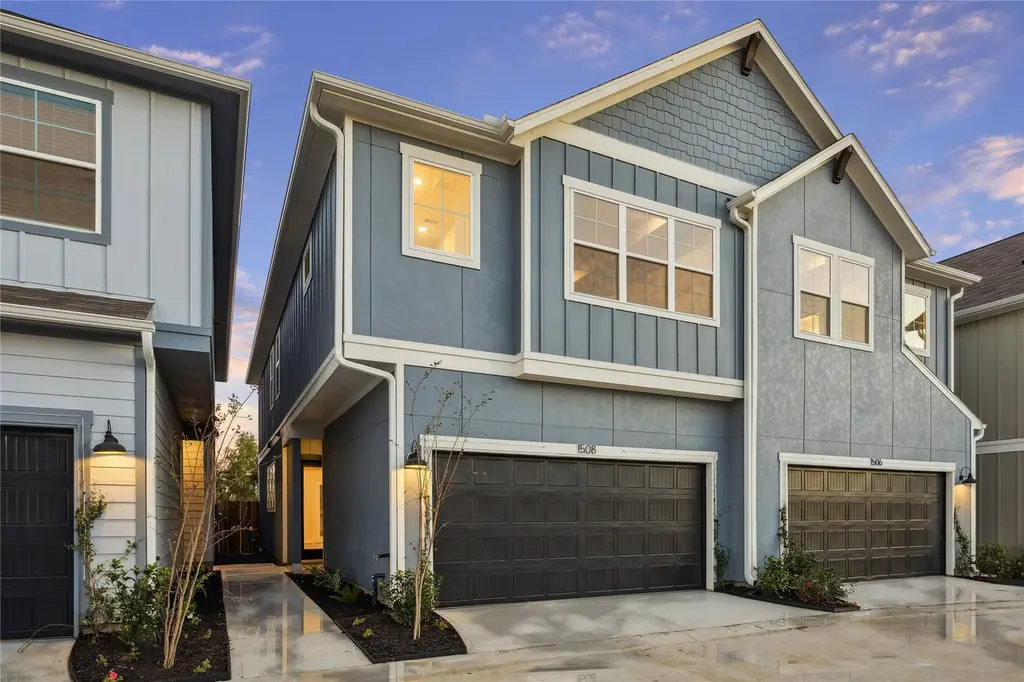
1508 Colonial Gorge Dr · Houston, TX
Flood risk No data
- FEMA flood zone
- —
- Chance of flooding over 30 yrs
- —
- Est. flood insurance / yr
- —
Fire risk No data
- Est. fire insurance / yr
- —
Heat risk No data
- Hot days now (above threshold)
- —
- Hot days in 30 yrs
- —
Wind risk No data
- Chance of severe wind over 30 yrs
- —
Air-quality risk No data
- Unhealthy air days now
- —
- Unhealthy air days in 30 yrs
- —
Risk factors via First Street. Map © Google.
Why this score? — see what drove the D- grade
The composite is a weighted blend of 9 inputs, each scored 0–100. Each bar is that input's sub-score; the figure is the points it added to the 100-point composite (weight × sub-score).
- Cash flow +10.0/30.0
- ARV discount +7.5/15.0
- Schools +5.7/10.0
- Livability +3.7/5.0
- DSCR +2.9/10.0
- 1% rule +2.6/10.0
- Condition / age +2.5/5.0
- Rent growth +2.3/5.0
- Appreciation +0.0/10.0
$324,900
🖨 Deal sheet 📄 Offer letter ✓ Due diligence
Listing remarks MLS
Two-story home offering an open first-floor layout featuring a spacious living and dining area, island kitchen with pantry, powder bath, and attached garage. All bedrooms are located on the second floor, including a primary suite with tray ceiling, walk-in closet, and private bath with separate shower. Three secondary bedrooms share a full bath, and the utility area is conveniently located upstairs. Functional layout with efficient use of space and ample storage.
Key facts
- Attached garage
- Island kitchen
- Walk-in closet
Tags
Neighborhood map
What this means for you Summary
Snapshot
- This is a 3-bed/2.5-bath single-family listed at $325k.
Deal economics
- At list price, monthly cash flow is $-193 ($-2k/yr) — negative.
- To cash-flow at today's rent, offer at most $291k (10.5% below list).
- To meet the 1% rule (rent ≥ 1% of price), the offer needs to be $247k (23.9% below list).
- Recommended offer: $247k (23.9% below list) — sets the bar for 1% rule.
- Cap rate 5.6% vs local median 3.2% in Houston — top-decile yield for the area; either an underpriced asset or a hidden risk that comps aren't pricing in. Stress-test before assuming the spread holds.
Location & tenants
- Location reads 74/100 on livability (#184 in TX, #4,771 nationally) — a middle-class / working-renter tenant base. Strengths: amenities A+, cost of living A+, housing A+; Watch: schools D, crime F.
- Katy ISD (suburban): math 61% / reading 63% proficiency, ranked #29 of 826 in TX (top 4%) — acceptable for families but not a draw, mixed tenant base, ~2y average lease.
- Market conditions: Rents soft (-0.8%/yr); 2696 active listings in the ZIP; 30 comparable units currently listed for rent nearby; rentals leasing fast (median 5d on market — plan ~1-2 weeks tenant-placement turnaround); high-income renter base; 29,883 units permitted in Harris County in 2024 (8,621 in 5+ unit buildings).
Forward outlook
- Local home prices are declining (-3.0%/yr); year-one equity from $2k of loan paydown is wiped out by about $10k of value loss. Plan a longer hold.
- Harris County population projected at +47% by 2050 — long-run rental-demand tailwind backs the buy-and-hold thesis.
Negotiation context
- It's been on market 34 days — a 3% lower offer ($315k) is reasonable based on typical stale-listing flexibility.
- 9 sale attempts with the ask held roughly flat each time — persistent listings suggest the price (not the market) is what's stuck; bring a comps-based counter.
Questions for the listing agent
- What do current leases actually rent for vs. the listed asking? Can we see a recent rent roll and the last 12 months of T-12 income?
- It's been on market 34 days. Have you received any prior offers? Is the seller open to a 24% concession, seller financing, or rate buy-down credit?
- What does the HOA fee cover, when was the last increase, and are there any pending special assessments or reserve-fund shortfalls?
- Is there a deadline driving the sale (1031 exchange, divorce, estate, relocation)? That informs how much negotiation room exists.
- Schools are D-rated, which usually means shorter tenancies and higher turnover. Who's the typical renter profile here, and what's been the actual vacancy rate?
- Crime grade is F in this area — have there been break-ins, vandalism, or insurance claims at this property in the last 3 years? What carrier currently insures it and at what premium?
- The area grade is low — what's the realistic commute time and amenity access for the typical tenant pool here? Any planned neighborhood developments (good or bad) we should know about?
- What's the average days-on-market for RENTAL listings here right now (not sales)? A rising rental-DOM trend means longer vacancies and softer asking-rent achievability than the comps imply.
- What's the recent tenant-quality profile in this submarket — average credit score on applications, eviction rate, late-payment / NSF rate, and stable-employment percentage? A property-management company in the area should have these aggregated.
- How much new for-sale + rental construction is in the pipeline within 1–3 miles? Heavy new supply typically softens prices + rents 12–24 months out; constrained supply supports both.
Investment metrics
- 1% rule
- 0.76% ✗
- Cap rate
- 5.58%
- Cash-on-cash
- -2.55%
- DSCR
- 0.89
- GRM
- 11.0
CMA / ARV
- ARV (median comp)
- $324,900
- List price
- $324,900
- Delta
- —
- Verdict
- FAIR
- Comps
- 20 within 1.0 mi
Show comp detail 12 sales within ~0.75 mi
| Address | Dist | Beds/Ba | Sqft | Sold | Price | $/sf | Match |
|---|---|---|---|---|---|---|---|
| 1512 Colonial Gorge Dr | 0.01mi | 3/2.5 | 2,018 (-1%) | 2mo | $339,900 | $168 | 97 |
| 1518 Colonial Gorge Dr | 0.02mi | 3/2.5 | 2,007 (-1%) | 1mo | $329,900 | $164 | 96 |
| 1504 Colonial Gorge Dr | 0.01mi | 3/2.5 | 1,964 (-3%) | 2mo | $319,900 | $163 | 92 |
| 24411 Colonial Willow Dr | 0.04mi | 3/2.5 | 1,964 (-3%) | 2mo | $309,900 | $158 | 91 |
| 1506 Colonial Gorge Dr | 0.00mi | 4/2.5 (+1) | 1,964 (-3%) | 1mo | $324,900 | $165 | 88 |
| 24403 Colonial Willow Dr | 0.02mi | 4/2.5 (+1) | 1,943 (-4%) | 2mo | $327,900 | $169 | 85 |
| 1508 Colonial Gorge Dr | 0.00mi | 4/2.5 (+1) | 1,904 (-6%) | 1mo | $324,900 | $171 | 84 |
| 24404 Colonial Willow Dr | 0.03mi | 3/2.5 | 1,863 (-8%) | 1mo | $319,900 | $172 | 84 |
| 24402 Colonial Mound Dr | 0.04mi | 3/3.5 | 1,877 (-8%) | 0mo | $344,900 | $184 | 81 |
| 24515 Colonial Birch Ln | 0.25mi | 3/2.0 | 1,868 (-8%) | 1mo | $250,000 | $134 | 72 |
| 24402 Pepperrell Place St | 0.36mi | 3/2.0 | 1,932 (-5%) | 3mo | $295,000 | $153 | 70 |
| 1811 Salt Valley Dr | 0.60mi | 4/2.5 (+1) | 2,050 (+1%) | 2mo | $299,500 | $146 | 64 |
Match score weights: distance 35% · size 25% · config 20% · recency 20%. Top-matched comps best support the ARV.
Projected returns pro-forma
-3.0% appreciation · 0.0% rent growth · sell at horizon
- IRR
- -23.8%
- Equity multiple
- 0.21×
- Total profit
- $-72,240
- Equity at exit
- $48,444
- IRR
- -29.4%
- Equity multiple
- -0.17×
- Total profit
- $-106,871
- Equity at exit
- $28,091
Cash invested: $90,972 (down + closing). Projections, not guarantees.
Landlord ↔ Tenant lean methodology
- Overall (STATE)
- 87 Strongly Landlord-Friendly
- State Texas
- 87 Strongly Landlord-Friendly · R+5
- County
- — inherits STATE
- City
- — inherits STATE
ZIP-level market 77493
- Rents YoY
- -0.8%
- Active inventory
- 2696
- Price-to-rent
- 11.0×
Monthly cashflow live
- Estimated rent
- $2,473 high interval (Pro) →
- Mortgage (P&I)
- −$1,704
- Tax from tax record
- −$225 /mo · $2,695/yr
- Insurance
- −$135
- HOA
- −$83
- Vacancy / Maint / Mgmt
- −$519
- Net cashflow
- $-193
Break-even live
UW: 25.0% down · 7.5% · 30yr · 1.5% tax · 5.0% vac · 8.0% maint · 8.0% mgmt
Financing live
Cash to close
- Down payment
- $81,225
- Closing costs
- $9,747
- Reserves months
- —
- Total cash needed
- —
Loan-product check · same deal, 3 products live
Conventional
25% down · 7.5% · 30yr
- Down + closing
- —
- Monthly P&I
- —
- Monthly cashflow
- —
- DSCR
- —
- Eligible?
- —
Personal DTI + credit; lowest rate.
DSCR
20% down · 8.5% · 30yr
- Down + closing
- —
- Monthly P&I
- —
- Monthly cashflow
- —
- DSCR
- —
- Eligible?
- —
No personal income docs; deal must DSCR.
Hard money
10% down · 12.0% · 12mo
- Down + closing
- —
- Monthly P&I
- —
- Monthly cashflow
- —
- DSCR
- —
- Eligible?
- —
Short-term bridge; refi at stabilization.
Rent comps 30 comps
| Address | Beds | Baths | Sqft | Rent | $/sqft | DOM | Units | Dist |
|---|---|---|---|---|---|---|---|---|
| 1508 Colonial Gorge Dr Katy, TX | 4.0 | 2.5 | 1904 | $2,650 | $1.39 | 16d | 1 | 0.02mi |
| 1330 W Park Green Dr Katy, TX | 1.0–3.0 | 1.0–2.0 | 1058 | $2,297 | $2.17 | 2d | 17 | 0.18mi |
| 1330 W Park Green Dr Katy, TX | 1.0–3.0 | 1.0–2.0 | 1058 | $2,222 | $2.10 | 43d | 16 | 0.18mi |
| 1330 Park West Green Dr Unit 1363 Katy, TX | 3.0 | 2.0 | 1451 | $2,212 | $1.52 | 15d | 1 | 0.21mi |
| 24002 Colonial Pkwy Katy, TX | 1.0–3.0 | 1.0–2.0 | 1072 | $2,262 | $2.11 | 2d | 32 | 0.23mi |
| 1739 Palmetto Park Dr Katy, TX | 4.0 | 3.5 | 2998 | $3,100 | $1.03 | 43d | 1 | 0.37mi |
| 1700 Katy Fort Bend Rd Katy, TX | 1.0–3.0 | 1.0–2.0 | 1094 | $2,415 | $2.21 | 1d | 33 | 0.56mi |
| 24414 Leachwood Dr Katy, TX | 4.0 | 2.0 | 1701 | $2,195 | $1.29 | 18d | 1 | 0.65mi |
| 24929 Katy Ranch Rd Katy, TX | 1.0–3.0 | 1.0–2.0 | 1096 | $1,767 | $1.61 | 1d | 21 | 0.72mi |
| 24151 Bella Dolce Ln Unit 1 Katy, TX | 3.0 | 2.5 | 1509 | $2,313 | $1.53 | 43d | 1 | 0.74mi |
| 24151 Bella Dolce Ln Unit 3174 Katy, TX | 3.0 | 2.0 | 1509 | $2,254 | $1.49 | 10d | 1 | 0.74mi |
| 24151 Bella Dolce Ln Unit 3112 Katy, TX | 3.0 | 2.0 | 1509 | $2,222 | $1.47 | 2d | 1 | 0.74mi |
| 24151 Bella Dolce Ln Unit 24184 Katy, TX | 3.0 | 2.0 | 1509 | $2,496 | $1.65 | 43d | 1 | 0.74mi |
| 2031 Wigmaker Dr Katy, TX | 3.0 | 2.0 | 1430 | $1,800 | $1.26 | 5d | 1 | 0.83mi |
| 150 Cobia Dr Unit 3187 Katy, TX | 3.0 | 2.0 | 1454 | $1,962 | $1.35 | 2d | 1 | 0.87mi |
| 150 Cobia Dr Unit 183 Katy, TX | 3.0 | 2.0 | 1454 | $2,005 | $1.38 | 43d | 1 | 0.87mi |
| 150 Cobia Dr Unit 3174 Katy, TX | 3.0 | 2.0 | 1454 | $1,994 | $1.37 | 10d | 1 | 0.87mi |
| 24758 Grand Harbor Dr Unit 24791 Katy, TX | 3.0 | 2.0 | 1437 | $2,114 | $1.47 | 43d | 1 | 0.98mi |
| 24758 Grand Harbor Dr Unit 3174 Katy, TX | 3.0 | 2.0 | 1437 | $2,071 | $1.44 | 2d | 1 | 0.98mi |
| 24758 Grand Harbor Dr Unit 3047 Katy, TX | 3.0 | 2.0 | 1437 | $2,114 | $1.47 | 11d | 1 | 1.00mi |
| 302 Cobia Dr Katy, TX | 1.0–3.0 | 1.0–2.5 | 1217 | $2,469 | $2.03 | 1d | 23 | 1.06mi |
| 23615 Western Centre Dr Katy, TX | 1.0–3.0 | 1.0–2.0 | 1011 | $2,230 | $2.20 | 1d | 30 | 1.09mi |
| 23414 W Fernhurst Dr Katy, TX | 1.0–3.0 | 1.0–3.0 | 1352 | $3,099 | $2.29 | 1d | 26 | 1.15mi |
| 1724 Partnership Way Katy, TX | 3.0 | 1.0–3.5 | 1536 | $3,340 | $2.17 | 1d | 86 | 1.17mi |
| 1646 Chilton Ln Katy, TX | 3.0 | 2.0 | 1442 | $2,000 | $1.39 | 4d | 1 | 1.19mi |
| 2222 Princess Snow Cir Katy, TX | 4.0 | 2.5 | 2958 | $2,425 | $0.82 | 12d | 1 | 1.22mi |
| 1616 Partnership Way Katy, TX | 3.0 | 1.0–3.0 | 1283 | $2,995 | $2.33 | 5d | 47 | 1.23mi |
| 10 Cobia Dr Katy, TX | 3.0 | 2.0 | 1454 | $2,275 | $1.56 | 43d | 1 | 1.27mi |
| 23400 Kingsland Blvd Katy, TX | 1.0–3.0 | 1.0–2.0 | 1062 | $2,314 | $2.18 | 2d | 23 | 1.42mi |
| 125 Prairie Ln Katy, TX | 3.0 | 1.0–3.0 | 1292 | $3,125 | $2.42 | 1d | 230 | 1.47mi |
HOA detail
- Monthly dues
- $83 · $996/yr
Listing history 20 events
-
2026-05-04status Pending 467-char remark
Show marketing remark (467 chars)
Two-story home offering an open first-floor layout featuring a spacious living and dining area, island kitchen with pantry, powder bath, and attached garage. All bedrooms are located on the second floor, including a primary suite with tray ceiling, walk-in closet, and private bath with separate shower. Three secondary bedrooms share a full bath, and the utility area is conveniently located upstairs. Functional layout with efficient use of space and ample storage.
-
2026-03-31$324,900 Active 467-char remark
Show marketing remark (467 chars)
Two-story home offering an open first-floor layout featuring a spacious living and dining area, island kitchen with pantry, powder bath, and attached garage. All bedrooms are located on the second floor, including a primary suite with tray ceiling, walk-in closet, and private bath with separate shower. Three secondary bedrooms share a full bath, and the utility area is conveniently located upstairs. Functional layout with efficient use of space and ample storage.
-
2026-03-31historical
Show marketing remark (467 chars)
Two-story home offering an open first-floor layout featuring a spacious living and dining area, island kitchen with pantry, powder bath, and attached garage. All bedrooms are located on the second floor, including a primary suite with tray ceiling, walk-in closet, and private bath with separate shower. Three secondary bedrooms share a full bath, and the utility area is conveniently located upstairs. Functional layout with efficient use of space and ample storage.
-
2026-02-04price $329,900
-
2025-12-11$331,700 Active
-
2025-12-10historical
-
2025-12-04price $331,700
-
2025-10-21$344,700 Active
-
2025-10-14historical
-
2025-09-15$339,700 Active
-
2025-09-15historical
-
2025-07-23$344,700 Active
-
2025-07-23historical
-
2025-06-02$344,700 Active
-
2025-06-02historical
-
2025-05-07$344,700 Active
-
2025-05-07historical
-
2025-04-16status Active
-
2025-03-04status Pending
-
2025-02-19$349,700 Active
ⓘ Source: listings_history table (triggers on properties + properties_extension) + one-shot
backfill from property_details.listing_events for pre-trigger history.
Tax reassessment forecast TX · Resets to sale price
- Current annual tax
- $2,695 · $225/mo
- Projected year-2 tax
- $5,946 · $495/mo
- Expected delta
- +$3,251/yr (+$271/mo · 120.6%)
ⓘ Screening estimate from a state-policy table — verify with the county assessor before closing.
Nearby sold comps map
Loading sold comps map…
Walkable amenities ~0.75 mi
Loading nearby amenities…
Taxation est. · year 1
- Rental income
- $29,670
- − Mortgage interest
- −$18,199
- − Property taxes
- −$2,695
- − Insurance
- −$1,624
- − Repairs & maintenance
- −$2,374
- − Management
- −$2,374
- − HOA
- −$996
- − Depreciation
- −$9,452
- Taxable loss
- −$8,044
- Est. tax savings @ 24.0%
- +$1,930
- After-tax cash flow
- $-391/yr
For passive investors: Depreciation is non-cash, so a rental often shows a tax loss while cash-flowing — sheltering income. Rental losses are passive: they offset passive income freely, and up to $25,000/yr can offset ordinary (W-2) income if you actively participate and your MAGI is under $100k (phasing out to $0 by $150k); unused losses carry forward. On sale, claimed depreciation is recaptured at up to 25%, and gains may owe capital-gains tax (a 1031 exchange can defer both). Figures are a year-1 estimate at your 24.0% rate — not tax advice; consult a CPA.
Schools (NCES district)
- District
- Katy ISD
- NCES district ID
- 4825170
- Math proficiency
- 61% ▼ -7.00%
- Reading proficiency
- 63% ▼ -3.00%
- Median HH income
- $90,312
- Composite
- 56.59/100
- National rank
- #1146
- State rank
- #29 of 826 in TX
Livability — Houston
- Score
- 74/100
- State rank
- #184
- US rank
- #4771
Category grades
Schools grade is shown separately in the Schools card above.
Census & demographics
- County
- Harris County · 4,702,590 people
- City population
- 413,575
- Metro
- Houston-The Woodlands-Sugar Land, TX
- Population (ZIP)
- 71,484
- Household income
- $118,464
- Rent vs Own
- Severe rent burden
- 913.0
Population outlook (Harris County) Hauer SSP2
- Today (2025)
- 5,571,493 people
- By 2030
- 6,089,821 · +9.3%
- By 2040
- 7,142,806 · +28.2%
- By 2050
- 8,185,864 · +46.9%
- By 2075
- 10,574,329 · +89.8%
- By 2100
- 12,109,958 · +117.4%
Race, ethnicity, and origin ACS 2023
- Neighborhood character
- Highly diverse neighborhood (Simpson 0.73)
- Race & ethnicity
- White 36% Hispanic / Latino 33% Two or more races 16% Black 15% Asian 12%
- Hispanic origin (detail)
- Mexican 20%
- Common ancestry
- Lithuanian 2% Slovak 1% Italian 1%
- Foreign-born
- 21% · Canada, Vietnam, Jamaica
- Languages at home
- 64% English-only · Spanish 22% Vietnamese 5% French/Haitian/Cajun 4%
Political lean MEDSL · Harris
- 2024 margin
- Lean D (+5.5) · D 52.0% · R 46.4% · Other 1.6%
- 2008→2024 swing
- +3.9pp toward D · 2008: 1.6pp · 2024: 5.5pp
- All cycles
- 2024: D+5.5 2020: D+13.3 2016: D+12.4 2012: D+0.1 2008: D+1.6
Not yet ingested
- Civics
- —
Market trends
- HPI YoY
- ▼ -140.65%
- Current HPI
- 233.1683
- Rent YoY
- ▼ -0.80%
- Metro
- Houston-The Woodlands-Sugar Land, TX
- State GDP YoY
- ▲ 3.95%
- F500 in state
- 110
Industry mix (Fortune 500 HQ in TX)
| Industry | F500 HQs | Revenue |
|---|---|---|
| Energy | 16 | $1,198B |
|
||
| Technology | 5 | $198B |
|
||
| Engineering / Construction | 4 | $72B |
|
||
| Energy Services | 3 | $60B |
|
||
| Utilities | 3 | $41B |
|
||
| Healthcare | 2 | $330B |
|
||
Price history
-7.1% since first listed20 events — show timeline
- 2026-05-04 Pending — HARMLS
- 2026-03-31 Listing Removed — HARMLS
- 2026-03-31 Listed $324,900 HARMLS
- 2026-02-04 Price Changed $329,900 HARMLS
- 2025-12-11 Listed $331,700 HARMLS
- 2025-12-10 Listing Removed — HARMLS
- 2025-12-04 Price Changed $331,700 HARMLS
- 2025-10-21 Listed $344,700 HARMLS
- 2025-10-14 Listing Removed — HARMLS
- 2025-09-15 Listing Removed — HARMLS
- 2025-09-15 Listed $339,700 HARMLS
- 2025-07-23 Listing Removed — HARMLS
- 2025-07-23 Listed $344,700 HARMLS
- 2025-06-02 Listing Removed — HARMLS
- 2025-06-02 Listed $344,700 HARMLS
- 2025-05-07 Listing Removed — HARMLS
- 2025-05-07 Listed $344,700 HARMLS
- 2025-04-16 Relisted — HARMLS
- 2025-03-04 Pending — HARMLS
- 2025-02-19 Listed $349,700 HARMLS
Cash-flow waterfall
monthlySold comps — $/sqft
last 12 mo · ≤1 miLoading sold comps…