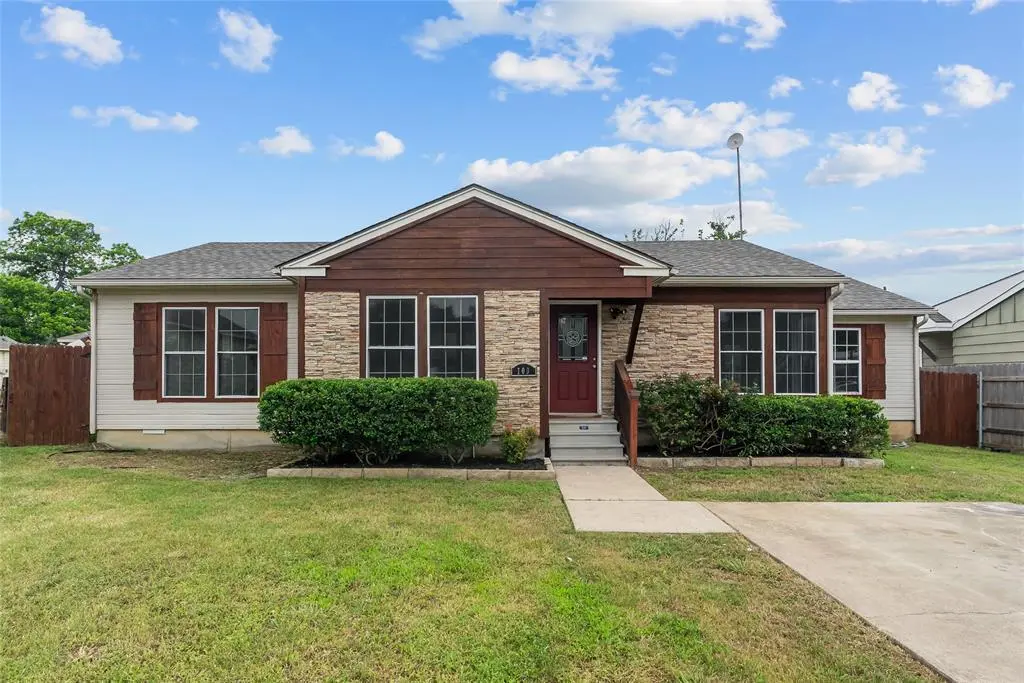
109 S 1st St · Godley, TX
Flood risk 1/10 · Minimal
- FEMA flood zone
- X (unshaded)
- Chance of flooding over 30 yrs
- 0.0%
- Est. flood insurance / yr
- $507 – $1,088
Fire risk 6/10 · Moderate
- Est. fire insurance / yr
- $1,222 – $2,270
Heat risk 7/10 · Major
- Hot days now (above 109°F)
- 7 days/yr
- Hot days in 30 yrs
- 24 days/yr
Wind risk 6/10 · Moderate
- Chance of severe wind over 30 yrs
- 27.0%
Air-quality risk 2/10 · Minimal
- Unhealthy air days now
- 1 days/yr
- Unhealthy air days in 30 yrs
- 2 days/yr
Risk factors via First Street. Map © Google.
Why this score? — see what drove the D+ grade
The composite is a weighted blend of 9 inputs, each scored 0–100. Each bar is that input's sub-score; the figure is the points it added to the 100-point composite (weight × sub-score).
- ARV discount +13.7/15.0
- Cash flow +12.7/30.0
- 1% rule +5.1/10.0
- DSCR +3.8/10.0
- Livability +3.7/5.0
- Schools +3.2/10.0
- Rent growth +2.5/5.0
- Condition / age +2.5/5.0
- Appreciation +0.0/10.0
$245,000
🖨 Deal sheet 📄 Offer letter ✓ Due diligence
Listing remarks MLS
3-2 home in Godley. 2 living areas with wood floors , kitchen with tile countertops, built in microwave , large dining area and walk in pantry. Spacious bedrooms with wood floors. Enjoy the wonderful outdoors on the wooden deck with large fenced backyard. Showings to begin on Friday April 1st at 5pm
Key facts
- Private bath oasis
- Expansive backyard
- Modern kitchen
Tags
Property features AI
Finance
- Other: Minerals owned excluded from sale
- Financial info: Treat as clear loan type; No second mortgage
- HOA & community: No homeowners association
Exterior
- Parking: Driveway
- Utilities: City water; City sewer; Not in a municipal utility district
- Home design: Single-family residence; One story; Property is attached
- Construction: Composition roof; Rock/stone and siding exterior; Pillar/post/pier foundation; Year built not specified
- Exterior features: Lot under 0.5 acre (approximately 0.311 acres)
Interior
- Kitchen: Dishwasher; Electric cooktop
- Bedrooms: 3 bedrooms (all on the main level)
- Flooring: Vinyl flooring; Wood flooring
- Bathrooms: 2 full bathrooms
- Interior features: High-speed internet available; Tile counters; One living area; One dining area; 3 total rooms
Neighborhood map
What this means for you Summary
Snapshot
- This is a 3-bed/2.0-bath single-family listed at $245k.
Deal economics
- At list price, monthly cash flow is $-25 ($-304/yr) — negative.
- To cash-flow at today's rent, offer at most $241k (1.8% below list).
- Meets the 1% rule at list price ($2k rent vs $245k).
- Recommended offer: $238k (3.0% below list) — sets the bar for market timing.
- Cap rate 6.2% vs local median 2.8% in Godley — top-decile yield for the area; either an underpriced asset or a hidden risk that comps aren't pricing in. Stress-test before assuming the spread holds.
Location & tenants
- Location reads 73/100 on livability (#226 in TX) — a middle-class / working-renter tenant base. Strengths: crime A+, cost of living A+, housing A+; Watch: health & safety D+, amenities F, commute F.
- Godley ISD (rural): math 34% / reading 38% proficiency, ranked #466 of 826 in TX (top 56%) — families likely to look elsewhere, expect single-tenant / working-renter base with shorter leases.
- Zoned schools: Legacy El (math 39% / reading 37%, grade F, #1,709 of 4,322 statewide, top 40%, 408 students, 32% FRL) — zoned schools average 32% FRL vs 48% district-wide (16 pts lower); this property's tenant base skews higher-income than the district average.
- Market conditions: 565 active listings in the ZIP; 6 comparable units currently listed for rent nearby; rentals at typical pace (median 17d on market — plan ~3-4 weeks tenant-placement turnaround); 2,152 units permitted in Johnson County in 2024 (76 in 5+ unit buildings).
Forward outlook
- Local home prices are declining (-3.0%/yr); year-one equity from $2k of loan paydown is wiped out by about $7k of value loss. Plan a longer hold.
- Johnson County population projected at +24% by 2050 — long-run rental-demand tailwind backs the buy-and-hold thesis.
Negotiation context
- It's been on market 32 days — a 3% lower offer ($238k) is reasonable based on typical stale-listing flexibility.
- 5 sale attempts since 13y ago with the ask held roughly flat each time — persistent listings suggest the price (not the market) is what's stuck; bring a comps-based counter.
Risks & watch-outs
- Watch-outs: property tax is 2.9% of price.
- Climate carrying-cost: major wind risk, 27% chance of damaging wind over 30y; major wildfire risk; extreme-heat days projected 7→24/yr by 2055 (HVAC capex compounding) — expect insurance premiums to compound above CPI over the hold.
Questions for the listing agent
- What do current leases actually rent for vs. the listed asking? Can we see a recent rent roll and the last 12 months of T-12 income?
- It's been on market 32 days. Have you received any prior offers? Is the seller open to a 3% concession, seller financing, or rate buy-down credit?
- Property tax is high relative to price — has the assessment been appealed recently, and will the sale trigger a re-assessment?
- Is there a deadline driving the sale (1031 exchange, divorce, estate, relocation)? That informs how much negotiation room exists.
- Schools are D-rated, which usually means shorter tenancies and higher turnover. Who's the typical renter profile here, and what's been the actual vacancy rate?
- The area grade is low — what's the realistic commute time and amenity access for the typical tenant pool here? Any planned neighborhood developments (good or bad) we should know about?
- What's the average days-on-market for RENTAL listings here right now (not sales)? A rising rental-DOM trend means longer vacancies and softer asking-rent achievability than the comps imply.
- What's the recent tenant-quality profile in this submarket — average credit score on applications, eviction rate, late-payment / NSF rate, and stable-employment percentage? A property-management company in the area should have these aggregated.
- How much new for-sale + rental construction is in the pipeline within 1–3 miles? Heavy new supply typically softens prices + rents 12–24 months out; constrained supply supports both.
Investment metrics
- 1% rule
- 1.01% ✓
- Cap rate
- 6.17%
- Cash-on-cash
- -0.44%
- DSCR
- 0.98
- GRM
- 8.2
CMA / ARV
- ARV (on-the-fly)
- $284,115
- Comps found
- 12
Show comp detail 12 sales within ~0.75 mi
| Address | Dist | Beds/Ba | Sqft | Sold | Price | $/sf | Match |
|---|---|---|---|---|---|---|---|
| 300 W Godley Ave | 0.41mi | 3/2.0 | 1,531 (+5%) | 7mo | $265,000 | $173 | 67 |
| 108 N 2nd St | 0.14mi | 4/3.0 (+1) | 1,574 (+8%) | 8mo | $305,000 | $194 | 65 |
| 109 S 6th St | 0.40mi | 3/2.0 | 1,375 (-6%) | 9mo | $284,500 | $207 | 64 |
| 107 S 6th St | 0.40mi | 3/2.0 | 1,332 (-9%) | 6mo | $299,500 | $225 | 62 |
| 216 Rees Ave | 0.32mi | 3/2.0 | 1,635 (+12%) | 7mo | $299,900 | $183 | 59 |
| 303 N Main St | 0.34mi | 3/2.0 | 1,568 (+8%) | 16mo | $334,900 | $214 | 58 |
| 209 W Links Dr | 0.57mi | 3/2.0 | 1,438 (-1%) | 22mo | $279,900 | $195 | 53 |
| 109 Hackberry Ave | 0.42mi | 2/1.0 (-1) | 1,320 (-9%) | 4mo | $235,000 | $178 | 52 |
| 304 N 5th St | 0.38mi | 3/2.0 | 1,568 (+8%) | 21mo | $224,900 | $143 | 52 |
| 301 N 2nd St | 0.25mi | 3/2.5 | 1,664 (+14%) | 14mo | $330,000 | $198 | 51 |
| 109 S Coleman | 0.45mi | 3/2.0 | 1,248 (-14%) | 12mo | $200,000 | $160 | 45 |
| 241 Amelia Ave | 0.57mi | 3/2.0 | 1,332 (-9%) | 21mo | $319,500 | $240 | 42 |
Match score weights: distance 35% · size 25% · config 20% · recency 20%. Top-matched comps best support the ARV.
Projected returns pro-forma
-3.0% appreciation · 3.0% rent growth · sell at horizon
- IRR
- -16.9%
- Equity multiple
- 0.40×
- Total profit
- $-41,096
- Equity at exit
- $36,530
- IRR
- -8.6%
- Equity multiple
- 0.46×
- Total profit
- $-36,983
- Equity at exit
- $21,183
Cash invested: $68,600 (down + closing). Projections, not guarantees.
Landlord ↔ Tenant lean methodology
- Overall (STATE)
- 87 Strongly Landlord-Friendly
- State Texas
- 87 Strongly Landlord-Friendly · R+5
- County
- — inherits STATE
- City
- — inherits STATE
ZIP-level market 76044
- Home prices YoY
- -12.4%
- Active inventory
- 565
- Price-to-rent
- 8.2×
Monthly cashflow live
- Estimated rent
- $2,479 high interval (Pro) →
- Mortgage (P&I)
- −$1,285
- Tax from tax record
- −$597 /mo · $7,158/yr
- Insurance
- −$102
- HOA
- −$0
- Vacancy / Maint / Mgmt
- −$521
- Net cashflow
- $-25
Break-even live
UW: 25.0% down · 7.5% · 30yr · 1.5% tax · 5.0% vac · 8.0% maint · 8.0% mgmt
Financing live
Cash to close
- Down payment
- $61,250
- Closing costs
- $7,350
- Reserves months
- —
- Total cash needed
- —
Loan-product check · same deal, 3 products live
Conventional
25% down · 7.5% · 30yr
- Down + closing
- —
- Monthly P&I
- —
- Monthly cashflow
- —
- DSCR
- —
- Eligible?
- —
Personal DTI + credit; lowest rate.
DSCR
20% down · 8.5% · 30yr
- Down + closing
- —
- Monthly P&I
- —
- Monthly cashflow
- —
- DSCR
- —
- Eligible?
- —
No personal income docs; deal must DSCR.
Hard money
10% down · 12.0% · 12mo
- Down + closing
- —
- Monthly P&I
- —
- Monthly cashflow
- —
- DSCR
- —
- Eligible?
- —
Short-term bridge; refi at stabilization.
Rent comps 6 comps
| Address | Beds | Baths | Sqft | Rent | $/sqft | DOM | Units | Dist |
|---|---|---|---|---|---|---|---|---|
| 812 Rodgers Ave Godley, TX | 3.0 | 2.0 | 1747 | $2,600 | $1.49 | 43d | 1 | 0.46mi |
| 226 Harp Ave Godley, TX | 3.0 | 2.0 | 1737 | $2,400 | $1.38 | 1d | 1 | 0.50mi |
| 201 Cliff Ct Godley, TX | 3.0 | 2.0 | 1852 | $2,900 | $1.57 | 10d | 1 | 0.70mi |
| 644 The Cottages Dr Godley, TX | 3.0 | 2.0 | 1662 | $1,995 | $1.20 | 43d | 1 | 0.72mi |
| 920 Elk Ridge Run Godley, TX | 3.0 | 2.0 | 1692 | $2,499 | $1.48 | 16d | 1 | 1.30mi |
| 920 Elk Ridge Run Godley, TX | 3.0 | 2.0 | 1683 | $2,499 | $1.48 | 10d | 1 | 1.30mi |
Listing history 33 events
-
2026-06-18days on market $245,000 Active 32 DOM
-
2026-06-17days on market $245,000 Active 31 DOM
-
2026-06-16days on market $245,000 Active 30 DOM
-
2026-06-15days on market $245,000 Active 29 DOM
-
2026-06-13days on market $245,000 Active 27 DOM
-
2026-06-13days on market $245,000 Active 26 DOM
-
2026-06-09days on market $245,000 Active 23 DOM
-
2026-06-08days on market $245,000 Active 22 DOM
-
2026-06-07days on market $245,000 Active 21 DOM
-
2026-06-04days on market $245,000 Active 18 DOM
-
2026-06-03days on market $245,000 Active 17 DOM
-
2026-06-02days on market $245,000 Active 16 DOM
-
2026-06-01days on market $245,000 Active 15 DOM
-
2026-05-31days on market $245,000 Active 14 DOM
-
2026-05-17$245,000 Active
-
2024-10-21historical
-
2024-07-24price $245,000
-
2024-07-02price $257,500
-
2024-06-17price $262,500
-
2024-05-12$265,000 Active
-
2022-05-20soldstatus
-
2022-05-19soldstatus Closed 302-char remark
Show marketing remark (302 chars)
3-2 home in Godley. 2 living areas with wood floors , kitchen with tile countertops, built in microwave , large dining area and walk in pantry. Spacious bedrooms with wood floors. Enjoy the wonderful outdoors on the wooden deck with large fenced backyard. Showings to begin on Friday April 1st at 5pm
-
2022-05-05status Pending 302-char remark
Show marketing remark (302 chars)
3-2 home in Godley. 2 living areas with wood floors , kitchen with tile countertops, built in microwave , large dining area and walk in pantry. Spacious bedrooms with wood floors. Enjoy the wonderful outdoors on the wooden deck with large fenced backyard. Showings to begin on Friday April 1st at 5pm
-
2022-04-23historical Active Option Contract 302-char remark
Show marketing remark (302 chars)
3-2 home in Godley. 2 living areas with wood floors , kitchen with tile countertops, built in microwave , large dining area and walk in pantry. Spacious bedrooms with wood floors. Enjoy the wonderful outdoors on the wooden deck with large fenced backyard. Showings to begin on Friday April 1st at 5pm
-
2022-04-05price $249,900 302-char remark
Show marketing remark (302 chars)
3-2 home in Godley. 2 living areas with wood floors , kitchen with tile countertops, built in microwave , large dining area and walk in pantry. Spacious bedrooms with wood floors. Enjoy the wonderful outdoors on the wooden deck with large fenced backyard. Showings to begin on Friday April 1st at 5pm
-
2022-03-29$267,500 Active 302-char remark
Show marketing remark (302 chars)
3-2 home in Godley. 2 living areas with wood floors , kitchen with tile countertops, built in microwave , large dining area and walk in pantry. Spacious bedrooms with wood floors. Enjoy the wonderful outdoors on the wooden deck with large fenced backyard. Showings to begin on Friday April 1st at 5pm
-
2017-03-14status Pending
-
2017-03-01historical Active Option Contract
-
2017-02-27historical
-
2017-02-17$143,900 Active
-
2013-05-10historical
-
2013-03-04price $114,500
-
2013-01-18$119,000 Active
ⓘ Source: listings_history table (triggers on properties + properties_extension) + one-shot
backfill from property_details.listing_events for pre-trigger history.
Tax reassessment forecast TX · Resets to sale price
- Current annual tax
- $7,158 · $597/mo
- Projected year-2 tax
- $7,158 · $597/mo
- Expected delta
- $0/yr ($0/mo · 0.0%)
ⓘ Screening estimate from a state-policy table — verify with the county assessor before closing.
Climate risk First Street
- Flood 1/10 Low FEMA zone X (unshaded) · 0% chance over 30 yrs
- Wildfire 6/10 Major
- Heat 7/10 Severe 7 d/yr ≥109°F today · 24 d/yr by 30 yrs out
- Wind 6/10 Major 27% chance of damaging wind over 30 yrs
- Air quality 2/10 Low 1 unhealthy d/yr today · 2 by 30 yrs out
Nearby sold comps map
Loading sold comps map…
Walkable amenities ~0.75 mi
Loading nearby amenities…
Taxation est. · year 1
- Rental income
- $29,744
- − Mortgage interest
- −$13,724
- − Property taxes
- −$7,158
- − Insurance
- −$1,225
- − Repairs & maintenance
- −$2,380
- − Management
- −$2,380
- − Depreciation
- −$7,127
- Taxable loss
- −$4,250
- Est. tax savings @ 24.0%
- +$1,020
- After-tax cash flow
- $716/yr
For passive investors: Depreciation is non-cash, so a rental often shows a tax loss while cash-flowing — sheltering income. Rental losses are passive: they offset passive income freely, and up to $25,000/yr can offset ordinary (W-2) income if you actively participate and your MAGI is under $100k (phasing out to $0 by $150k); unused losses carry forward. On sale, claimed depreciation is recaptured at up to 25%, and gains may owe capital-gains tax (a 1031 exchange can defer both). Figures are a year-1 estimate at your 24.0% rate — not tax advice; consult a CPA.
Schools (NCES district)
- District
- Godley ISD
- NCES district ID
- 4820960
- Math proficiency
- 34% ▼ -4.00%
- Reading proficiency
- 38% ▲ 2.00%
- Median HH income
- $59,332
- Composite
- 32.06/100
- National rank
- #5820
- State rank
- #466 of 826 in TX
Livability — Godley
- Score
- 73/100
- State rank
- #226
- US rank
- #5528
Category grades
Schools grade is shown separately in the Schools card above.
Census & demographics
- Census place
- Godley, TX
- Population (ZIP)
- 8,759
Population outlook (Johnson County) Hauer SSP2
- Today (2025)
- 179,678 people
- By 2030
- 189,208 · +5.3%
- By 2040
- 207,261 · +15.4%
- By 2050
- 223,064 · +24.1%
- By 2075
- 259,979 · +44.7%
- By 2100
- 275,395 · +53.3%
Race, ethnicity, and origin ACS 2023
- Neighborhood character
- Predominantly White (76%)
- Race & ethnicity
- White 76% Hispanic / Latino 19% Two or more races 9% Black 3%
- Hispanic origin (detail)
- Mexican 14%
- Common ancestry
- Slovak 2% Romanian 1% Iranian 1%
- Foreign-born
- 4% · Canada
- Languages at home
- 88% English-only · Spanish 11%
Political lean MEDSL · Johnson
- 2024 margin
- Solid R (+51.4) · D 23.9% · R 75.3%
- 2008→2024 swing
- -3.9pp toward R · 2008: -47.5pp · 2024: -51.4pp
- All cycles
- 2024: R+51.4 2020: R+53.0 2016: R+58.3 2012: R+55.6 2008: R+47.5
Not yet ingested
- Civics
- —
Market trends
- HPI YoY
- ▼ -36.58%
- Current HPI
- 259.1029
- Rent YoY
- —
- Metro
- —
- State GDP YoY
- ▲ 3.95%
- F500 in state
- 110
Industry mix (Fortune 500 HQ in TX)
| Industry | F500 HQs | Revenue |
|---|---|---|
| Energy | 16 | $1,198B |
|
||
| Technology | 5 | $198B |
|
||
| Engineering / Construction | 4 | $72B |
|
||
| Energy Services | 3 | $60B |
|
||
| Utilities | 3 | $41B |
|
||
| Healthcare | 2 | $330B |
|
||
Price history
+105.9% since first listed19 events — show timeline
- 2026-05-17 Listed $245,000 NTREIS
- 2024-10-21 Listing Removed — NTREIS
- 2024-07-24 Price Changed $245,000 NTREIS
- 2024-07-02 Price Changed $257,500 NTREIS
- 2024-06-17 Price Changed $262,500 NTREIS
- 2024-05-12 Listed $265,000 NTREIS
- 2022-05-20 Sold (Public Records) — Public Records
- 2022-05-19 Sold (MLS) — NTREIS
- 2022-05-05 Pending — NTREIS
- 2022-04-23 Contingent — NTREIS
- 2022-04-05 Price Changed $249,900 NTREIS
- 2022-03-29 Listed $267,500 NTREIS
- 2017-03-14 Pending — NTREIS
- 2017-03-01 Contingent — NTREIS
- 2017-02-27 Listing Removed — NTREIS
- 2017-02-17 Listed $143,900 NTREIS
- 2013-05-10 Listing Removed — NTREIS
- 2013-03-04 Price Changed $114,500 NTREIS
- 2013-01-18 Listed $119,000 NTREIS
Property tax history
+9.1%/yrLatest (2025): $7,158 · +31.6% YoY. Source: county tax records.
Cash-flow waterfall
monthlySold comps — $/sqft
last 12 mo · ≤1 miLoading sold comps…