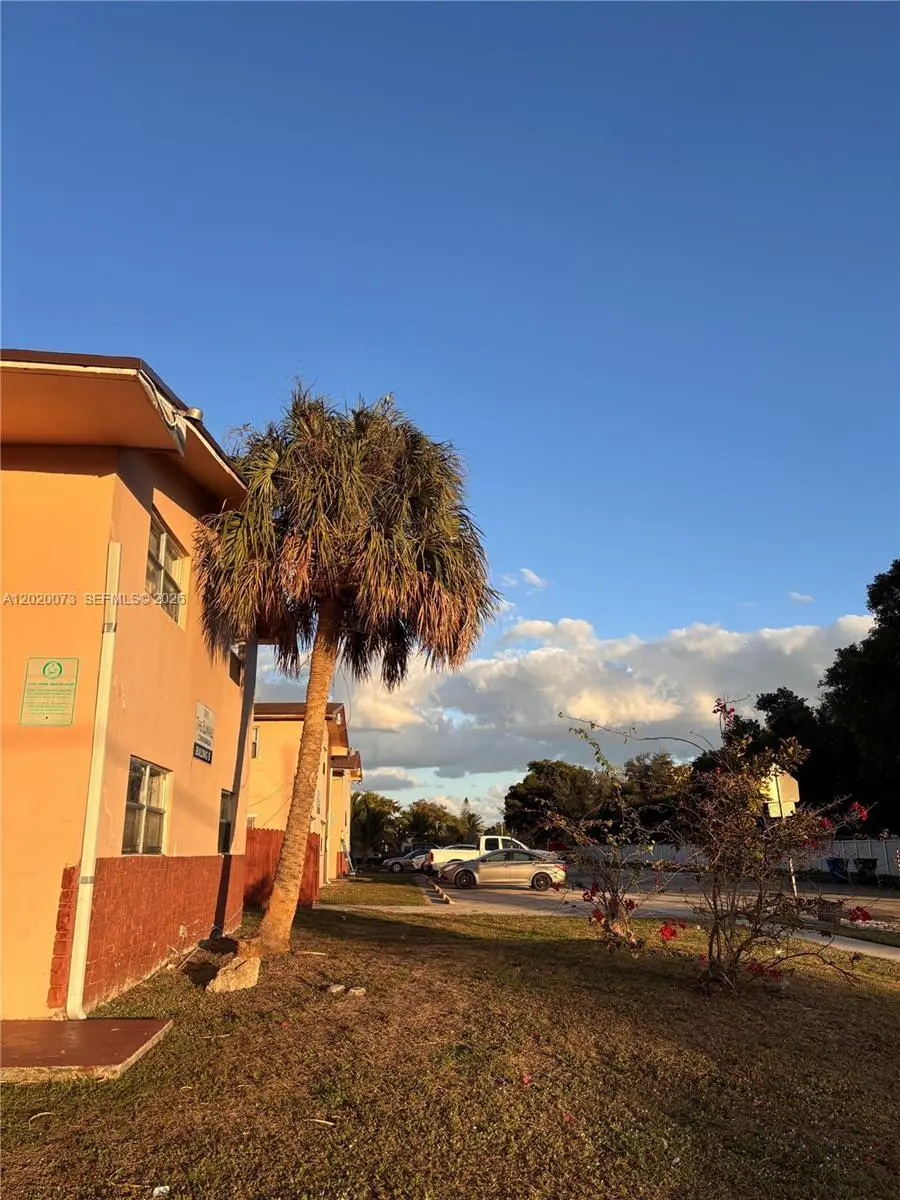
7481 SW 10th Ct Unit 202C · North Lauderdale, FL
Flood risk No data
- FEMA flood zone
- —
- Chance of flooding over 30 yrs
- —
- Est. flood insurance / yr
- —
Fire risk No data
- Est. fire insurance / yr
- —
Heat risk No data
- Hot days now (above threshold)
- —
- Hot days in 30 yrs
- —
Wind risk No data
- Chance of severe wind over 30 yrs
- —
Air-quality risk No data
- Unhealthy air days now
- —
- Unhealthy air days in 30 yrs
- —
Risk factors via First Street. Map © Google.
Why this score? — see what drove the C grade
The composite is a weighted blend of 9 inputs, each scored 0–100. Each bar is that input's sub-score; the figure is the points it added to the 100-point composite (weight × sub-score).
- Cash flow +19.4/30.0
- 1% rule +9.6/10.0
- ARV discount +7.5/15.0
- DSCR +6.1/10.0
- Schools +4.1/10.0
- Livability +3.8/5.0
- Condition / age +2.5/5.0
- Rent growth +2.3/5.0
- Appreciation +0.0/10.0
$179,900
🖨 Deal sheet 📄 Offer letter ✓ Due diligence
Listing remarks
Priced to sell! Spacious corner condo unit featuring 3 bedrooms and 2 bathrooms. This bright unit offers laundry in unit, tile flooring throughout, and plenty of natural light. Upgrades include: Remodeled kitchen, newer fridge, bathroom exhaust fans and ventilation vents, ceiling fan in primary bedroom. Investor-friendly community, making it an excellent opportunity for both homeowners and investors. Conveniently located near shopping and schools. Easy to show, priced to sell! Buyer to verify HOA fees, rules and restrictions.
Key facts
- Rental potential
- Corner condo unit
- Washer and dryer
Tags
Property features AI
Finance
- Other: Annual tax information on file
- Financial info: Pets allowed with restrictions or conditions
- HOA & community: Monthly association fee of $587; HOA covers common areas; Community storage available
Exterior
- Parking: Two or more parking spaces
- Utilities: Has heating; Ceiling fan cooling (as listed)
- Home design: 2-story residence; Attached property; Second-floor entry
- Construction: Block construction; Resale property
- Exterior features: No notable exterior features listed
Interior
- Flooring: Tile
- Bathrooms: 2 full bathrooms
- Heating & cooling: Central heating; Ceiling fans
- Interior features: Second-floor entry; Tile flooring
- Laundry & utility: Washer; Dryer; Refrigerator
Neighborhood map
What this means for you Summary
Snapshot
- This is a 3-bed/2.0-bath condo listed at $180k.
Deal economics
- At list price, monthly cash flow is $202 ($2k/yr) — positive.
- The deal already cash-flows at list — no discount required.
- Meets the 1% rule at list price ($3k rent vs $180k).
- Recommended offer: $175k (3.0% below list) — sets the bar for market timing.
- Cap rate 7.6% vs local median 4.3% in North Lauderdale — top-decile yield for the area; either an underpriced asset or a hidden risk that comps aren't pricing in. Stress-test before assuming the spread holds.
Location & tenants
- Location reads 76/100 on livability (#230 in FL, #3,635 nationally) — a middle-class / working-renter tenant base. Strengths: housing A+, health & safety A+, cost of living A; Watch: commute C-, employment D, amenities F.
- Broward (suburban): math 42% / reading 53% proficiency, ranked #46 of 73 in FL (top 63%) — families likely to look elsewhere, expect single-tenant / working-renter base with shorter leases.
- Market conditions: Rents soft (-0.7%/yr); 298 active listings in the ZIP; 40 comparable units currently listed for rent nearby; rentals at typical pace (median 22d on market — plan ~3-4 weeks tenant-placement turnaround); 2,111 units permitted in Broward County in 2024 (1,265 in 5+ unit buildings).
- At $2,626/mo this rent would consume 49% of the median local household income ($64k/yr) (locally 3073% of renters already pay >50% of income on rent) — very limited rent-growth headroom before tenants either downsize or default.
Forward outlook
- Local home prices are declining (-3.0%/yr); year-one equity from $1k of loan paydown is wiped out by about $5k of value loss. Plan a longer hold.
- Broward County population projected at +34% by 2050 — long-run rental-demand tailwind backs the buy-and-hold thesis.
Negotiation context
- It's been on market 31 days — a 3% lower offer ($175k) is reasonable based on typical stale-listing flexibility.
- Current owner paid $10k; list at $180k implies a 1699% gain — meaningful room to come down on a strong offer.
Risks & watch-outs
- Watch-outs: HOA is 22% of rent.
Questions for the listing agent
- It's been on market 31 days. Have you received any prior offers? Is the seller open to a 3% concession, seller financing, or rate buy-down credit?
- Built in 1971 — when were the roof, HVAC, electrical panel, plumbing, and water heater last replaced?
- What does the HOA fee cover, when was the last increase, and are there any pending special assessments or reserve-fund shortfalls?
- Any open or pending special assessments — roof, HVAC, plumbing, elevator, façade? What's the per-unit balance and payoff schedule, and is the seller paying it off at close or rolling it to the buyer?
- Is there a deadline driving the sale (1031 exchange, divorce, estate, relocation)? That informs how much negotiation room exists.
- What's the average days-on-market for RENTAL listings here right now (not sales)? A rising rental-DOM trend means longer vacancies and softer asking-rent achievability than the comps imply.
- What's the recent tenant-quality profile in this submarket — average credit score on applications, eviction rate, late-payment / NSF rate, and stable-employment percentage? A property-management company in the area should have these aggregated.
- How much new apartment / multifamily construction is in the pipeline within 1–3 miles? Heavy new supply (>2% of stock underway) typically softens rents 12–24 months out; light construction supports rent growth.
Investment metrics
- 1% rule
- 1.46% ✓
- Cap rate
- 7.64%
- Cash-on-cash
- 4.82%
- DSCR
- 1.21
- GRM
- 5.7
CMA / ARV
No comps found within radius.
Projected returns pro-forma
-3.0% appreciation · 0.0% rent growth · sell at horizon
- IRR
- -13.6%
- Equity multiple
- 0.53×
- Total profit
- $-23,540
- Equity at exit
- $26,824
- IRR
- -13.6%
- Equity multiple
- 0.37×
- Total profit
- $-31,922
- Equity at exit
- $15,554
Cash invested: $50,372 (down + closing). Projections, not guarantees.
Landlord ↔ Tenant lean methodology
- Overall (STATE)
- 87 Strongly Landlord-Friendly
- State Florida
- 87 Strongly Landlord-Friendly · R+3
- County
- — inherits STATE
- City
- — inherits STATE
ZIP-level market 33068
- Rents YoY
- -0.7%
- Active inventory
- 298
- Price-to-rent
- 5.7×
Monthly cashflow live
- Estimated rent
- $2,626 high interval (Pro) →
- Mortgage (P&I)
- −$943
- Tax from tax record
- −$267 /mo · $3,204/yr
- Insurance
- −$75
- HOA
- −$587
- Vacancy / Maint / Mgmt
- −$551
- Net cashflow
- $202
Break-even live
UW: 25.0% down · 7.5% · 30yr · 1.5% tax · 5.0% vac · 8.0% maint · 8.0% mgmt
Financing live
Cash to close
- Down payment
- $44,975
- Closing costs
- $5,397
- Reserves months
- —
- Total cash needed
- —
Loan-product check · same deal, 3 products live
Conventional
25% down · 7.5% · 30yr
- Down + closing
- —
- Monthly P&I
- —
- Monthly cashflow
- —
- DSCR
- —
- Eligible?
- —
Personal DTI + credit; lowest rate.
DSCR
20% down · 8.5% · 30yr
- Down + closing
- —
- Monthly P&I
- —
- Monthly cashflow
- —
- DSCR
- —
- Eligible?
- —
No personal income docs; deal must DSCR.
Hard money
10% down · 12.0% · 12mo
- Down + closing
- —
- Monthly P&I
- —
- Monthly cashflow
- —
- DSCR
- —
- Eligible?
- —
Short-term bridge; refi at stabilization.
Rent comps 40 comps
| Address | Beds | Baths | Sqft | Rent | $/sqft | DOM | Units | Dist |
|---|---|---|---|---|---|---|---|---|
| 7480 SW 10th Ct #1 North Lauderdale, FL | 3.0 | 2.0 | 1200 | $3,249 | $2.71 | 24d | 1 | 0.05mi |
| 1001 SW 74th Ave Unit 201a North Lauderdale, FL | 3.0 | 2.0 | 1150 | $2,650 | $2.30 | 5d | 1 | 0.10mi |
| 7400 Kimberly Blvd Unit 202A North Lauderdale, FL | 3.0 | 2.0 | 1150 | $2,800 | $2.43 | 8d | 1 | 0.11mi |
| 7431 Tam Oshanter Blvd Unit 7431 North Lauderdale, FL | 2.0 | 1.5 | 816 | $2,100 | $2.57 | 17d | 1 | 0.11mi |
| 7431 Tam Oshanter Blvd Unit 7431 North Lauderdale, FL | 2.0 | 1.5 | 816 | $2,350 | $2.88 | 5d | 1 | 0.11mi |
| 881 SW 74th Ter Unit 102C North Lauderdale, FL | 3.0 | 2.0 | 1150 | $2,200 | $1.91 | 24d | 1 | 0.14mi |
| 861 SW 74th Ter Unit 102D North Lauderdale, FL | 3.0 | 2.0 | 1150 | $2,100 | $1.83 | 24d | 1 | 0.15mi |
| 7336 SW 8th Ct #6 North Lauderdale, FL | 2.0 | 2.0 | 1056 | $2,100 | $1.99 | 24d | 1 | 0.19mi |
| 1213 SW 74th Ave North Lauderdale, FL | 4.0 | 2.0 | 1150 | $4,100 | $3.57 | 24d | 1 | 0.22mi |
| 7603 Kimberly Blvd North Lauderdale, FL | 3.0 | 2.0 | 1145 | $2,875 | $2.51 | 24d | 1 | 0.22mi |
| 7701 SW 10th Ct Unit 1A North Lauderdale, FL | 3.0 | 1.0 | 1060 | $2,350 | $2.22 | 14d | 1 | 0.30mi |
| 7664 Kimberly Blvd Unit 1-3 North Lauderdale, FL | 2.0 | 1.0 | 792 | $1,850 | $2.34 | 5d | 1 | 0.32mi |
| 7721 SW 10th Ct Unit B North Lauderdale, FL | 3.0 | 1.0 | 1050 | $1,950 | $1.86 | 24d | 1 | 0.33mi |
| 7731 SW 10th Ct Unit 4 North Lauderdale, FL | 3.0 | 1.0 | 1200 | $2,500 | $2.08 | 17d | 1 | 0.35mi |
| 1177 Sussex Dr North Lauderdale, FL | 2.0 | 1.0 | 1236 | $2,370 | $1.92 | 24d | 1 | 0.42mi |
| 1400 Avon Ln North Lauderdale, FL | 1.0–3.0 | 1.0–2.0 | 1070 | $2,876 | $2.69 | 2d | 58 | 0.45mi |
| 7830 SW 10th Ct Unit A North Lauderdale, FL | 3.0 | 2.0 | 960 | $2,750 | $2.86 | 24d | 1 | 0.46mi |
| 7820 SW 9th St North Lauderdale, FL | 2.0 | 2.0 | 850 | $2,510 | $2.95 | 11d | 1 | 0.56mi |
| 7820 SW 9th St North Lauderdale, FL | 2.0 | 2.0 | 850 | $2,510 | $2.95 | 8d | 1 | 0.56mi |
| 7820 SW 9th St North Lauderdale, FL | 2.0 | 2.0 | 994 | $2,576 | $2.59 | 12d | 1 | 0.56mi |
| 6897 SW 7th St Margate, FL | 2.0 | 1.0 | 827 | $1,895 | $2.29 | 17d | 1 | 0.60mi |
| 7710 SW 6th St North Lauderdale, FL | 2.0 | 1.0 | 1056 | $2,525 | $2.39 | 3d | 1 | 0.61mi |
| 7906 SW 8th St North Lauderdale, FL | 3.0 | 2.5 | 1440 | $3,500 | $2.43 | 5d | 1 | 0.61mi |
| 6891 SW 7th St Margate, FL | 2.0 | 1.0 | 827 | $1,995 | $2.41 | 22d | 1 | 0.61mi |
| 7900 Hampton Blvd North Lauderdale, FL | 1.0–2.0 | 1.0–2.0 | 925 | $2,364 | $2.56 | 2d | 35 | 0.64mi |
| 631 Kathy Ct Margate, FL | 2.0 | 2.0 | 875 | $1,995 | $2.28 | 17d | 1 | 0.64mi |
| 931 SW 80th Ave Unit A North Lauderdale, FL | 3.0 | 2.0 | 1000 | $2,795 | $2.79 | 24d | 1 | 0.64mi |
| 6533 Harbour Rd North Lauderdale, FL | 4.0 | 2.0 | 1180 | $3,850 | $3.26 | 24d | 1 | 0.67mi |
| 8040 Hampton Blvd #508 North Lauderdale, FL | 2.0 | 2.0 | 1350 | $2,300 | $1.70 | 24d | 1 | 0.67mi |
| 8030 Hampton Blvd #414 North Lauderdale, FL | 2.0 | 2.0 | 1350 | $1,950 | $1.44 | 24d | 1 | 0.69mi |
| 6551 Boulevard of Champions #6551 North Lauderdale, FL | 4.0 | 2.5 | 1472 | $2,600 | $1.77 | 8d | 1 | 0.70mi |
| 6551 Boulevard of Champions #6551 North Lauderdale, FL | 4.0 | 2.5 | 1472 | $2,600 | $1.77 | 24d | 1 | 0.70mi |
| 709 SW 79th Ter North Lauderdale, FL | 2.0 | 2.0 | 1152 | $2,950 | $2.56 | 24d | 1 | 0.70mi |
| 401 SW 76th Ter North Lauderdale, FL | 4.0 | 2.0 | 1370 | $3,500 | $2.55 | 24d | 1 | 0.70mi |
| 7306 SW 3rd Ct North Lauderdale, FL | 3.0 | 2.0 | 1288 | $2,685 | $2.08 | 21d | 1 | 0.71mi |
| 563 Kathy Ct Margate, FL | 2.0 | 2.0 | 875 | $2,035 | $2.33 | 24d | 1 | 0.72mi |
| 568 Kathy Ct Margate, FL | 2.0 | 2.0 | 875 | $1,995 | $2.28 | 24d | 1 | 0.73mi |
| 551 Kathy Ct Margate, FL | 2.0 | 1.0–2.0 | 851 | $1,945 | $2.29 | 3d | 2 | 0.73mi |
| 726 SW 81st Ter Unit 14A North Lauderdale, FL | 3.0 | 2.0 | 990 | $2,350 | $2.37 | 24d | 1 | 0.74mi |
| 726 SW 81st Ter Unit 14A North Lauderdale, FL | 3.0 | 2.0 | 990 | $2,350 | $2.37 | 15d | 1 | 0.74mi |
HOA detail condo
- Monthly dues
- $587 · $7,044/yr
- Assessments
- None detected in remarks — confirm with the listing agent.
Listing history 16 events
-
2026-06-18days on market $179,900 Active 31 DOM
-
2026-06-17days on market $179,900 Active 30 DOM
-
2026-06-16days on market $179,900 Active 29 DOM
-
2026-06-15days on market $179,900 Active 28 DOM
-
2026-06-13days on market $179,900 Active 26 DOM
-
2026-06-09days on market $179,900 Active 22 DOM
-
2026-06-08remarks 533-char remark
-
2026-06-08days on market $179,900 Active 21 DOM
-
2026-06-07days on market $179,900 Active 20 DOM
-
2026-06-04days on market $179,900 Active 17 DOM
-
2026-06-03days on market $179,900 Active 16 DOM
-
2026-06-02days on market $179,900 Active 15 DOM
-
2026-06-01days on market $179,900 Active 14 DOM
-
2026-05-31days on market $179,900 Active 13 DOM
-
2026-05-18$179,900 Active
-
1997-08-01soldstatus $10,000
ⓘ Source: listings_history table (triggers on properties + properties_extension) + one-shot
backfill from property_details.listing_events for pre-trigger history.
Tax reassessment forecast FL · Resets to sale price
- Current annual tax
- $3,204 · $267/mo
- Projected year-2 tax
- $3,204 · $267/mo
- Expected delta
- $0/yr ($0/mo · 0.0%)
ⓘ Screening estimate from a state-policy table — verify with the county assessor before closing.
Nearby sold comps map
Loading sold comps map…
Walkable amenities ~0.75 mi
Loading nearby amenities…
Taxation est. · year 1
- Rental income
- $31,513
- − Mortgage interest
- −$10,077
- − Property taxes
- −$3,204
- − Insurance
- −$900
- − Repairs & maintenance
- −$2,521
- − Management
- −$2,521
- − HOA
- −$7,044
- − Depreciation
- −$5,233
- Taxable income
- $13
- Est. tax owed @ 24.0%
- −$3
- After-tax cash flow
- $2,424/yr
For passive investors: Depreciation is non-cash, so a rental often shows a tax loss while cash-flowing — sheltering income. Rental losses are passive: they offset passive income freely, and up to $25,000/yr can offset ordinary (W-2) income if you actively participate and your MAGI is under $100k (phasing out to $0 by $150k); unused losses carry forward. On sale, claimed depreciation is recaptured at up to 25%, and gains may owe capital-gains tax (a 1031 exchange can defer both). Figures are a year-1 estimate at your 24.0% rate — not tax advice; consult a CPA.
Schools (NCES district)
- District
- Broward
- NCES district ID
- 1200180
- Math proficiency
- 42% ▼ -18.00%
- Reading proficiency
- 53% ▼ -5.00%
- Median HH income
- $52,139
- Composite
- 40.88/100
- National rank
- #3621
- State rank
- #46 of 73 in FL
Livability — North Lauderdale
- Score
- 76/100
- State rank
- #230
- US rank
- #3635
Category grades
Schools grade is shown separately in the Schools card above.
Census & demographics
- Census place
- North Lauderdale, FL
- County
- Broward County · 1,963,430 people
- City population
- 54,439
- Metro
- Miami-Fort Lauderdale-Pompano Beach, FL
- Population (ZIP)
- 54,439
- Household income
- $64,051
- Rent vs Own
- Severe rent burden
- 3073.0
Population outlook (Broward County) Hauer SSP2
- Today (2025)
- 2,207,033 people
- By 2030
- 2,360,704 · +7.0%
- By 2040
- 2,661,208 · +20.6%
- By 2050
- 2,946,698 · +33.5%
- By 2075
- 3,602,273 · +63.2%
- By 2100
- 3,970,984 · +79.9%
Race, ethnicity, and origin ACS 2023
- Neighborhood character
- Diverse neighborhood (Simpson 0.61)
- Race & ethnicity
- Black 58% Hispanic / Latino 21% Two or more races 13% White 11% Asian 4%
- Hispanic origin (detail)
- Mexican 3% Puerto Rican 4% Cuban 1% Dominican 3%
- Common ancestry
- Hispanic 17% Estonian 1% Lithuanian 1%
- Foreign-born
- 47% · Canada, Jamaica, Vietnam
- Languages at home
- 59% English-only · Spanish 19% French/Haitian/Cajun 15% Other Indo-European 2%
Political lean MEDSL · Broward
- 2024 margin
- D (+17.0) · D 58.0% · R 41.0%
- 2008→2024 swing
- -17.8pp toward R · 2008: 34.7pp · 2024: 17.0pp
- All cycles
- 2024: D+17.0 2020: D+29.8 2016: D+35.0 2012: D+34.9 2008: D+34.7
Not yet ingested
- Civics
- —
Market trends
- HPI YoY
- ▼ -317.60%
- Current HPI
- 426.2972
- Rent YoY
- ▼ -0.74%
- Metro
- Miami-Fort Lauderdale-Pompano Beach, FL
- State GDP YoY
- ▲ 3.28%
- F500 in state
- 36
Industry mix (Fortune 500 HQ in FL)
| Industry | F500 HQs | Revenue |
|---|---|---|
| Industrial Technology | 2 | $29B |
|
||
| Insurance | 2 | $17B |
|
||
| Retail | 1 | $60B |
|
||
| Technology Distribution | 1 | $58B |
|
||
| Homebuilding | 1 | $35B |
|
||
| Technology Manufacturing | 1 | $35B |
|
||
Price history
+1699.0% since first listed2 events — show timeline
- 2026-05-18 Listed $179,900 MARMLS
- 1997-08-01 Sold (Public Records) $10,000 Public Records
Property tax history
+8.2%/yrLatest (2025): $3,204 · +2.9% YoY. Source: county tax records.
Cash-flow waterfall
monthlySold comps — $/sqft
last 12 mo · ≤1 miLoading sold comps…