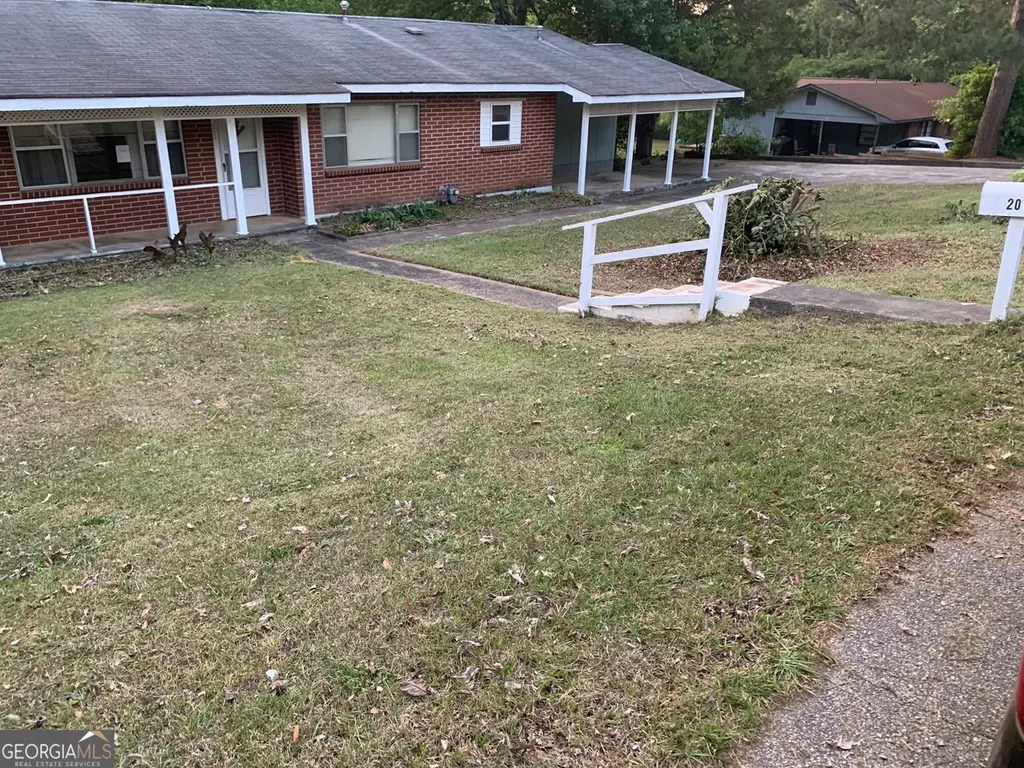
201 Davis Dr · Centerville, GA
Flood risk 1/10 · Minimal
- FEMA flood zone
- X (unshaded)
- Chance of flooding over 30 yrs
- 0.0%
- Est. flood insurance / yr
- $507 – $1,088
Fire risk 3/10 · Minor
- Est. fire insurance / yr
- $963 – $1,789
Heat risk 7/10 · Major
- Hot days now (above 108°F)
- 7 days/yr
- Hot days in 30 yrs
- 18 days/yr
Wind risk 6/10 · Moderate
- Chance of severe wind over 30 yrs
- 73.0%
Air-quality risk 3/10 · Minor
- Unhealthy air days now
- 2 days/yr
- Unhealthy air days in 30 yrs
- 3 days/yr
Risk factors via First Street. Map © Google.
Why this score? — see what drove the B grade
The composite is a weighted blend of 9 inputs, each scored 0–100. Each bar is that input's sub-score; the figure is the points it added to the 100-point composite (weight × sub-score).
- Cash flow +27.2/30.0
- ARV discount +15.0/15.0
- DSCR +9.5/10.0
- 1% rule +6.6/10.0
- Schools +3.9/10.0
- Livability +3.7/5.0
- Rent growth +2.5/5.0
- Condition / age +2.5/5.0
- Appreciation +0.0/10.0
$145,000
🖨 Deal sheet (PDF) 📄 Offer letter ✓ Due diligence
Listing remarks
All brick house waiting for the TLC required to turn it into a lovely home. Located in a quiet neighborhood with close proximity to schools, shopping and churches. Don't miss out on the City's events and water park. Large lot with shade and an outbuilding for all your lawn care equipment. Parking pad
Key facts
- Outbuilding
- Large lot
- Parking pad
Tags
Property features AI
Finance
- Other: Lot size approximately 0.41 acre
- Financial info: Listing is real estate owned (REO); Accepts cash and conventional financing
- HOA & community: No HOA
Exterior
- Parking: Attached carport (1 parking space)
- Utilities: Public water; Public sewer; Cable available; Natural gas available; Sewer connected
- Home design: Single-family house; One level; Residential property; Property listed as fixer
- Construction: Brick construction; Composition roof; Slab foundation; Built in 1965
- Exterior features: Front porch; Chain link fencing; Outbuilding on the property; Corner lot
Interior
- Kitchen: Breakfast room; Microwave
- Bedrooms: 3 bedrooms (all on the main level)
- Flooring: Carpet; Tile
- Bathrooms: 1 full bathroom; 1 half bathroom
- Heating & cooling: Central heating; Electric cooling
- Interior features: Bookcases; Tile bath; No common walls; Family room fireplace
- Laundry & utility: Laundry located in hall; Electric water heater
Neighborhood map
What this means for you Summary
Snapshot
- This is a 3-bed/2.0-bath single-family listed at $145k.
Deal economics
- At list price, monthly cash flow is $415 ($5k/yr) — positive.
- The deal already cash-flows at list — no discount required.
- Meets the 1% rule at list price ($2k rent vs $145k).
- Recommended offer: $141k (3.0% below list) — sets the bar for market timing.
- Cap rate 9.7% vs local median 5.8% in Centerville — top-decile yield for the area; either an underpriced asset or a hidden risk that comps aren't pricing in. Stress-test before assuming the spread holds.
Location & tenants
- Location reads 73/100 on livability (#56 in GA) — a middle-class / working-renter tenant base. Strengths: cost of living A+, housing A+, health & safety A-; Watch: amenities F, commute F.
- Houston County (urban): math 43% / reading 46% proficiency, ranked #23 of 174 in GA (top 13%) — families likely to look elsewhere, expect single-tenant / working-renter base with shorter leases.
- Zoned schools: Centerville Elementary School (math 50% / reading 49%, grade D, #264 of 1,228 statewide, top 23%, 630 students, 84% FRL); Thomson Middle School (math 29% / reading 34%, grade F, #234 of 470 statewide, top 50%, 736 students, 84% FRL); Northside High School (math 5% / reading 21%, grade F, #331 of 424 statewide, top 78%, 1,959 students, 84% FRL) — zoned schools average 84% FRL vs 46% district-wide (38 pts higher); higher-poverty schools than district average — tighter screening recommended.
- Zoned-school proficiency averages 31% at this address vs 44% district-wide (-13 pts) — the specific schools serving this property underperform the Houston County average; the district grade overstates school quality for this exact location.
- Market conditions: 37 active listings in the ZIP; 28 comparable units currently listed for rent nearby; rentals at typical pace (median 22d on market — plan ~3-4 weeks tenant-placement turnaround); 43% of comp listings sitting > 30 days — soft ceiling on asking rent; solid renter incomes; 1,545 units permitted in Houston County in 2024 (336 in 5+ unit buildings).
Forward outlook
- Local home prices are declining (-3.0%/yr); year-one equity from $1k of loan paydown is wiped out by about $4k of value loss. Plan a longer hold.
- Houston County population projected at +22% by 2050 — long-run rental-demand tailwind backs the buy-and-hold thesis.
- At projected returns (-3.0% appreciation + 3.0% rent growth), your $41k cash investment doubles in ~10 years — after that, you're playing with house money.
Negotiation context
- It's been on market 37 days — a 3% lower offer ($141k) is reasonable based on typical stale-listing flexibility.
Risks & watch-outs
- Climate carrying-cost: major wind risk, 73% chance of damaging wind over 30y; extreme-heat days projected 7→18/yr by 2055 (HVAC capex compounding) — expect insurance premiums to compound above CPI over the hold.
Questions for the listing agent
- It's been on market 37 days. Have you received any prior offers? Is the seller open to a 3% concession, seller financing, or rate buy-down credit?
- Built in 1965 — when were the roof, HVAC, electrical panel, plumbing, and water heater last replaced?
- Is there a deadline driving the sale (1031 exchange, divorce, estate, relocation)? That informs how much negotiation room exists.
- What's the average days-on-market for RENTAL listings here right now (not sales)? A rising rental-DOM trend means longer vacancies and softer asking-rent achievability than the comps imply.
- What's the recent tenant-quality profile in this submarket — average credit score on applications, eviction rate, late-payment / NSF rate, and stable-employment percentage? A property-management company in the area should have these aggregated.
- How much new for-sale + rental construction is in the pipeline within 1–3 miles? Heavy new supply typically softens prices + rents 12–24 months out; constrained supply supports both.
Investment metrics
- 1% rule
- 1.16% ✓
- Cap rate
- 9.73%
- Cash-on-cash
- 12.26%
- DSCR
- 1.55
- GRM
- 7.2
CMA / ARV
- ARV (median comp)
- $199,068
- List price
- $145,000
- Delta
- -27.16%
- Verdict
- UNDERPRICED
- Comps
- 20 within 1.0 mi
Show comp detail 12 sales within ~0.75 mi
| Address | Dist | Beds/Ba | Sqft | Sold | Price | $/sf | Match |
|---|---|---|---|---|---|---|---|
| 214 Mcvey Trl | 0.24mi | 3/2.0 | 1,421 (-2%) | 2mo | $238,000 | $167 | 85 |
| 105 Jeanette Pl | 0.21mi | 3/2.0 | 1,327 (-8%) | 2mo | $215,500 | $162 | 75 |
| 115 Montrose Ln | 0.42mi | 3/2.0 | 1,489 (+3%) | 2mo | $250,000 | $168 | 73 |
| 407 Collins Ave Ave | 0.26mi | 3/2.0 | 1,546 (+7%) | 4mo | $149,900 | $97 | 73 |
| 102 Westfield Dr | 0.51mi | 3/2.0 | 1,432 (-1%) | 5mo | $220,000 | $154 | 71 |
| 103 Ashlund Dr | 0.30mi | 3/2.0 | 1,544 (+7%) | 6mo | $205,000 | $133 | 70 |
| 111 Mason Dr | 0.32mi | 3/1.5 | 1,560 (+8%) | 7mo | $155,000 | $99 | 64 |
| 103 Shannon Ln | 0.45mi | 3/2.0 | 1,547 (+7%) | 4mo | $190,000 | $123 | 64 |
| 104 Kathryn Pl | 0.65mi | 3/2.0 | 1,424 (-2%) | 4mo | $235,000 | $165 | 63 |
| 101 Huntington Way | 0.45mi | 3/2.0 | 1,553 (+8%) | 8mo | $240,000 | $155 | 60 |
| 206 Westfield Dr | 0.55mi | 3/2.0 | 1,336 (-8%) | 8mo | $160,000 | $120 | 56 |
| 708 Houston Lake Blvd | 0.72mi | 3/2.0 | 1,232 (-15%) | 3mo | $215,000 | $175 | 39 |
Match score weights: distance 35% · size 25% · config 20% · recency 20%. Top-matched comps best support the ARV.
Projected returns pro-forma
-3.0% appreciation · 3.0% rent growth · sell at horizon
- IRR
- 1.9%
- Equity multiple
- 1.07×
- Total profit
- $2,899
- Equity at exit
- $21,620
- IRR
- 11.4%
- Equity multiple
- 1.90×
- Total profit
- $36,438
- Equity at exit
- $12,537
Cash invested: $40,600 (down + closing). Projections, not guarantees.
Landlord ↔ Tenant lean methodology
- Overall (STATE)
- 90 Strongly Landlord-Friendly
- State Georgia
- 90 Strongly Landlord-Friendly · R+3
- County
- — inherits STATE
- City
- — inherits STATE
ZIP-level market 31028
- Home prices YoY
- -21.7%
- Active inventory
- 37
- Price-to-rent
- 7.2×
Monthly cashflow live
- Estimated rent
- $1,686 high interval (Pro) →
- Mortgage (P&I)
- −$760
- Tax from tax record
- −$96 /mo · $1,158/yr
- Insurance
- −$60
- HOA
- −$0
- Vacancy / Maint / Mgmt
- −$354
- Net cashflow
- $415
Break-even live
Sensitivity live
| Price | -10% $497 | -5% $456 | +0% $415 | +5% $374 | +10% $333 |
|---|---|---|---|---|---|
| Rent | -10% $282 | -5% $348 | +0% $415 | +5% $481 | +10% $548 |
| Rate | -1.0pp $488 | -0.5pp $452 | base $415 | +0.5pp $377 | +1.0pp $339 |
UW: 25.0% down · 7.5% · 30yr · 1.5% tax · 5.0% vac · 8.0% maint · 8.0% mgmt
Financing live
Cash to close
- Down payment
- $36,250
- Closing costs
- $4,350
- Reserves months
- —
- Total cash needed
- —
Loan-product check · same deal, 3 products live
Conventional
25% down · 7.5% · 30yr
- Down + closing
- —
- Monthly P&I
- —
- Monthly cashflow
- —
- DSCR
- —
- Eligible?
- —
Personal DTI + credit; lowest rate.
DSCR
20% down · 8.5% · 30yr
- Down + closing
- —
- Monthly P&I
- —
- Monthly cashflow
- —
- DSCR
- —
- Eligible?
- —
No personal income docs; deal must DSCR.
Hard money
10% down · 12.0% · 12mo
- Down + closing
- —
- Monthly P&I
- —
- Monthly cashflow
- —
- DSCR
- —
- Eligible?
- —
Short-term bridge; refi at stabilization.
Rent comps 28 comps
| Address | Beds | Baths | Sqft | Rent | $/sqft | DOM | Units | Dist |
|---|---|---|---|---|---|---|---|---|
| 214 Ridgewood Dr Centerville, GA | 2.0 | 2.0 | 980 | $1,050 | $1.07 | 21d | 1 | 0.13mi |
| 105 Arnold St Centerville, GA | 2.0 | 1.5 | 1122 | $1,295 | $1.15 | 14d | 1 | 0.29mi |
| 431 Sentry Oak Dr Centerville, GA | 3.0 | 2.0 | 1312 | $1,695 | $1.29 | 44d | 1 | 0.31mi |
| 103 Abney Ct Centerville, GA | 3.0 | 2.0 | 1500 | $1,800 | $1.20 | 21d | 1 | 0.56mi |
| 111 Rainbow Ave Warner Robins, GA | 3.0 | 2.0 | 1422 | $1,695 | $1.19 | 21d | 1 | 0.58mi |
| 111 Rainbow Ave Warner Robins, GA | 3.0 | 2.0 | 1422 | $1,695 | $1.19 | 44d | 1 | 0.58mi |
| 114 Tahoe Ln Warner Robins, GA | 3.0 | 2.0 | 1349 | $1,800 | $1.33 | 44d | 1 | 0.59mi |
| 100 Robins West Pkwy Warner Robins, GA | 1.0–2.0 | 1.0–2.0 | 982 | $1,347 | $1.37 | 14d | 7 | 0.87mi |
| 108 Renoir Ln Warner Robins, GA | 3.0 | 2.0 | 1306 | $1,300 | $1.00 | 21d | 1 | 0.94mi |
| 108 Renoir Ln Warner Robins, GA | 3.0 | 2.0 | 1306 | $1,300 | $1.00 | 44d | 1 | 0.94mi |
| 117 Wingate Cir Warner Robins, GA | 2.0 | 1.5 | 1155 | $1,425 | $1.23 | 21d | 1 | 0.99mi |
| 108 Pershing Place Ct Warner Robins, GA | 2.0 | 2.0 | 1120 | $1,300 | $1.16 | 44d | 1 | 1.04mi |
| 208 Wray St Warner Robins, GA | 3.0 | 2.0 | 1509 | $1,700 | $1.13 | 14d | 1 | 1.19mi |
| 111 Hawthorne Rd Warner Robins, GA | 3.0 | 2.0 | 1551 | $1,500 | $0.97 | 44d | 1 | 1.25mi |
| 206 Antler Trl Warner Robins, GA | 2.0 | 2.0 | 1089 | $1,550 | $1.42 | 44d | 1 | 1.32mi |
| 256 Katelyn Cir Warner Robins, GA | 2.0 | 2.0 | 962 | $1,200 | $1.25 | 21d | 1 | 1.33mi |
| 256 Katelyn Cir Warner Robins, GA | 2.0 | 2.0 | 962 | $1,200 | $1.25 | 44d | 1 | 1.33mi |
| 242 Katelyn Cir Warner Robins, GA | 2.0 | 2.0 | 962 | $1,250 | $1.30 | 21d | 1 | 1.34mi |
| 242 Katelyn Cir Warner Robins, GA | 2.0 | 2.0 | 962 | $1,250 | $1.30 | 44d | 1 | 1.34mi |
| 800 Gunn Rd Centerville, GA | 1.0–3.0 | 1.0–2.0 | 1100 | $1,715 | $1.56 | 14d | 2 | 1.34mi |
| 224 Katelyn Cir Warner Robins, GA | 2.0 | 2.0 | 962 | $1,200 | $1.25 | 14d | 1 | 1.37mi |
| 321 Deerfield Cir Warner Robins, GA | 2.0 | 2.0 | 1326 | $1,650 | $1.24 | 14d | 1 | 1.37mi |
| 126 Jaybee Dr Warner Robins, GA | 3.0 | 2.0 | 1378 | $1,750 | $1.27 | 44d | 1 | 1.38mi |
| 501 Pinecrest Dr Warner Robins, GA | 4.0 | 2.0 | 1818 | $2,100 | $1.16 | 44d | 1 | 1.38mi |
| 107 White Tail Ln Warner Robins, GA | 2.0 | 2.0 | 1065 | $1,650 | $1.55 | 44d | 1 | 1.39mi |
| 213 Webb St Warner Robins, GA | 3.0 | 2.0 | 1152 | $1,600 | $1.39 | 21d | 1 | 1.42mi |
| 1601 Leverette Rd Warner Robins, GA | 2.0 | 2.0 | 1170 | $1,474 | $1.26 | 14d | 15 | 1.43mi |
| 210 Surrey Dr Warner Robins, GA | 3.0 | 2.0 | 1620 | $1,600 | $0.99 | 21d | 1 | 1.45mi |
Listing history 18 events
-
2026-06-19days on market $145,000 Active 37 DOM
-
2026-06-18days on market $145,000 Active 36 DOM
-
2026-06-17days on market $145,000 Active 35 DOM
-
2026-06-16days on market $145,000 Active 34 DOM
-
2026-06-15days on market $145,000 Active 33 DOM
-
2026-06-14days on market $145,000 Active 31 DOM
-
2026-06-13days on market $145,000 Active 30 DOM
-
2026-06-10days on market $145,000 Active 28 DOM
-
2026-06-09days on market $145,000 Active 27 DOM
-
2026-06-08days on market $145,000 Active 26 DOM
-
2026-06-07days on market $145,000 Active 25 DOM
-
2026-06-05days on market $145,000 Active 22 DOM
-
2026-06-03days on market $145,000 Active 21 DOM
-
2026-06-02days on market $145,000 Active 20 DOM
-
2026-06-01days on market $145,000 Active 19 DOM
-
2026-05-31days on market $145,000 Active 18 DOM
-
2026-05-30days on market $145,000 Active 17 DOM
-
2026-05-07$145,000 New 302-char remark
ⓘ Source: listings_history table (triggers on properties + properties_extension) + one-shot
backfill from property_details.listing_events for pre-trigger history.
Tax reassessment forecast GA · Resets to sale price
- Current annual tax
- $1,158 · $96/mo
- Projected year-2 tax
- $1,334 · $111/mo
- Expected delta
- +$176/yr (+$15/mo · 15.2%)
ⓘ Screening estimate from a state-policy table — verify with the county assessor before closing.
Climate risk First Street
- Flood 1/10 Low FEMA zone X (unshaded) · 0% chance over 30 yrs
- Wildfire 3/10 Moderate
- Heat 7/10 Severe 7 d/yr ≥108°F today · 18 d/yr by 30 yrs out
- Wind 6/10 Major 73% chance of damaging wind over 30 yrs
- Air quality 3/10 Moderate 2 unhealthy d/yr today · 3 by 30 yrs out
Nearby sold comps map
Loading sold comps map…
Walkable amenities ~0.75 mi
Loading nearby amenities…
Taxation est. · year 1
- Rental income
- $20,235
- − Mortgage interest
- −$8,122
- − Property taxes
- −$1,158
- − Insurance
- −$725
- − Repairs & maintenance
- −$1,619
- − Management
- −$1,619
- − Depreciation
- −$4,218
- Taxable income
- $2,774
- Est. tax owed @ 24.0%
- −$666
- After-tax cash flow
- $4,312/yr
For passive investors: Depreciation is non-cash, so a rental often shows a tax loss while cash-flowing — sheltering income. Rental losses are passive: they offset passive income freely, and up to $25,000/yr can offset ordinary (W-2) income if you actively participate and your MAGI is under $100k (phasing out to $0 by $150k); unused losses carry forward. On sale, claimed depreciation is recaptured at up to 25%, and gains may owe capital-gains tax (a 1031 exchange can defer both). Figures are a year-1 estimate at your 24.0% rate — not tax advice; consult a CPA.
Schools (NCES district)
- District
- Houston County
- NCES district ID
- 1302880
- Math proficiency
- 43% ▼ -7.00%
- Reading proficiency
- 46% ▼ -2.00%
- Median HH income
- $54,823
- Composite
- 38.68/100
- National rank
- #4144
- State rank
- #23 of 174 in GA
Livability — Centerville
- Score
- 73/100
- State rank
- #56
- US rank
- #5374
Category grades
Schools grade is shown separately in the Schools card above.
Census & demographics
- Census place
- Centerville, GA
- County
- Houston County · 157,321 people
- City population
- 6,312
- Metro
- Warner Robins, GA
- Population (ZIP)
- 6,645
- Household income
- $76,342
- Rent vs Own
- Severe rent burden
- 216.0
Population outlook (Houston County) Hauer SSP2
- Today (2025)
- 169,502 people
- By 2030
- 178,486 · +5.3%
- By 2040
- 194,642 · +14.8%
- By 2050
- 207,119 · +22.2%
- By 2075
- 231,480 · +36.6%
- By 2100
- 235,034 · +38.7%
Race, ethnicity, and origin ACS 2023
- Neighborhood character
- Diverse neighborhood (Simpson 0.63)
- Race & ethnicity
- Black 45% White 41% Asian 6% Two or more races 6% Hispanic / Latino 3%
- Common ancestry
- Armenian 3% Italian 3% Slovak 2%
- Foreign-born
- 8% · Canada, South Korea, Vietnam
- Languages at home
- 87% English-only · Arabic 3% Other Indo-European 3% Spanish 2%
Political lean MEDSL · Houston
- 2024 margin
- R (+11.3) · D 44.0% · R 55.3%
- 2008→2024 swing
- +8.9pp toward D · 2008: -20.2pp · 2024: -11.3pp
- All cycles
- 2024: R+11.3 2020: R+12.4 2016: R+21.6 2012: R+20.7 2008: R+20.2
Not yet ingested
- Civics
- —
Market trends
- HPI YoY
- ▼ -59.75%
- Current HPI
- 215.7835
- Rent YoY
- —
- Metro
- Warner Robins, GA
- State GDP YoY
- ▲ 2.66%
- F500 in state
- 28
Industry mix (Fortune 500 HQ in GA)
| Industry | F500 HQs | Revenue |
|---|---|---|
| Paper / Packaging | 2 | $29B |
|
||
| Retail | 1 | $160B |
|
||
| Transportation / Logistics | 1 | $91B |
|
||
| Airlines | 1 | $62B |
|
||
| Consumer Goods | 1 | $47B |
|
||
| Utilities | 1 | $25B |
|
||
Price history
1 event — show timeline
- 2026-05-07 Listed $145,000 GAMLS
Property tax history
+8.3%/yrLatest (2025): $1,158 · +35.0% YoY. Source: county tax records.
Cash-flow waterfall
monthlySold comps — $/sqft
last 12 mo · ≤1 miLoading sold comps…