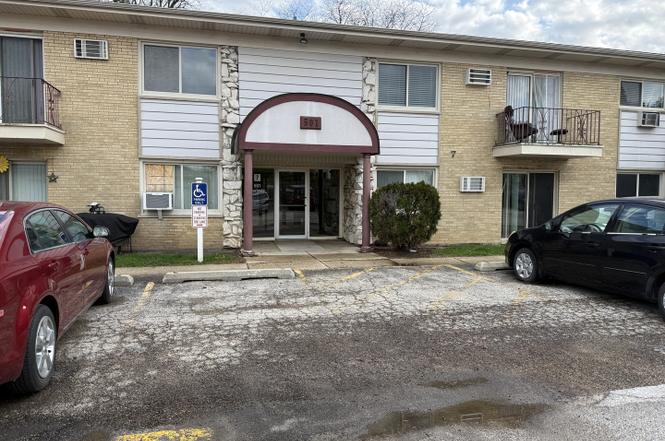
501 Carlysle Dr #7 · Clarendon Hills, IL
Flood risk 1/10 · Minimal
- FEMA flood zone
- X (unshaded)
- Chance of flooding over 30 yrs
- 0.0%
- Est. flood insurance / yr
- $507 – $1,088
Fire risk 1/10 · Minimal
- Est. fire insurance / yr
- $804 – $1,492
Heat risk 3/10 · Minor
- Hot days now (above 103°F)
- 7 days/yr
- Hot days in 30 yrs
- 14 days/yr
Wind risk 2/10 · Minimal
- Chance of severe wind over 30 yrs
- —
Air-quality risk 4/10 · Minor
- Unhealthy air days now
- 4 days/yr
- Unhealthy air days in 30 yrs
- 6 days/yr
Risk factors via First Street. Map © Google.
Why this score? — see what drove the D grade
The composite is a weighted blend of 9 inputs, each scored 0–100. Each bar is that input's sub-score; the figure is the points it added to the 100-point composite (weight × sub-score).
- Cash flow +12.0/30.0
- ARV discount +7.5/15.0
- 1% rule +6.2/10.0
- Schools +6.0/10.0
- Livability +4.2/5.0
- DSCR +3.5/10.0
- Rent growth +2.5/5.0
- Condition / age +2.5/5.0
- Appreciation +0.0/10.0
$164,500
🖨 Deal sheet (PDF) 📄 Offer letter ✓ Due diligence
Listing remarks
Welcome to 501 Carlysle Drive, Unit 7, a first-floor condo oasis nestled in the charming village of Clarendon Hills. This newly updated one-bedroom, one-bathroom residence offers a harmonious blend of comfort and style, designed to delight the senses and provide the ultimate in convenience and luxury. As you step through the front door, you are greeted by the warm embrace of luxury vinyl wood-look flooring that sweeps throughout the entire space, offering the beauty of hardwood with the durability to match your lifestyle. The open-concept living area is bathed in natural light, creating an inviting atmosphere that beckons you to unwind or entertain with ease. The heart of the home, the kitc
Key facts
- $426 HOA
- Garage
- Built 1966
Property features AI
Finance
- Other: Property is not currently leased; Parcel and additional parcel identifiers on record
- Financial info: Special service area: No; Tax exemptions: Homeowner
- HOA & community: Monthly association fee of $426; Association fee covers heat, water, parking, insurance, exterior maintenance, lawn care, scavenger, and snow removal; Association amenities include coin laundry and storage; Pets allowed (cats and dogs), maximum pet weight 45 lbs; Manager off-site
Exterior
- Parking: Detached garage (garage owned) with garage door opener; Asphalt parking; One garage/parking space
- Security: Manager off-site (on-site management not provided)
- Utilities: Water source: Lake Michigan; Public sewer; Electric with circuit breakers
- Home design: Attached single condo; Entry on level 1; Condo ownership; Rehab completed in 2026; Approximate total finished area 970
- Construction: Brick construction; Asphalt roof; Concrete perimeter foundation; Building age approximately 51–60 years; Built before 1978
- Exterior features: Patio; Common grounds
Interior
- Kitchen: Galley kitchen; Range; Microwave; Dishwasher; Refrigerator; Kitchen windows with blinds; Luxury vinyl flooring in kitchen
- Bedrooms: Master bedroom on main level; Additional bedrooms (2 listed)
- Flooring: Luxury vinyl flooring in living room, kitchen, and master bedroom
- Bathrooms: One full bathroom
- Heating & cooling: Baseboard heating; Window air conditioning unit(s)
- Interior features: Three total rooms; Non-smoking building
- Laundry & utility: Common area laundry
Neighborhood map
What this means for you Summary
Snapshot
- This is a 1-bed/1.0-bath condo listed at $164k.
Deal economics
- At list price, monthly cash flow is $-39 ($-469/yr) — negative.
- To cash-flow at today's rent, offer at most $158k (4.2% below list).
- Meets the 1% rule at list price ($2k rent vs $164k).
- Recommended offer: $145k (12.0% below list) — sets the bar for market timing.
- Cap rate 6.0% vs local median 0.7% in Clarendon Hills — top-decile yield for the area; either an underpriced asset or a hidden risk that comps aren't pricing in. Stress-test before assuming the spread holds.
Location & tenants
- Location reads 83/100 on livability (#48 in IL, #978 nationally) — a professional / high-income tenant draw. Strengths: crime A+, commute A+, employment A+; Watch: health & safety C-, amenities F, cost of living F.
- Hinsdale Twp Hsd 86 (suburban): math 62% / reading 64% proficiency, ranked #17 of 620 in IL (top 3%) — acceptable for families but not a draw, mixed tenant base, ~2y average lease.
- Zoned schools: Holmes Elem School (503 students, 0% FRL); Westview Hills Middle School (math 47% / reading 50%, grade C-, #63 of 665 statewide, top 9%, 444 students, 0% FRL); Hinsdale Central High School (math 71% / reading 72%, grade B+, #8 of 693 statewide, top 1%, 2,472 students, 0% FRL).
- Market conditions: 27 active listings in the ZIP; 4 comparable units currently listed for rent nearby; rentals at typical pace (median 27d on market — plan ~3-4 weeks tenant-placement turnaround); high-income renter base; 1,378 units permitted in DuPage County in 2024 (594 in 5+ unit buildings).
Forward outlook
- Local home prices are declining (-3.0%/yr); year-one equity from $1k of loan paydown is wiped out by about $5k of value loss. Plan a longer hold.
Negotiation context
- It's been on market 145 days — a 12% lower offer ($145k) is reasonable based on typical stale-listing flexibility.
- 4 sale attempts since 16y ago with the ask held roughly flat each time — persistent listings suggest the price (not the market) is what's stuck; bring a comps-based counter.
- Current owner paid $70k; list at $164k implies a 137% gain — meaningful room to come down on a strong offer.
Risks & watch-outs
- Watch-outs: HOA is 23% of rent.
Questions for the listing agent
- What do current leases actually rent for vs. the listed asking? Can we see a recent rent roll and the last 12 months of T-12 income?
- It's been on market 145 days. Have you received any prior offers? Is the seller open to a 12% concession, seller financing, or rate buy-down credit?
- Built in 1966 — when were the roof, HVAC, electrical panel, plumbing, and water heater last replaced?
- What does the HOA fee cover, when was the last increase, and are there any pending special assessments or reserve-fund shortfalls?
- Any open or pending special assessments — roof, HVAC, plumbing, elevator, façade? What's the per-unit balance and payoff schedule, and is the seller paying it off at close or rolling it to the buyer?
- Why hasn't it sold? Are there any deal-killer items the seller is aware of (foundation, flood, title, zoning, code violations)?
- Is there a deadline driving the sale (1031 exchange, divorce, estate, relocation)? That informs how much negotiation room exists.
- Schools are A-rated — typically a magnet for longer-tenancy family renters. What's the average tenant stay here, and is there a school-zone premium baked into asking?
- The area grade is low — what's the realistic commute time and amenity access for the typical tenant pool here? Any planned neighborhood developments (good or bad) we should know about?
- What's the average days-on-market for RENTAL listings here right now (not sales)? A rising rental-DOM trend means longer vacancies and softer asking-rent achievability than the comps imply.
- What's the recent tenant-quality profile in this submarket — average credit score on applications, eviction rate, late-payment / NSF rate, and stable-employment percentage? A property-management company in the area should have these aggregated.
- How much new apartment / multifamily construction is in the pipeline within 1–3 miles? Heavy new supply (>2% of stock underway) typically softens rents 12–24 months out; light construction supports rent growth.
Investment metrics
- 1% rule
- 1.12% ✓
- Cap rate
- 6.01%
- Cash-on-cash
- -1.02%
- DSCR
- 0.95
- GRM
- 7.5
CMA / ARV
No comps found within radius.
Projected returns pro-forma
-3.0% appreciation · 3.0% rent growth · sell at horizon
- IRR
- -17.8%
- Equity multiple
- 0.37×
- Total profit
- $-28,902
- Equity at exit
- $24,527
- IRR
- -9.6%
- Equity multiple
- 0.41×
- Total profit
- $-27,384
- Equity at exit
- $14,223
Cash invested: $46,060 (down + closing). Projections, not guarantees.
Landlord ↔ Tenant lean methodology
- Overall (STATE)
- 43 Moderately Tenant-Leaning
- State Illinois
- 43 Moderately Tenant-Leaning · D+7
- County
- — inherits STATE
- City
- — inherits STATE
ZIP-level market 60514
- Active inventory
- 27
- Price-to-rent
- 7.5×
Monthly cashflow live
- Estimated rent
- $1,834 medium interval (Pro) →
- Mortgage (P&I)
- −$863
- Tax from tax record
- −$131 /mo · $1,573/yr
- Insurance
- −$69
- HOA
- −$426
- Vacancy / Maint / Mgmt
- −$385
- Net cashflow
- $-39
Break-even live
Sensitivity live
| Price | -10% $54 | -5% $7 | +0% $-39 | +5% $-86 | +10% $-132 |
|---|---|---|---|---|---|
| Rent | -10% $-184 | -5% $-112 | +0% $-39 | +5% $33 | +10% $106 |
| Rate | -1.0pp $44 | -0.5pp $3 | base $-39 | +0.5pp $-82 | +1.0pp $-125 |
UW: 25.0% down · 7.5% · 30yr · 1.5% tax · 5.0% vac · 8.0% maint · 8.0% mgmt
Financing live
Cash to close
- Down payment
- $41,125
- Closing costs
- $4,935
- Reserves months
- —
- Total cash needed
- —
Loan-product check · same deal, 3 products live
Conventional
25% down · 7.5% · 30yr
- Down + closing
- —
- Monthly P&I
- —
- Monthly cashflow
- —
- DSCR
- —
- Eligible?
- —
Personal DTI + credit; lowest rate.
DSCR
20% down · 8.5% · 30yr
- Down + closing
- —
- Monthly P&I
- —
- Monthly cashflow
- —
- DSCR
- —
- Eligible?
- —
No personal income docs; deal must DSCR.
Hard money
10% down · 12.0% · 12mo
- Down + closing
- —
- Monthly P&I
- —
- Monthly cashflow
- —
- DSCR
- —
- Eligible?
- —
Short-term bridge; refi at stabilization.
Rent comps 4 comps
| Address | Beds | Baths | Sqft | Rent | $/sqft | DOM | Units | Dist |
|---|---|---|---|---|---|---|---|---|
| 21 58th St Clarendon Hills, IL | 1.0–2.0 | 1.0–2.0 | 900 | $1,755 | $1.95 | 0d | 2 | 0.15mi |
| 6060 Laurel Ln Willowbrook, IL | 1.0–2.0 | 1.0–2.0 | 820 | $1,649 | $2.01 | 0d | 61 | 0.38mi |
| 143 Ann St Unit 3N Clarendon Hills, IL | 2.0 | 1.0 | 750 | $2,800 | $3.73 | 26d | 1 | 0.83mi |
| 143 Ann St Unit 1S Clarendon Hills, IL | 1.0 | 1.0 | 542 | $2,270 | $4.19 | 26d | 1 | 0.83mi |
HOA detail condo
- Monthly dues
- $426 · $5,112/yr
- Assessments
- None detected in remarks — confirm with the listing agent.
Listing history 27 events
-
2026-06-21days on market $164,500 Active 145 DOM
-
2026-06-18days on market $164,500 Active 142 DOM
-
2026-06-17days on market $164,500 Active 141 DOM
-
2026-06-16days on market $164,500 Active 140 DOM
-
2026-06-15days on market $164,500 Active 139 DOM
-
2026-06-13days on market $164,500 Active 137 DOM
-
2026-06-13days on market $164,500 Active 136 DOM
-
2026-06-09days on market $164,500 Active 133 DOM
-
2026-06-08days on market $164,500 Active 132 DOM
-
2026-06-07days on market $164,500 Active 131 DOM
-
2026-06-04days on market $164,500 Active 128 DOM
-
2026-06-03days on market $164,500 Active 127 DOM
-
2026-06-02days on market $164,500 Active 126 DOM
-
2026-06-01days on market $164,500 Active 125 DOM
-
2026-05-31days on market $164,500 Active 124 DOM
-
2026-05-22status Active
-
2026-04-26historical Contingent - Continue to Show
-
2026-03-05price $164,500
-
2026-01-28$168,000 Active
-
2017-06-27soldstatus $69,500
-
2012-09-01historical
-
2011-06-10price Price Change
-
2011-05-05New
-
2011-05-05historical
-
2011-01-19price Price Change
-
2010-11-18price Price Change
-
2010-08-05New
ⓘ Source: listings_history table (triggers on properties + properties_extension) + one-shot
backfill from property_details.listing_events for pre-trigger history.
Tax reassessment forecast IL · Partial reset (capped growth)
- Current annual tax
- $1,573 · $131/mo
- Projected year-2 tax
- $2,654 · $221/mo
- Expected delta
- +$1,081/yr (+$90/mo · 68.7%)
ⓘ Screening estimate from a state-policy table — verify with the county assessor before closing.
Climate risk First Street
- Flood 1/10 Low FEMA zone X (unshaded) · 0% chance over 30 yrs
- Wildfire 1/10 Low
- Heat 3/10 Moderate 7 d/yr ≥103°F today · 14 d/yr by 30 yrs out
- Wind 2/10 Low
- Air quality 4/10 Moderate 4 unhealthy d/yr today · 6 by 30 yrs out
Nearby sold comps map
Loading sold comps map…
Walkable amenities ~0.75 mi
Loading nearby amenities…
Taxation est. · year 1
- Rental income
- $22,013
- − Mortgage interest
- −$9,215
- − Property taxes
- −$1,573
- − Insurance
- −$822
- − Repairs & maintenance
- −$1,761
- − Management
- −$1,761
- − HOA
- −$5,112
- − Depreciation
- −$4,785
- Taxable loss
- −$3,017
- Est. tax savings @ 24.0%
- +$724
- After-tax cash flow
- $255/yr
For passive investors: Depreciation is non-cash, so a rental often shows a tax loss while cash-flowing — sheltering income. Rental losses are passive: they offset passive income freely, and up to $25,000/yr can offset ordinary (W-2) income if you actively participate and your MAGI is under $100k (phasing out to $0 by $150k); unused losses carry forward. On sale, claimed depreciation is recaptured at up to 25%, and gains may owe capital-gains tax (a 1031 exchange can defer both). Figures are a year-1 estimate at your 24.0% rate — not tax advice; consult a CPA.
Schools (NCES district)
- District
- Hinsdale Twp Hsd 86
- NCES district ID
- 1719320
- Math proficiency
- 62% ▼ -5.00%
- Reading proficiency
- 64% ▬ 0.00%
- Median HH income
- $118,692
- Composite
- 60.13/100
- National rank
- #868
- State rank
- #17 of 620 in IL
Livability — Clarendon Hills
- Score
- 83/100
- State rank
- #48
- US rank
- #978
Category grades
Schools grade is shown separately in the Schools card above.
Census & demographics
- Census place
- Clarendon Hills, IL
- County
- DuPage County · 904,569 people
- City population
- 9,918
- Metro
- Chicago-Naperville-Elgin, IL-IN-WI
- Population (ZIP)
- 9,918
- Household income
- $118,716
- Rent vs Own
- Severe rent burden
- 248.0
Population outlook (DuPage County) Hauer SSP2
- Today (2025)
- 960,187 people
- By 2030
- 965,850 · +0.6%
- By 2040
- 965,812 · +0.6%
- By 2050
- 954,890 · -0.6%
- By 2075
- 910,185 · -5.2%
- By 2100
- 816,255 · -15.0%
Race, ethnicity, and origin ACS 2023
- Neighborhood character
- Predominantly White (81%)
- Race & ethnicity
- White 81% Asian 12% Two or more races 5% Hispanic / Latino 3%
- Common ancestry
- Romanian 8% Italian 4% Slovak 3%
- Foreign-born
- 13% · China, Canada
- Languages at home
- 83% English-only · Other Indo-European 9% Russian/Polish/Slavic 2% Spanish 2%
Political lean MEDSL · DuPage
- 2024 margin
- D (+13.3) · D 55.9% · R 42.5% · Other 1.6%
- 2008→2024 swing
- +2.5pp toward D · 2008: 10.8pp · 2024: 13.3pp
- All cycles
- 2024: D+13.3 2020: D+18.1 2016: D+14.1 2012: D+1.0 2008: D+10.8
Not yet ingested
- Civics
- —
Market trends
- HPI YoY
- ▼ -330.36%
- Current HPI
- 207.7712
- Rent YoY
- —
- Metro
- Chicago-Naperville-Elgin, IL-IN-WI
- State GDP YoY
- ▲ 1.59%
- F500 in state
- 60
Industry mix (Fortune 500 HQ in IL)
| Industry | F500 HQs | Revenue |
|---|---|---|
| Insurance | 4 | $201B |
|
||
| Consumer Goods | 4 | $87B |
|
||
| Industrial Machinery | 3 | $64B |
|
||
| Healthcare | 2 | $55B |
|
||
| Retail / Pharmacy | 1 | $148B |
|
||
| Agriculture / Food | 1 | $86B |
|
||
Price history
+136.7% since first listed12 events — show timeline
- 2026-05-22 Relisted — MRED as Distributed by MLS Grid
- 2026-04-26 Contingent — MRED as Distributed by MLS Grid
- 2026-03-05 Price Changed $164,500 MRED as Distributed by MLS Grid
- 2026-01-28 Listed $168,000 MRED as Distributed by MLS Grid
- 2017-06-27 Sold (Public Records) $69,500 Public Records
- 2012-09-01 Listing Removed — MRED as Distributed by MLS Grid
- 2011-06-10 Price Changed — MRED as Distributed by MLS Grid
- 2011-05-05 Listed — MRED as Distributed by MLS Grid
- 2011-05-05 Listing Removed — MRED as Distributed by MLS Grid
- 2011-01-19 Price Changed — MRED as Distributed by MLS Grid
- 2010-11-18 Price Changed — MRED as Distributed by MLS Grid
- 2010-08-05 Listed — MRED as Distributed by MLS Grid
Property tax history
-0.8%/yrLatest (2024): $1,573 · +8.6% YoY. Source: county tax records.
Cash-flow waterfall
monthlySold comps — $/sqft
last 12 mo · ≤1 miLoading sold comps…