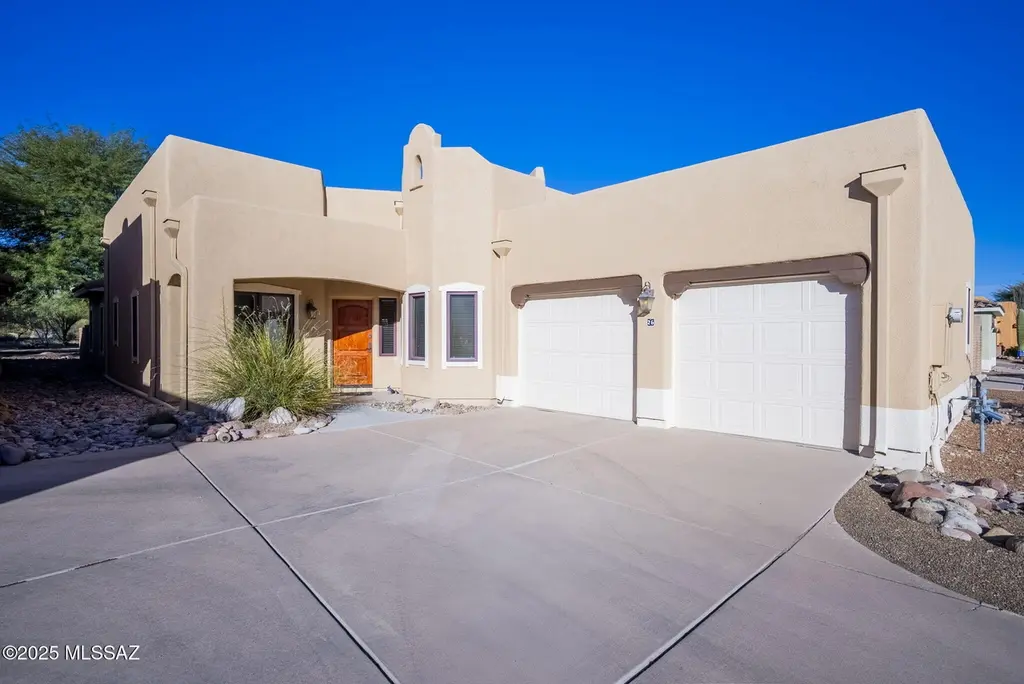
26 Circulo Diego Rivera · Tubac, AZ
Flood risk 3/10 · Minor
- FEMA flood zone
- X (unshaded)
- Chance of flooding over 30 yrs
- 0.2%
- Est. flood insurance / yr
- $507 – $1,088
Fire risk 7/10 · Major
- Est. fire insurance / yr
- $610 – $1,132
Heat risk 7/10 · Major
- Hot days now (above 101°F)
- 7 days/yr
- Hot days in 30 yrs
- 19 days/yr
Wind risk 1/10 · Minimal
- Chance of severe wind over 30 yrs
- —
Air-quality risk 1/10 · Minimal
- Unhealthy air days now
- 0 days/yr
- Unhealthy air days in 30 yrs
- 0 days/yr
Risk factors via First Street. Map © Google.
Why this score? — see what drove the B- grade
The composite is a weighted blend of 9 inputs, each scored 0–100. Each bar is that input's sub-score; the figure is the points it added to the 100-point composite (weight × sub-score).
- Cash flow +22.3/30.0
- ARV discount +15.0/15.0
- DSCR +7.1/10.0
- 1% rule +5.9/10.0
- Appreciation +4.9/10.0
- Livability +3.4/5.0
- Rent growth +2.5/5.0
- Condition / age +2.5/5.0
- Schools +1.7/10.0
$357,000
🖨 Deal sheet 📄 Offer letter ✓ Due diligence
Listing remarks MLS
This well-maintained 3-bedroom, 2-bathroom home is located in a desirable neighborhood, offering both privacy and convenience. Situated just a short distance from the scenic Juan Bautista Anza Trail. This charming residence features a cozy backyard with and an additional side courtyard, perfect for outdoor fun. Its prime location provides easy access to the Anza Park and dog park and is close to town for shopping, dining, and entertainment. Move-in ready!
Key facts
- Dog park
- Anza park
- Side courtyard
Tags
Neighborhood map
What this means for you Summary
Snapshot
- This is a 3-bed/2.0-bath condo listed at $357k.
Deal economics
- At list price, monthly cash flow is $589 ($7k/yr) — positive.
- The deal already cash-flows at list — no discount required.
- Meets the 1% rule at list price ($4k rent vs $357k).
- Recommended offer: $325k (9.0% below list) — sets the bar for market timing.
- Cap rate 8.3% vs local median 3.5% in Tubac — top-decile yield for the area; either an underpriced asset or a hidden risk that comps aren't pricing in. Stress-test before assuming the spread holds.
Location & tenants
- Location reads 67/100 on livability (#60 in AZ) — a middle-class / working-renter tenant base. Strengths: crime A+, employment A, housing A; Watch: schools C-, health & safety C-, amenities F.
- Santa Cruz Valley Unified District (4458) (town): math 12% / reading 26% proficiency, ranked #184 of 249 in AZ (top 74%) — low school quality limits family demand, transient renter base, plan for 1-2y turnover; 62% free/reduced lunch — lower-income household profile, screen leases tightly.
- Market conditions: 155 active listings in the ZIP; 340 units permitted in Santa Cruz County in 2024 (0 in 5+ unit buildings).
Forward outlook
- In year one you build about $2k of equity ($2k loan paydown + $-507 appreciation (-0.1% local appreciation)).
- Santa Cruz County population projected at -22% by 2050 — secular population decline; favor cash flow + early exit over multi-decade hold.
- At projected returns (-0.1% appreciation + 3.0% rent growth), your $100k cash investment doubles in ~8 years — after that, you're playing with house money.
- By year 10, paydown + projected appreciation supports a ~$32k cash-out refi (75% LTV) — recoverable capital for the next deal without selling this one.
Negotiation context
- It's been on market 102 days — a 9% lower offer ($325k) is reasonable based on typical stale-listing flexibility.
- 8 sale attempts since 19y ago with the ask held roughly flat each time — persistent listings suggest the price (not the market) is what's stuck; bring a comps-based counter.
- Current owner paid $157k; list at $357k implies a 127% gain — meaningful room to come down on a strong offer.
Risks & watch-outs
- Climate carrying-cost: major wildfire risk; extreme-heat days projected 7→19/yr by 2055 (HVAC capex compounding) — expect insurance premiums to compound above CPI over the hold.
Questions for the listing agent
- It's been on market 102 days. Have you received any prior offers? Is the seller open to a 9% concession, seller financing, or rate buy-down credit?
- What does the HOA fee cover, when was the last increase, and are there any pending special assessments or reserve-fund shortfalls?
- Any open or pending special assessments — roof, HVAC, plumbing, elevator, façade? What's the per-unit balance and payoff schedule, and is the seller paying it off at close or rolling it to the buyer?
- Why hasn't it sold? Are there any deal-killer items the seller is aware of (foundation, flood, title, zoning, code violations)?
- Is there a deadline driving the sale (1031 exchange, divorce, estate, relocation)? That informs how much negotiation room exists.
- What's the average days-on-market for RENTAL listings here right now (not sales)? A rising rental-DOM trend means longer vacancies and softer asking-rent achievability than the comps imply.
- What's the recent tenant-quality profile in this submarket — average credit score on applications, eviction rate, late-payment / NSF rate, and stable-employment percentage? A property-management company in the area should have these aggregated.
- How much new apartment / multifamily construction is in the pipeline within 1–3 miles? Heavy new supply (>2% of stock underway) typically softens rents 12–24 months out; light construction supports rent growth.
Investment metrics
- 1% rule
- 1.09% ✓
- Cap rate
- 8.27%
- Cash-on-cash
- 7.08%
- DSCR
- 1.31
- GRM
- 7.6
CMA / ARV
- ARV (median comp)
- $458,422
- List price
- $357,000
- Delta
- -22.12%
- Verdict
- UNDERPRICED
- Comps
- 20 within 1.0 mi
Projected returns pro-forma
-0.14% appreciation · 3.0% rent growth · sell at horizon
- IRR
- 5.3%
- Equity multiple
- 1.25×
- Total profit
- $24,796
- Equity at exit
- $101,136
- IRR
- 10.6%
- Equity multiple
- 2.14×
- Total profit
- $114,398
- Equity at exit
- $119,573
Cash invested: $99,960 (down + closing). Projections, not guarantees.
Landlord ↔ Tenant lean methodology
- Overall (STATE)
- 87 Strongly Landlord-Friendly
- State Arizona
- 87 Strongly Landlord-Friendly · R+3
- County
- — inherits STATE
- City
- — inherits STATE
ZIP-level market 85646
- Home prices YoY
- -0.1%
- Active inventory
- 155
- Price-to-rent
- 7.6×
Monthly cashflow live
- Estimated rent
- $3,897 medium interval (Pro) →
- Mortgage (P&I)
- −$1,872
- Tax from tax record
- −$233 /mo · $2,801/yr
- Insurance
- −$149
- HOA
- −$235
- Vacancy / Maint / Mgmt
- −$818
- Net cashflow
- $589
Break-even live
UW: 25.0% down · 7.5% · 30yr · 1.5% tax · 5.0% vac · 8.0% maint · 8.0% mgmt
Financing live
Cash to close
- Down payment
- $89,250
- Closing costs
- $10,710
- Reserves months
- —
- Total cash needed
- —
Loan-product check · same deal, 3 products live
Conventional
25% down · 7.5% · 30yr
- Down + closing
- —
- Monthly P&I
- —
- Monthly cashflow
- —
- DSCR
- —
- Eligible?
- —
Personal DTI + credit; lowest rate.
DSCR
20% down · 8.5% · 30yr
- Down + closing
- —
- Monthly P&I
- —
- Monthly cashflow
- —
- DSCR
- —
- Eligible?
- —
No personal income docs; deal must DSCR.
Hard money
10% down · 12.0% · 12mo
- Down + closing
- —
- Monthly P&I
- —
- Monthly cashflow
- —
- DSCR
- —
- Eligible?
- —
Short-term bridge; refi at stabilization.
HOA detail condo
- Monthly dues
- $235 · $2,820/yr
- Assessments
- None detected in remarks — confirm with the listing agent.
Listing history 32 events
-
2026-06-18days on market $357,000 Active 102 DOM
-
2026-06-17days on market $357,000 Active 101 DOM
-
2026-06-16days on market $357,000 Active 100 DOM
-
2026-06-15days on market $357,000 Active 99 DOM
-
2026-06-13days on market $357,000 Active 97 DOM
-
2026-06-10days on market $357,000 Active 94 DOM
-
2026-06-09days on market $357,000 Active 93 DOM
-
2026-06-08days on market $357,000 Active 92 DOM
-
2026-06-07days on market $357,000 Active 91 DOM
-
2026-06-05days on market $357,000 Active 88 DOM
-
2026-06-03days on market $357,000 Active 87 DOM
-
2026-06-02days on market $357,000 Active 86 DOM
-
2026-06-01days on market $357,000 Active 85 DOM
-
2026-05-31days on market $357,000 Active 84 DOM
-
2026-03-02$357,000 Active 459-char remark
Show marketing remark (459 chars)
This well-maintained 3-bedroom, 2-bathroom home is located in a desirable neighborhood, offering both privacy and convenience. Situated just a short distance from the scenic Juan Bautista Anza Trail. This charming residence features a cozy backyard with and an additional side courtyard, perfect for outdoor fun. Its prime location provides easy access to the Anza Park and dog park and is close to town for shopping, dining, and entertainment. Move-in ready!
-
2025-05-07historical
-
2025-03-28price $379,000
-
2025-02-26price $385,000
-
2025-01-02$392,000 Active
-
2012-09-14soldstatus $157,000
-
2012-09-14soldstatus $157,000
-
2011-12-12$160,000
-
2011-12-12$160,000
-
2011-06-03historical
-
2011-06-03historical
-
2011-06-03historical
-
2010-07-08$225,000
-
2010-07-08$225,000
-
2010-07-08$225,000
-
2008-06-30historical
-
2007-01-11$319,000
-
1999-10-20soldstatus $187,195
ⓘ Source: listings_history table (triggers on properties + properties_extension) + one-shot
backfill from property_details.listing_events for pre-trigger history.
Tax reassessment forecast AZ · Resets to sale price
- Current annual tax
- $2,801 · $233/mo
- Projected year-2 tax
- $2,801 · $233/mo
- Expected delta
- $0/yr ($0/mo · 0.0%)
ⓘ Screening estimate from a state-policy table — verify with the county assessor before closing.
Climate risk First Street
- Flood 3/10 Moderate FEMA zone X (unshaded) · 20% chance over 30 yrs
- Wildfire 7/10 Severe
- Heat 7/10 Severe 7 d/yr ≥101°F today · 19 d/yr by 30 yrs out
- Wind 1/10 Low
- Air quality 1/10 Low 0 unhealthy d/yr today · 0 by 30 yrs out
Nearby sold comps map
Loading sold comps map…
Walkable amenities ~0.75 mi
Loading nearby amenities…
Taxation est. · year 1
- Rental income
- $46,766
- − Mortgage interest
- −$19,998
- − Property taxes
- −$2,801
- − Insurance
- −$1,785
- − Repairs & maintenance
- −$3,741
- − Management
- −$3,741
- − HOA
- −$2,820
- − Depreciation
- −$10,385
- Taxable income
- $1,494
- Est. tax owed @ 24.0%
- −$359
- After-tax cash flow
- $6,715/yr
For passive investors: Depreciation is non-cash, so a rental often shows a tax loss while cash-flowing — sheltering income. Rental losses are passive: they offset passive income freely, and up to $25,000/yr can offset ordinary (W-2) income if you actively participate and your MAGI is under $100k (phasing out to $0 by $150k); unused losses carry forward. On sale, claimed depreciation is recaptured at up to 25%, and gains may owe capital-gains tax (a 1031 exchange can defer both). Figures are a year-1 estimate at your 24.0% rate — not tax advice; consult a CPA.
Schools (NCES district)
- District
- Santa Cruz Valley Unified District (4458)
- NCES district ID
- 0407520
- Math proficiency
- 12% ▼ -19.00%
- Reading proficiency
- 26% ▼ -9.00%
- Median HH income
- $48,019
- Composite
- 16.84/100
- National rank
- #9147
- State rank
- #184 of 249 in AZ
Livability — Tubac
- Score
- 67/100
- State rank
- #60
- US rank
- #10219
Category grades
Schools grade is shown separately in the Schools card above.
Census & demographics
- Census place
- Tubac, AZ
- City population
- 1,280
- Population (ZIP)
- 1,280
Population outlook (Santa Cruz County) Hauer SSP2
- Today (2025)
- 43,796 people
- By 2030
- 42,097 · -3.9%
- By 2040
- 38,235 · -12.7%
- By 2050
- 34,224 · -21.9%
- By 2075
- 26,014 · -40.6%
- By 2100
- 18,165 · -58.5%
Race, ethnicity, and origin ACS 2023
- Neighborhood character
- Predominantly White (75%)
- Race & ethnicity
- White 75% Hispanic / Latino 20% Two or more races 14% Native American 2%
- Hispanic origin (detail)
- Mexican 20%
- Common ancestry
- Slovak 5% Italian 2% Subsaharan African 2%
- Foreign-born
- 8% · Canada
- Languages at home
- 80% English-only · Spanish 20%
Political lean MEDSL · Santa Cruz
- 2024 margin
- D (+18.6) · D 58.9% · R 40.3%
- 2008→2024 swing
- -12.7pp toward R · 2008: 31.3pp · 2024: 18.6pp
- All cycles
- 2024: D+18.6 2020: D+35.5 2016: D+47.1 2012: D+37.8 2008: D+31.3
Not yet ingested
- Civics
- —
Market trends
- HPI YoY
- ▼ -0.14%
- Current HPI
- 298.5755
- Rent YoY
- —
- Metro
- —
- State GDP YoY
- ▲ 4.54%
- F500 in state
- 20
Industry mix (Fortune 500 HQ in AZ)
| Industry | F500 HQs | Revenue |
|---|---|---|
| Technology | 2 | $13B |
|
||
| Mining / Metals | 1 | $23B |
|
||
| Environmental Services | 1 | $16B |
|
||
| Metals / Steel | 1 | $14B |
|
||
| Technology Distribution | 1 | $9B |
|
||
| Homebuilding | 1 | $8B |
|
||
Price history
+90.7% since first listed18 events — show timeline
- 2026-03-02 Listed $357,000 MLSSAZ
- 2025-05-07 Listing Removed — MLSSAZ
- 2025-03-28 Price Changed $379,000 MLSSAZ
- 2025-02-26 Price Changed $385,000 MLSSAZ
- 2025-01-02 Listed $392,000 MLSSAZ
- 2012-09-14 Sold (MLS) $157,000 MLSSAZ
- 2012-09-14 Sold (MLS) $157,000 MLSSAZ
- 2011-12-12 Listed $160,000 MLSSAZ
- 2011-12-12 Listed $160,000 MLSSAZ
- 2011-06-03 Listing Removed — MLSSAZ
- 2011-06-03 Listing Removed — MLSSAZ
- 2011-06-03 Listing Removed — MLSSAZ
- 2010-07-08 Listed $225,000 MLSSAZ
- 2010-07-08 Listed $225,000 MLSSAZ
- 2010-07-08 Listed $225,000 MLSSAZ
- 2008-06-30 Listing Removed — MLSSAZ
- 2007-01-11 Listed $319,000 MLSSAZ
- 1999-10-20 Sold (Public Records) $187,195 Public Records
Property tax history
+3.6%/yrLatest (2025): $2,801 · +5.4% YoY. Source: county tax records.
Cash-flow waterfall
monthlySold comps — $/sqft
last 12 mo · ≤1 miLoading sold comps…