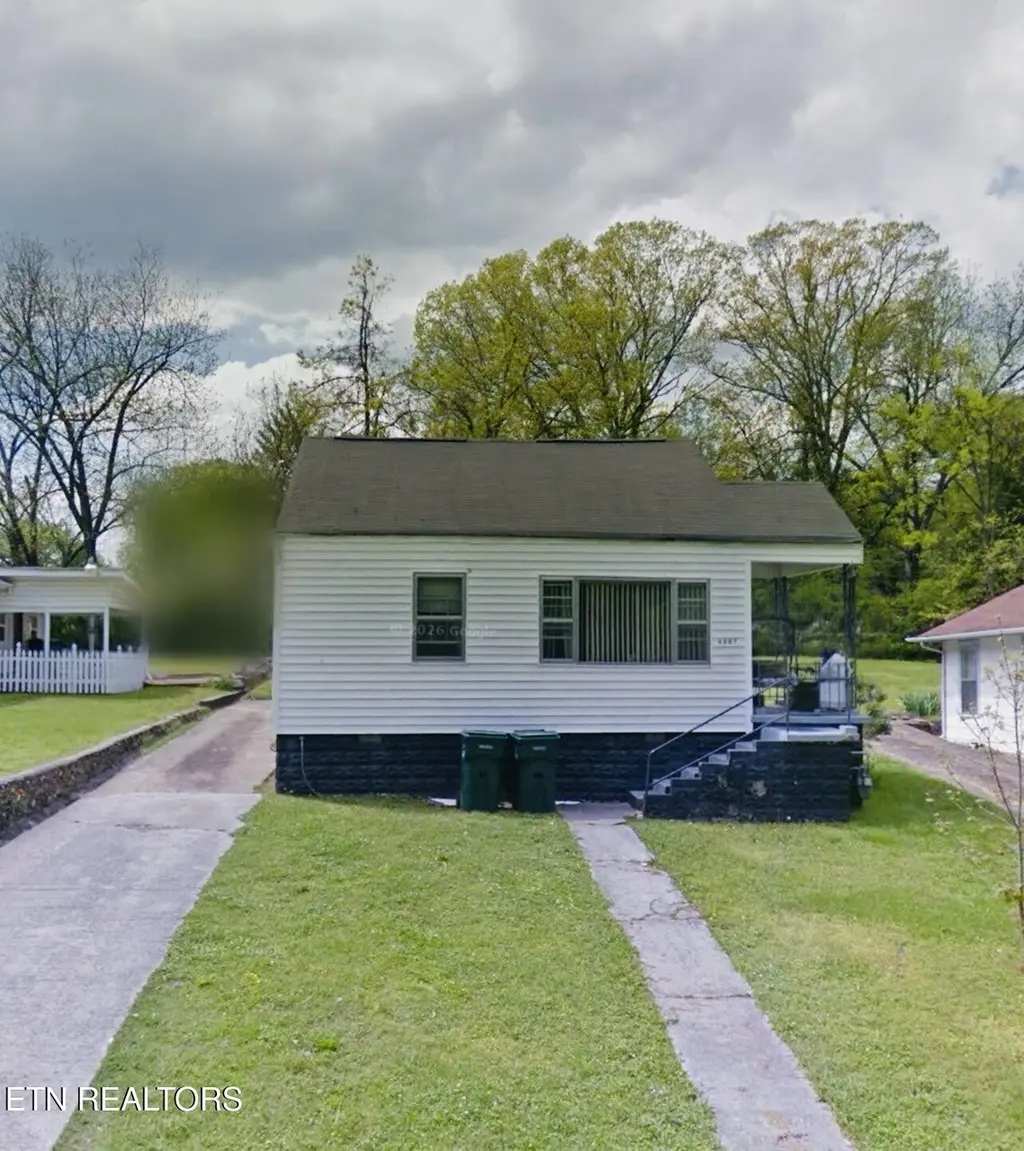
4907 17th Ave · Chattanooga, TN
Flood risk 4/10 · Minor
- FEMA flood zone
- X (unshaded)
- Chance of flooding over 30 yrs
- 0.22%
- Est. flood insurance / yr
- $507 – $1,088
Fire risk 3/10 · Minor
- Est. fire insurance / yr
- $949 – $1,763
Heat risk 6/10 · Moderate
- Hot days now (above 104°F)
- 7 days/yr
- Hot days in 30 yrs
- 20 days/yr
Wind risk 4/10 · Minor
- Chance of severe wind over 30 yrs
- 11.0%
Air-quality risk 3/10 · Minor
- Unhealthy air days now
- 2 days/yr
- Unhealthy air days in 30 yrs
- 2 days/yr
Risk factors via First Street. Map © Google.
Why this score? — see what drove the B- grade
The composite is a weighted blend of 9 inputs, each scored 0–100. Each bar is that input's sub-score; the figure is the points it added to the 100-point composite (weight × sub-score).
- Cash flow +30.0/30.0
- 1% rule +10.0/10.0
- DSCR +10.0/10.0
- ARV discount +7.5/15.0
- Livability +3.9/5.0
- Schools +2.7/10.0
- Rent growth +2.5/5.0
- Condition / age +2.5/5.0
- Appreciation +0.0/10.0
$76,000
🖨 Deal sheet 📄 Offer letter ✓ Due diligence
Key facts
- 1 acre lot
- Built 1930
- Listed 3 days
Neighborhood map
What this means for you Summary
Snapshot
- This is a 2-bed/1.0-bath single-family listed at $76k.
Deal economics
- At list price, monthly cash flow is $468 ($6k/yr) — positive.
- The deal already cash-flows at list — no discount required.
- Meets the 1% rule at list price ($1k rent vs $76k).
- Cap rate 13.7% vs local median 3.4% in Chattanooga — top-decile yield for the area; either an underpriced asset or a hidden risk that comps aren't pricing in. Stress-test before assuming the spread holds.
Location & tenants
- Location reads 78/100 on livability (#3 in TN, #2,582 nationally) — a middle-class / working-renter tenant base. Strengths: amenities A+, commute A+, cost of living A+; Watch: employment D+, schools F, crime F.
- Hamilton County (urban): math 31% / reading 31% proficiency, ranked #42 of 139 in TN (top 30%) — families likely to look elsewhere, expect single-tenant / working-renter base with shorter leases.
- Market conditions: 40 active listings in the ZIP; 18 comparable units currently listed for rent nearby; rentals at typical pace (median 24d on market — plan ~3-4 weeks tenant-placement turnaround); 2,133 units permitted in Hamilton County in 2024 (405 in 5+ unit buildings).
Forward outlook
- Local home prices are declining (-3.0%/yr); year-one equity from $525 of loan paydown is wiped out by about $2k of value loss. Plan a longer hold.
- Hamilton County population projected at +23% by 2050 — long-run rental-demand tailwind backs the buy-and-hold thesis.
- At projected returns (-3.0% appreciation + 3.0% rent growth), your $21k cash investment doubles in ~5 years — after that, you're playing with house money.
Negotiation context
- Only 3 days on market — expect competitive offers; lowballing is unlikely to land.
- Current owner paid $45k; list at $76k implies a 69% gain — meaningful room to come down on a strong offer.
Risks & watch-outs
- Watch-outs: built in 1930 — expect roof / HVAC / electrical / plumbing capex.
- Climate carrying-cost: extreme-heat days projected 7→20/yr by 2055 (HVAC capex compounding) — expect insurance premiums to compound above CPI over the hold.
Questions for the listing agent
- Built in 1930 — when were the roof, HVAC, electrical panel, plumbing, and water heater last replaced?
- Is there a deadline driving the sale (1031 exchange, divorce, estate, relocation)? That informs how much negotiation room exists.
- Schools are F-rated, which usually means shorter tenancies and higher turnover. Who's the typical renter profile here, and what's been the actual vacancy rate?
- Crime grade is F in this area — have there been break-ins, vandalism, or insurance claims at this property in the last 3 years? What carrier currently insures it and at what premium?
- What's the average days-on-market for RENTAL listings here right now (not sales)? A rising rental-DOM trend means longer vacancies and softer asking-rent achievability than the comps imply.
- What's the recent tenant-quality profile in this submarket — average credit score on applications, eviction rate, late-payment / NSF rate, and stable-employment percentage? A property-management company in the area should have these aggregated.
- How much new for-sale + rental construction is in the pipeline within 1–3 miles? Heavy new supply typically softens prices + rents 12–24 months out; constrained supply supports both.
Investment metrics
- 1% rule
- 1.53% ✓
- Cap rate
- 13.69%
- Cash-on-cash
- 26.41%
- DSCR
- 2.18
- GRM
- 5.4
CMA / ARV
- ARV (on-the-fly)
- $152,880
- Comps found
- 8
Show comp detail 8 sales within ~0.75 mi
| Address | Dist | Beds/Ba | Sqft | Sold | Price | $/sf | Match |
|---|---|---|---|---|---|---|---|
| 2806 E 46th St | 0.39mi | 1/1.0 (-1) | 798 (-5%) | 3mo | $50,000 | $63 | 66 |
| 106 Beech St | 0.66mi | 2/1.0 | 848 (+1%) | 11mo | $45,000 | $53 | 58 |
| 3214 E 46th St | 0.11mi | 3/1.5 (+1) | 908 (+8%) | 22mo | $199,000 | $219 | 56 |
| 3417 Land St | 0.57mi | 2/1.0 | 900 (+7%) | 10mo | $257,000 | $286 | 52 |
| 1611 E 50th St | 0.51mi | 2/1.0 | 784 (-7%) | 19mo | $104,000 | $133 | 49 |
| 137 Hogan Rd | 0.67mi | 2/1.0 | 932 (+11%) | 16mo | $173,000 | $186 | 37 |
| 400 Richmond Avenue Ave | 0.54mi | 2/1.0 | 950 (+13%) | 21mo | $74,000 | $78 | 35 |
| 129 Summitt St | 0.73mi | 2/1.5 | 960 (+14%) | 9mo | $175,000 | $182 | 32 |
Match score weights: distance 35% · size 25% · config 20% · recency 20%. Top-matched comps best support the ARV.
Projected returns pro-forma
-3.0% appreciation · 3.0% rent growth · sell at horizon
- IRR
- 20.2%
- Equity multiple
- 1.82×
- Total profit
- $17,490
- Equity at exit
- $11,332
- IRR
- 28.4%
- Equity multiple
- 3.52×
- Total profit
- $53,533
- Equity at exit
- $6,571
Cash invested: $21,280 (down + closing). Projections, not guarantees.
Landlord ↔ Tenant lean methodology
- Overall (STATE)
- 87 Strongly Landlord-Friendly
- State Tennessee
- 87 Strongly Landlord-Friendly · R+13
- County
- — inherits STATE
- City
- — inherits STATE
ZIP-level market 37407
- Home prices YoY
- -8.1%
- Active inventory
- 40
- Price-to-rent
- 5.4×
Monthly cashflow live
- Estimated rent
- $1,164 high interval (Pro) →
- Mortgage (P&I)
- −$399
- Tax from tax record
- −$21 /mo · $254/yr
- Insurance
- −$32
- HOA
- −$0
- Vacancy / Maint / Mgmt
- −$245
- Net cashflow
- $468
Break-even live
UW: 25.0% down · 7.5% · 30yr · 1.5% tax · 5.0% vac · 8.0% maint · 8.0% mgmt
Financing live
Cash to close
- Down payment
- $19,000
- Closing costs
- $2,280
- Reserves months
- —
- Total cash needed
- —
Loan-product check · same deal, 3 products live
Conventional
25% down · 7.5% · 30yr
- Down + closing
- —
- Monthly P&I
- —
- Monthly cashflow
- —
- DSCR
- —
- Eligible?
- —
Personal DTI + credit; lowest rate.
DSCR
20% down · 8.5% · 30yr
- Down + closing
- —
- Monthly P&I
- —
- Monthly cashflow
- —
- DSCR
- —
- Eligible?
- —
No personal income docs; deal must DSCR.
Hard money
10% down · 12.0% · 12mo
- Down + closing
- —
- Monthly P&I
- —
- Monthly cashflow
- —
- DSCR
- —
- Eligible?
- —
Short-term bridge; refi at stabilization.
Rent comps 18 comps
| Address | Beds | Baths | Sqft | Rent | $/sqft | DOM | Units | Dist |
|---|---|---|---|---|---|---|---|---|
| 813 Chickamauga Ave Unit A Rossville, GA | 2.0 | 1.0 | 900 | $1,099 | $1.22 | 23d | 1 | 0.64mi |
| 819 Asterwood Dr Unit B Rossville, GA | 2.0 | 2.0 | 975 | $1,445 | $1.48 | 14d | 1 | 0.80mi |
| 515 W Gordon Ave Rossville, GA | 2.0 | 1.0 | 906 | $999 | $1.10 | 44d | 1 | 0.82mi |
| 2904 E 37th St Chattanooga, TN | 1.0 | 1.0 | 800 | $850 | $1.06 | 23d | 1 | 0.84mi |
| 1591 Park City Rd Apt E15 Rossville, GA | 2.0 | 1.0 | 1050 | $1,145 | $1.09 | 23d | 1 | 0.90mi |
| 505 Flegal Ave Rossville, GA | 2.0 | 1.0 | 768 | $1,050 | $1.37 | 23d | 1 | 0.92mi |
| 3380 Shadowlawn Dr Unit 2 Chattanooga, TN | 2.0 | 2.0 | 629 | $1,323 | $2.10 | 14d | 1 | 1.00mi |
| 3392 Shadowlawn Dr Unit A East Ridge, TN | 1.0 | 1.0 | 800 | $1,003 | $1.25 | 14d | 1 | 1.01mi |
| 304 Cherry St Rossville, GA | 2.0 | 1.0 | 982 | $1,675 | $1.71 | 44d | 1 | 1.05mi |
| 340 Alpine Dr Rossville, GA | 2.0 | 1.0 | 836 | $1,275 | $1.53 | 14d | 1 | 1.12mi |
| 3414 Betty Ln Chattanooga, TN | 2.0 | 1.5 | 1117 | $1,295 | $1.16 | 23d | 1 | 1.16mi |
| 804 Henderson Ave Rossville, GA | 2.0 | 1.0 | 948 | $1,025 | $1.08 | 14d | 1 | 1.17mi |
| 3114 14th Ave Apt A Chattanooga, TN | 1.0 | 1.0 | 800 | $950 | $1.19 | 23d | 1 | 1.19mi |
| 3403 Gail Dr Chattanooga, TN | 2.0 | 1.5 | 1000 | $1,425 | $1.43 | 14d | 1 | 1.22mi |
| 817 Henderson Ave Rossville, GA | 2.0 | 1.0 | 844 | $1,150 | $1.36 | 14d | 1 | 1.23mi |
| 3308 Roadrunner Trl Chattanooga, TN | 2.0 | 2.0 | 1000 | $1,323 | $1.32 | 23d | 1 | 1.25mi |
| 1106 Carline Rd Apt B Rossville, GA | 2.0 | 1.5 | 877 | $1,095 | $1.25 | 21d | 1 | 1.28mi |
| 1106 Carline Rd Rossville, GA | 2.0 | 1.5 | 1012 | $1,095 | $1.08 | 14d | 1 | 1.28mi |
Listing history 4 events
-
2026-05-30status $76,000 Pending 3 DOM
-
2026-04-04status Pending
-
2026-04-03$76,000 Active
-
2008-08-27soldstatus $45,000
ⓘ Source: listings_history table (triggers on properties + properties_extension) + one-shot
backfill from property_details.listing_events for pre-trigger history.
Tax reassessment forecast TN · Resets to sale price
- Current annual tax
- $254 · $21/mo
- Projected year-2 tax
- $540 · $45/mo
- Expected delta
- +$286/yr (+$24/mo · 112.5%)
ⓘ Screening estimate from a state-policy table — verify with the county assessor before closing.
Climate risk First Street
- Flood 4/10 Moderate FEMA zone X (unshaded) · 22% chance over 30 yrs
- Wildfire 3/10 Moderate
- Heat 6/10 Major 7 d/yr ≥104°F today · 20 d/yr by 30 yrs out
- Wind 4/10 Moderate 11% chance of damaging wind over 30 yrs
- Air quality 3/10 Moderate 2 unhealthy d/yr today · 2 by 30 yrs out
Nearby sold comps map
Loading sold comps map…
Walkable amenities ~0.75 mi
Loading nearby amenities…
Taxation est. · year 1
- Rental income
- $13,971
- − Mortgage interest
- −$4,257
- − Property taxes
- −$254
- − Insurance
- −$380
- − Repairs & maintenance
- −$1,118
- − Management
- −$1,118
- − Depreciation
- −$2,211
- Taxable income
- $4,634
- Est. tax owed @ 24.0%
- −$1,112
- After-tax cash flow
- $4,509/yr
For passive investors: Depreciation is non-cash, so a rental often shows a tax loss while cash-flowing — sheltering income. Rental losses are passive: they offset passive income freely, and up to $25,000/yr can offset ordinary (W-2) income if you actively participate and your MAGI is under $100k (phasing out to $0 by $150k); unused losses carry forward. On sale, claimed depreciation is recaptured at up to 25%, and gains may owe capital-gains tax (a 1031 exchange can defer both). Figures are a year-1 estimate at your 24.0% rate — not tax advice; consult a CPA.
Schools (NCES district)
- District
- Hamilton County
- NCES district ID
- 4701590
- Math proficiency
- 31% ▼ -10.00%
- Reading proficiency
- 31% ▼ -3.00%
- Median HH income
- $47,456
- Composite
- 26.8/100
- National rank
- #7122
- State rank
- #42 of 139 in TN
Livability — Chattanooga
- Score
- 78/100
- State rank
- #3
- US rank
- #2582
Category grades
Schools grade is shown separately in the Schools card above.
Census & demographics
- Census place
- Chattanooga, TN
- City population
- 131,999
- Population (ZIP)
- 10,164
Population outlook (Hamilton County) Hauer SSP2
- Today (2025)
- 393,784 people
- By 2030
- 412,983 · +4.9%
- By 2040
- 449,502 · +14.1%
- By 2050
- 484,341 · +23.0%
- By 2075
- 565,746 · +43.7%
- By 2100
- 618,394 · +57.0%
Race, ethnicity, and origin ACS 2023
- Neighborhood character
- Diverse neighborhood (Simpson 0.68)
- Race & ethnicity
- Hispanic / Latino 43% White 29% Black 22% Two or more races 14%
- Hispanic origin (detail)
- Mexican 9%
- Common ancestry
- Serbian 1% Slovak 1% Lithuanian 1%
- Foreign-born
- 27% · Canada
- Languages at home
- 52% English-only · Spanish 43% Arabic 3%
Political lean MEDSL · Hamilton
- 2024 margin
- R (+13.1) · D 42.7% · R 55.7% · Other 1.6%
- 2008→2024 swing
- -1.2pp toward R · 2008: -11.8pp · 2024: -13.1pp
- All cycles
- 2024: R+13.1 2020: R+9.7 2016: R+16.6 2012: R+14.8 2008: R+11.8
Not yet ingested
- Civics
- —
Market trends
- HPI YoY
- ▼ -18.82%
- Current HPI
- 212.4869
- Rent YoY
- —
- Metro
- —
- State GDP YoY
- ▲ 2.78%
- F500 in state
- 22
Industry mix (Fortune 500 HQ in TN)
| Industry | F500 HQs | Revenue |
|---|---|---|
| Healthcare | 3 | $91B |
|
||
| Retail | 3 | $72B |
|
||
| Transportation / Logistics | 1 | $88B |
|
||
| Paper / Packaging | 1 | $19B |
|
||
| Insurance | 1 | $13B |
|
||
| Energy | 1 | $12B |
|
||
Price history
+68.9% since first listed3 events — show timeline
- 2026-04-04 Pending — Knoxville MLS
- 2026-04-03 Listed $76,000 Knoxville MLS
- 2008-08-27 Sold (Public Records) $45,000 Public Records
Property tax history
+1.6%/yrLatest (2025): $254 · +34.3% YoY. Source: county tax records.
Cash-flow waterfall
monthlySold comps — $/sqft
last 12 mo · ≤1 miLoading sold comps…