412 New Scotland Ave · Albany, NY
Flood risk 1/10 · Minimal
- FEMA flood zone
- X (unshaded)
- Chance of flooding over 30 yrs
- 0.0%
- Est. flood insurance / yr
- $473 – $860
Fire risk 1/10 · Minimal
- Est. fire insurance / yr
- $691 – $1,283
Heat risk 4/10 · Minor
- Hot days now (above 97°F)
- 7 days/yr
- Hot days in 30 yrs
- 16 days/yr
Wind risk 3/10 · Minor
- Chance of severe wind over 30 yrs
- 6.0%
Air-quality risk 1/10 · Minimal
- Unhealthy air days now
- 0 days/yr
- Unhealthy air days in 30 yrs
- 0 days/yr
Risk factors via First Street. Map © Google.
Why this score? — see what drove the B grade
The composite is a weighted blend of 9 inputs, each scored 0–100. Each bar is that input's sub-score; the figure is the points it added to the 100-point composite (weight × sub-score).
- Cash flow +30.0/30.0
- DSCR +10.0/10.0
- 1% rule +9.6/10.0
- ARV discount +7.5/15.0
- Livability +4.0/5.0
- Rent growth +3.8/5.0
- Schools +3.2/10.0
- Condition / age +2.5/5.0
- Appreciation +0.0/10.0
$159,900
🖨 Deal sheet (PDF) 📄 Offer letter ✓ Due diligence
Listing remarks MLS
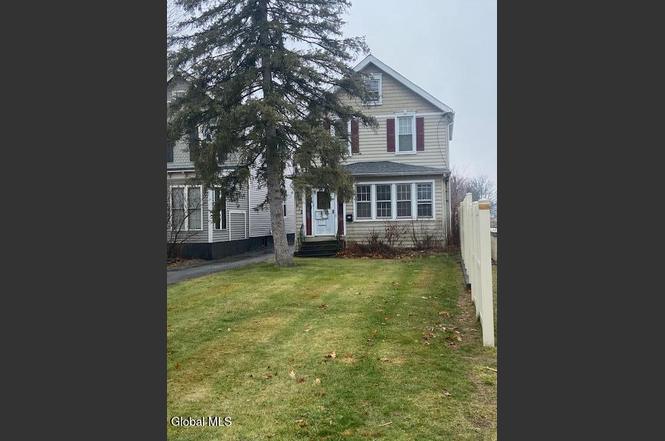
Affordable, updated colonial near schools, restaurants, banks and churches. 2 new baths, huge kitchen, large master, 1st floor den, garage w/loft for all your projects! Contingent on owner securing home of choice. Excellent Condition
Key facts
- Large eat in kitchen
- Enclosed rear porch
- Hwf floors
Tags
Neighborhood map
What this means for you Summary
Snapshot
- This is a 4-bed/1.5-bath single-family listed at $160k.
Deal economics
- At list price, monthly cash flow is $743 ($9k/yr) — positive.
- The deal already cash-flows at list — no discount required.
- Meets the 1% rule at list price ($2k rent vs $160k).
- Recommended offer: $158k (1.5% below list) — sets the bar for market timing.
- Cap rate 11.9% vs local median 5.7% in Albany — top-decile yield for the area; either an underpriced asset or a hidden risk that comps aren't pricing in. Stress-test before assuming the spread holds.
Location & tenants
- Location reads 79/100 on livability (#129 in NY, #2,083 nationally) — a middle-class / working-renter tenant base. Strengths: amenities A+, commute A+, housing A+; Watch: employment C-, crime F.
- Albany City School District (urban): math 37% / reading 40% proficiency, ranked #543 of 590 in NY (top 92%) — families likely to look elsewhere, expect single-tenant / working-renter base with shorter leases; 66% free/reduced lunch — lower-income household profile, screen leases tightly.
- Zoned schools: New Scotland Elementary School (math 37% / reading 52%, grade F, #1,277 of 2,108 statewide, top 64%, 473 students, 48% FRL); Albany High School (math 74% / reading 67%, grade B+, #710 of 1,100 statewide, top 65%, 2,676 students, 69% FRL).
- Zoned-school proficiency averages 58% at this address vs 38% district-wide (+19 pts) — the actual schools serving this property are materially stronger than the Albany City School District average implies; a family-tenant draw the district grade alone would hide.
- Market conditions: Rents rising fast (+5.0%/yr); 99 active listings in the ZIP; 37 comparable units currently listed for rent nearby; rentals at typical pace (median 24d on market — plan ~3-4 weeks tenant-placement turnaround); 41% of comp listings sitting > 30 days — soft ceiling on asking rent; 675 units permitted in Albany County in 2024 (451 in 5+ unit buildings).
- This rent runs 40% of the median local income ($70k/yr) — at the standard rent-burdened threshold; future hikes will face affordability resistance.
Forward outlook
- Local home prices are declining (-3.0%/yr); year-one equity from $1k of loan paydown is wiped out by about $5k of value loss. Plan a longer hold.
- Albany County population projected at +9% by 2050 — modest demand growth; plan on rents tracking national, not racing it.
- At projected returns (-3.0% appreciation + 5.0% rent growth), your $45k cash investment doubles in ~6 years — after that, you're playing with house money.
Negotiation context
- It's been on market 18 days — a 2% lower offer ($158k) is reasonable based on typical stale-listing flexibility.
- 4 sale attempts since 23y ago with the ask held roughly flat each time — persistent listings suggest the price (not the market) is what's stuck; bring a comps-based counter.
Risks & watch-outs
- Watch-outs: built in 1909 — expect roof / HVAC / electrical / plumbing capex.
Questions for the listing agent
- Built in 1909 — when were the roof, HVAC, electrical panel, plumbing, and water heater last replaced?
- Is there a deadline driving the sale (1031 exchange, divorce, estate, relocation)? That informs how much negotiation room exists.
- Crime grade is F in this area — have there been break-ins, vandalism, or insurance claims at this property in the last 3 years? What carrier currently insures it and at what premium?
- What's the average days-on-market for RENTAL listings here right now (not sales)? A rising rental-DOM trend means longer vacancies and softer asking-rent achievability than the comps imply.
- What's the recent tenant-quality profile in this submarket — average credit score on applications, eviction rate, late-payment / NSF rate, and stable-employment percentage? A property-management company in the area should have these aggregated.
- How much new for-sale + rental construction is in the pipeline within 1–3 miles? Heavy new supply typically softens prices + rents 12–24 months out; constrained supply supports both.
Investment metrics
- 1% rule
- 1.46% ✓
- Cap rate
- 11.87%
- Cash-on-cash
- 19.91%
- DSCR
- 1.89
- GRM
- 5.7
CMA / ARV
- ARV (on-the-fly)
- $322,176
- Comps found
- 12
Show comp detail 12 sales within ~0.75 mi
| Address | Dist | Beds/Ba | Sqft | Sold | Price | $/sf | Match |
|---|---|---|---|---|---|---|---|
| 2 Glenwood St | 0.09mi | 3/1.5 (-1) | 1,824 (+9%) | 2mo | $325,000 | $178 | 75 |
| 16 Oakwood St | 0.20mi | 3/2.0 (-1) | 1,470 (-12%) | 1mo | $350,000 | $238 | 62 |
| 182 Whitehall Rd | 0.66mi | 4/1.5 | 1,624 (-3%) | 3mo | $312,000 | $192 | 62 |
| 151 Woodlawn Ave | 0.34mi | 3/1.5 (-1) | 1,486 (-11%) | 0mo | $255,000 | $172 | 59 |
| 59 Van Schoick Ave | 0.29mi | 3/2.5 (-1) | 1,500 (-11%) | 2mo | $345,000 | $230 | 58 |
| 86 Grove Ave | 0.38mi | 3/1.5 (-1) | 1,500 (-11%) | 3mo | $295,000 | $197 | 57 |
| 274 Partridge St | 0.62mi | 5/1.5 (+1) | 1,614 (-4%) | 5mo | $250,000 | $155 | 56 |
| 880 Mercer St | 0.59mi | 3/2.0 (-1) | 1,571 (-6%) | 1mo | $316,000 | $201 | 54 |
| 66 Oakwood St | 0.33mi | 3/1.0 (-1) | 1,440 (-14%) | 1mo | $305,000 | $212 | 53 |
| 879 Mercer St | 0.61mi | 3/1.5 (-1) | 1,550 (-8%) | 4mo | $283,250 | $183 | 51 |
| 289 W Lawrence St | 0.69mi | 3/1.5 (-1) | 1,784 (+6%) | 2mo | $305,000 | $171 | 51 |
| 42 Peyster St | 0.47mi | 3/1.5 (-1) | 1,911 (+14%) | 5mo | $273,500 | $143 | 46 |
Match score weights: distance 35% · size 25% · config 20% · recency 20%. Top-matched comps best support the ARV.
Projected returns pro-forma
-3.0% appreciation · 5.05% rent growth · sell at horizon
- IRR
- 14.4%
- Equity multiple
- 1.59×
- Total profit
- $26,362
- Equity at exit
- $23,842
- IRR
- 24.6%
- Equity multiple
- 3.35×
- Total profit
- $105,092
- Equity at exit
- $13,825
Cash invested: $44,772 (down + closing). Projections, not guarantees.
Landlord ↔ Tenant lean methodology
- Overall (STATE)
- 15 Strongly Tenant-Friendly
- State New York
- 15 Strongly Tenant-Friendly · D+10
- County
- — inherits STATE
- City
- — inherits STATE
ZIP-level market 12208
- Home prices YoY
- -30.1%
- Rents YoY
- 5.0%
- Active inventory
- 99
- Price-to-rent
- 5.7×
Monthly cashflow live
- Estimated rent
- $2,339 high interval (Pro) →
- Mortgage (P&I)
- −$839
- Tax est. 1.5%
- −$200 /mo · $2,398/yr
- Insurance
- −$67
- HOA
- −$0
- Vacancy / Maint / Mgmt
- −$491
- Net cashflow
- $743
Break-even live
Sensitivity live
| Price | -10% $853 | -5% $798 | +0% $743 | +5% $688 | +10% $632 |
|---|---|---|---|---|---|
| Rent | -10% $558 | -5% $650 | +0% $743 | +5% $835 | +10% $928 |
| Rate | -1.0pp $823 | -0.5pp $784 | base $743 | +0.5pp $701 | +1.0pp $659 |
UW: 25.0% down · 7.5% · 30yr · 1.5% tax · 5.0% vac · 8.0% maint · 8.0% mgmt
Financing live
Cash to close
- Down payment
- $39,975
- Closing costs
- $4,797
- Reserves months
- —
- Total cash needed
- —
Loan-product check · same deal, 3 products live
Conventional
25% down · 7.5% · 30yr
- Down + closing
- —
- Monthly P&I
- —
- Monthly cashflow
- —
- DSCR
- —
- Eligible?
- —
Personal DTI + credit; lowest rate.
DSCR
20% down · 8.5% · 30yr
- Down + closing
- —
- Monthly P&I
- —
- Monthly cashflow
- —
- DSCR
- —
- Eligible?
- —
No personal income docs; deal must DSCR.
Hard money
10% down · 12.0% · 12mo
- Down + closing
- —
- Monthly P&I
- —
- Monthly cashflow
- —
- DSCR
- —
- Eligible?
- —
Short-term bridge; refi at stabilization.
Rent comps 37 comps
| Address | Beds | Baths | Sqft | Rent | $/sqft | DOM | Units | Dist |
|---|---|---|---|---|---|---|---|---|
| 30 Cardinal Ave Albany, NY | 4.0 | 1.0 | 1529 | $2,800 | $1.83 | 45d | 1 | 0.16mi |
| 38 W Erie St Albany, NY | 4.0 | 2.0 | 1440 | $2,800 | $1.94 | 24d | 1 | 0.25mi |
| 52 Grove Ave Albany, NY | 4.0 | 1.0 | 1200 | $2,200 | $1.83 | 21d | 1 | 0.36mi |
| 21 Woodlawn Ave Unit 3RDFL Albany, NY | 3.0 | 1.0 | 1300 | $1,500 | $1.15 | 44d | 1 | 0.49mi |
| 21 Woodlawn Ave Unit 3rd floor Albany, NY | 3.0 | 1.0 | 1300 | $1,500 | $1.15 | 24d | 1 | 0.49mi |
| 32 Peyster St Unit 2nd Albany, NY | 3.0 | 2.0 | 1500 | $2,300 | $1.53 | 44d | 1 | 0.50mi |
| 104 S Main Ave Unit 1 Albany, NY | 3.0 | 1.0 | 1300 | $2,600 | $2.00 | 44d | 1 | 0.51mi |
| 546 Mercer St Unit 1 Albany, NY | 3.0 | 1.0 | 1400 | $1,800 | $1.29 | 24d | 1 | 0.58mi |
| 614 Park Ave Albany, NY | 3.0 | 1.0 | 1118 | $2,500 | $2.24 | 44d | 1 | 0.63mi |
| 673 Myrtle Ave Albany, NY | 4.0 | 1.0 | 1076 | $2,400 | $2.23 | 21d | 1 | 0.67mi |
| 602 Morris St Albany, NY | 3.0 | 1.0 | 1270 | $1,850 | $1.46 | 14d | 1 | 0.70mi |
| 830 Madison Ave Albany, NY | 3.0 | 1.0 | 1180 | $1,700 | $1.44 | 24d | 1 | 0.80mi |
| 53 Greenway N Albany, NY | 3.0 | 2.0 | 1500 | $2,600 | $1.73 | 24d | 1 | 0.80mi |
| 78 S Pine Ave Unit 2 Albany, NY | 3.0 | 1.5 | 1541 | $2,350 | $1.52 | 14d | 1 | 0.85mi |
| 257 Quail St Albany, NY | 4.0 | 2.5 | 2208 | $2,800 | $1.27 | 44d | 1 | 0.88mi |
| 489 Hamilton St Unit 1 Albany, NY | 3.0 | 1.0 | 1100 | $1,800 | $1.64 | 14d | 1 | 0.89mi |
| 437 Hamilton St Unit 2 Albany, NY | 4.0 | 1.0 | 1200 | $2,300 | $1.92 | 14d | 1 | 0.93mi |
| 433 Hamilton St Unit 1 Albany, NY | 4.0 | 1.0 | 1200 | $2,300 | $1.92 | 14d | 1 | 0.94mi |
| 58 Elberon Pl Apt 2 Albany, NY | 4.0 | 1.0 | 1250 | $2,200 | $1.76 | 44d | 1 | 1.01mi |
| 273 Western Ave Unit 3 Albany, NY | 3.0 | 1.0 | 1100 | $1,850 | $1.68 | 24d | 1 | 1.01mi |
| 502 Second Ave #3 Albany, NY | 3.0 | 1.0 | 1100 | $1,800 | $1.64 | 44d | 1 | 1.03mi |
| 223 Western Ave #1 Albany, NY | 3.0 | 1.0 | 1100 | $1,750 | $1.59 | 24d | 1 | 1.05mi |
| 178 Western Ave Unit 3 Albany, NY | 3.0 | 1.0 | 1500 | $1,725 | $1.15 | 14d | 1 | 1.08mi |
| 15 Stanwix St Albany, NY | 4.0 | 1.5 | 1660 | $2,500 | $1.51 | 14d | 1 | 1.09mi |
| 786 New Scotland Ave Albany, NY | 5.0 | 2.5 | 1209 | $3,000 | $2.48 | 44d | 1 | 1.11mi |
| 50 Southern Blvd Albany, NY | 3.0 | 1.0 | 1200 | $1,650 | $1.38 | 14d | 1 | 1.13mi |
| 147 Western Ave Albany, NY | 3.0 | 1.0 | 1428 | $1,800 | $1.26 | 14d | 1 | 1.15mi |
| 31 Bertha St Albany, NY | 4.0 | 1.0 | 1116 | $2,000 | $1.79 | 24d | 1 | 1.16mi |
| 520 Madison Ave Unit 1 Albany, NY | 3.0 | 1.0 | 1080 | $1,700 | $1.57 | 44d | 1 | 1.17mi |
| 569 Washington Ave Unit 1st Floor Albany, NY | 4.0 | 1.0 | 1275 | $2,000 | $1.57 | 44d | 1 | 1.19mi |
| 22 Hurlbut St Albany, NY | 3.0 | 1.0 | 1209 | $2,050 | $1.70 | 44d | 1 | 1.20mi |
| 2 Friebel Rd Albany, NY | 3.0 | 2.0 | 1392 | $2,200 | $1.58 | 14d | 1 | 1.27mi |
| 135 Winthrop Ave Albany, NY | 3.0 | 2.0 | 1788 | $3,500 | $1.96 | 44d | 1 | 1.31mi |
| 726 Western Ave Albany, NY | 4.0 | 2.5 | 1900 | $2,800 | $1.47 | 44d | 1 | 1.32mi |
| 88 Willett St Albany, NY | 3.0 | 1.0 | 825 | $2,080 | $2.52 | 14d | 10 | 1.32mi |
| 830 Western Ave Albany, NY | 4.0 | 2.5 | 1600 | $2,700 | $1.69 | 14d | 1 | 1.40mi |
| 201 Park Ave Unit 10 Albany, NY | 3.0 | 2.0 | 1600 | $2,100 | $1.31 | 44d | 1 | 1.45mi |
Listing history 12 events
-
2026-04-16status Pending
-
2026-04-16status Active
-
2026-02-03historical
-
2026-01-16$159,900 Active
-
2008-04-11soldstatus $183,500
-
2008-04-10soldstatus $183,500 233-char remark
Show marketing remark (233 chars)
Affordable, updated colonial near schools, restaurants, banks and churches. 2 new baths, huge kitchen, large master, 1st floor den, garage w/loft for all your projects! Contingent on owner securing home of choice. Excellent Condition
-
2008-02-25historical 233-char remark
Show marketing remark (233 chars)
Affordable, updated colonial near schools, restaurants, banks and churches. 2 new baths, huge kitchen, large master, 1st floor den, garage w/loft for all your projects! Contingent on owner securing home of choice. Excellent Condition
-
2008-01-07$189,900 233-char remark
Show marketing remark (233 chars)
Affordable, updated colonial near schools, restaurants, banks and churches. 2 new baths, huge kitchen, large master, 1st floor den, garage w/loft for all your projects! Contingent on owner securing home of choice. Excellent Condition
-
2003-11-25soldstatus $101,000
-
2003-09-04soldstatus $101,000 203-char remark
Show marketing remark (203 chars)
NEWER LARGE OAK KITCHEN ALL APPLIANCES INCLUDED. FIRST FLR DEN, DECORATIVE FIREPLACE IN LIVING ROOM, 1ST FLR WALL TO WALL CARPET OVER HARDWOOD FLRS. CONTACT BETH TO SHOW @ 495-1766 -- Very Good Condition
-
2003-05-27historical 203-char remark
Show marketing remark (203 chars)
NEWER LARGE OAK KITCHEN ALL APPLIANCES INCLUDED. FIRST FLR DEN, DECORATIVE FIREPLACE IN LIVING ROOM, 1ST FLR WALL TO WALL CARPET OVER HARDWOOD FLRS. CONTACT BETH TO SHOW @ 495-1766 -- Very Good Condition
-
2003-04-24$109,900 203-char remark
Show marketing remark (203 chars)
NEWER LARGE OAK KITCHEN ALL APPLIANCES INCLUDED. FIRST FLR DEN, DECORATIVE FIREPLACE IN LIVING ROOM, 1ST FLR WALL TO WALL CARPET OVER HARDWOOD FLRS. CONTACT BETH TO SHOW @ 495-1766 -- Very Good Condition
ⓘ Source: listings_history table (triggers on properties + properties_extension) + one-shot
backfill from property_details.listing_events for pre-trigger history.
Climate risk First Street
- Flood 1/10 Low FEMA zone X (unshaded) · 0% chance over 30 yrs
- Wildfire 1/10 Low
- Heat 4/10 Moderate 7 d/yr ≥97°F today · 16 d/yr by 30 yrs out
- Wind 3/10 Moderate 6% chance of damaging wind over 30 yrs
- Air quality 1/10 Low 0 unhealthy d/yr today · 0 by 30 yrs out
Nearby sold comps map
Loading sold comps map…
Walkable amenities ~0.75 mi
Loading nearby amenities…
Taxation est. · year 1
- Rental income
- $28,070
- − Mortgage interest
- −$8,957
- − Property taxes
- −$2,398
- − Insurance
- −$800
- − Repairs & maintenance
- −$2,246
- − Management
- −$2,246
- − Depreciation
- −$4,652
- Taxable income
- $6,772
- Est. tax owed @ 24.0%
- −$1,625
- After-tax cash flow
- $7,289/yr
For passive investors: Depreciation is non-cash, so a rental often shows a tax loss while cash-flowing — sheltering income. Rental losses are passive: they offset passive income freely, and up to $25,000/yr can offset ordinary (W-2) income if you actively participate and your MAGI is under $100k (phasing out to $0 by $150k); unused losses carry forward. On sale, claimed depreciation is recaptured at up to 25%, and gains may owe capital-gains tax (a 1031 exchange can defer both). Figures are a year-1 estimate at your 24.0% rate — not tax advice; consult a CPA.
Schools (NCES district)
- District
- Albany City School District
- NCES district ID
- 3602460
- Math proficiency
- 37% ▲ 6.00%
- Reading proficiency
- 40% ▲ 7.00%
- Median HH income
- $40,568
- Composite
- 32.34/100
- National rank
- #5744
- State rank
- #543 of 590 in NY
Livability — Albany
- Score
- 79/100
- State rank
- #129
- US rank
- #2083
Category grades
Schools grade is shown separately in the Schools card above.
Census & demographics
- Census place
- Albany, NY
- County
- Albany County · 196,626 people
- City population
- 116,921
- Metro
- Albany-Schenectady-Troy, NY
- Population (ZIP)
- 23,289
- Household income
- $70,413
- Rent vs Own
- Severe rent burden
- 1952.0
Population outlook (Albany County) Hauer SSP2
- Today (2025)
- 320,794 people
- By 2030
- 327,401 · +2.1%
- By 2040
- 338,218 · +5.4%
- By 2050
- 348,467 · +8.6%
- By 2075
- 381,693 · +19.0%
- By 2100
- 393,809 · +22.8%
Race, ethnicity, and origin ACS 2023
- Neighborhood character
- Predominantly White (66%)
- Race & ethnicity
- White 66% Black 12% Asian 10% Hispanic / Latino 7% Two or more races 7%
- Hispanic origin (detail)
- Puerto Rican 3%
- Common ancestry
- Romanian 5% Italian 3% Scotch-Irish 3%
- Foreign-born
- 16% · Canada, China, Philippines
- Languages at home
- 83% English-only · Other Indo-European 4% Other Asian/Pacific 3% French/Haitian/Cajun 2%
Political lean MEDSL · Albany
- 2024 margin
- Strong D (+25.8) · D 62.9% · R 37.1%
- 2008→2024 swing
- -3.6pp toward R · 2008: 29.4pp · 2024: 25.8pp
- All cycles
- 2024: D+25.8 2020: D+31.4 2016: D+24.3 2012: D+31.0 2008: D+29.4
Not yet ingested
- Civics
- —
Market trends
- HPI YoY
- ▼ -120.46%
- Current HPI
- 279.716
- Rent YoY
- ▲ 5.05%
- Metro
- Albany-Schenectady-Troy, NY
- State GDP YoY
- ▲ 2.60%
- F500 in state
- 92
Industry mix (Fortune 500 HQ in NY)
| Industry | F500 HQs | Revenue |
|---|---|---|
| Financial Services | 10 | $950B |
|
||
| Consumer Goods | 9 | $162B |
|
||
| Insurance | 4 | $225B |
|
||
| Telecommunications | 2 | $144B |
|
||
| Pharmaceuticals | 2 | $112B |
|
||
| Media / Entertainment | 2 | $69B |
|
||
Price history
+45.5% since first listed12 events — show timeline
- 2026-04-16 Pending — Global MLS
- 2026-04-16 Relisted — Global MLS
- 2026-02-03 Listing Removed — Global MLS
- 2026-01-16 Listed $159,900 Global MLS
- 2008-04-11 Sold (Public Records) $183,500 Public Records
- 2008-04-10 Sold (MLS) $183,500 Global MLS
- 2008-02-25 Listing Removed — Global MLS
- 2008-01-07 Listed $189,900 Global MLS
- 2003-11-25 Sold (Public Records) $101,000 Public Records
- 2003-09-04 Sold (MLS) $101,000 Global MLS
- 2003-05-27 Listing Removed — Global MLS
- 2003-04-24 Listed $109,900 Global MLS
Property tax history
+18.9%/yrLatest (2025): $180 · +100.0% YoY. Source: county tax records.
Cash-flow waterfall
monthlySold comps — $/sqft
last 12 mo · ≤1 miLoading sold comps…