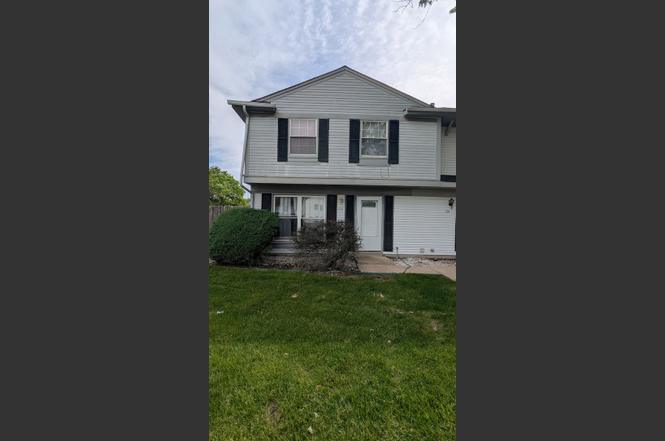
130 Central Ave · Matteson, IL
Flood risk 1/10 · Minimal
- FEMA flood zone
- X (unshaded)
- Chance of flooding over 30 yrs
- 0.0%
- Est. flood insurance / yr
- $507 – $1,088
Fire risk 3/10 · Minor
- Est. fire insurance / yr
- $804 – $1,492
Heat risk 3/10 · Minor
- Hot days now (above 101°F)
- 7 days/yr
- Hot days in 30 yrs
- 16 days/yr
Wind risk 2/10 · Minimal
- Chance of severe wind over 30 yrs
- —
Air-quality risk 2/10 · Minimal
- Unhealthy air days now
- 1 days/yr
- Unhealthy air days in 30 yrs
- 1 days/yr
Risk factors via First Street. Map © Google.
Why this score? — see what drove the B- grade
The composite is a weighted blend of 9 inputs, each scored 0–100. Each bar is that input's sub-score; the figure is the points it added to the 100-point composite (weight × sub-score).
- Cash flow +30.0/30.0
- 1% rule +10.0/10.0
- DSCR +10.0/10.0
- ARV discount +7.5/15.0
- Livability +3.4/5.0
- Rent growth +2.5/5.0
- Condition / age +2.5/5.0
- Schools +0.9/10.0
- Appreciation +0.0/10.0
$139,000
🖨 Deal sheet 📄 Offer letter ✓ Due diligence
Listing remarks
AFFORDABLE LIVING CLOSE TO PARKS, TENNIS COURTS, AND WALKING/BIKE TRAILS. PRIVATE FENCED BACK YARD. TWO STORY THREE BEDROOM TOWNHOME ON A QUIET BLOCK ACROSS FROM A SCHOOL. WATER HEATER REPLACED IN 2025. OFF STREET PARKING.
Key facts
- Off street parking
- 2 parking spots
- Built 1974
Tags
Property features AI
Finance
- Other: School bus service available
- Financial info: Property currently being leased
- HOA & community: Monthly association fee of $197; HOA covers parking, insurance, exterior maintenance, lawn care, and snow removal
Exterior
- Parking: Off-street parking for 2 cars
- Utilities: Water source: Lake Michigan; Public sewer
- Home design: Detached single-family condo; Two-story
- Construction: Frame construction; Asphalt roof; Built approximately 51–60 years ago; Built before 1978
- Exterior features: Deck; Less than 0.25 acre lot
Interior
- Kitchen: Range; Refrigerator; Kitchen on main level (approx. 13 x 8)
- Bedrooms: Master bedroom on second level (approx. 11 x 10); Second bedroom on second level (approx. 11 x 8); Third bedroom on second level (approx. 10 x 8)
- Flooring: Other flooring throughout
- Bathrooms: 1 full bathroom
- Heating & cooling: Natural gas forced air heating; Central air conditioning
- Interior features: Screens on windows; Six total rooms
- Laundry & utility: Laundry in kitchen; Electric dryer hookup
Neighborhood map
What this means for you Summary
Snapshot
- This is a 3-bed/1.0-bath condo listed at $139k.
Deal economics
- At list price, monthly cash flow is $926 ($11k/yr) — positive.
- The deal already cash-flows at list — no discount required.
- Meets the 1% rule at list price ($3k rent vs $139k).
- Cap rate 14.3% vs local median 6.2% in Matteson — top-decile yield for the area; either an underpriced asset or a hidden risk that comps aren't pricing in. Stress-test before assuming the spread holds.
Location & tenants
- Location reads 67/100 on livability (#525 in IL) — a middle-class / working-renter tenant base. Strengths: employment A+, housing A+, cost of living A; Watch: schools D+, amenities F, commute F.
- Rich Twp Hsd 227 (suburban): math 5% / reading 12% proficiency, ranked #577 of 620 in IL (top 93%) — low school quality limits family demand, transient renter base, plan for 1-2y turnover.
- Market conditions: 69 active listings in the ZIP; 4 comparable units currently listed for rent nearby; rentals leasing fast (median 8d on market — plan ~1-2 weeks tenant-placement turnaround); 6,272 units permitted in Cook County in 2024 (4,658 in 5+ unit buildings).
Forward outlook
- Local home prices are declining (-3.0%/yr); year-one equity from $961 of loan paydown is wiped out by about $4k of value loss. Plan a longer hold.
- At projected returns (-3.0% appreciation + 3.0% rent growth), your $39k cash investment doubles in ~5 years — after that, you're playing with house money.
Negotiation context
- Only 7 days on market — expect competitive offers; lowballing is unlikely to land.
- 7 sale attempts since 4y ago with the ask held roughly flat each time — persistent listings suggest the price (not the market) is what's stuck; bring a comps-based counter.
- Current owner paid $78k; list at $139k implies a 79% gain — meaningful room to come down on a strong offer.
Questions for the listing agent
- Built in 1974 — when were the roof, HVAC, electrical panel, plumbing, and water heater last replaced?
- What does the HOA fee cover, when was the last increase, and are there any pending special assessments or reserve-fund shortfalls?
- Any open or pending special assessments — roof, HVAC, plumbing, elevator, façade? What's the per-unit balance and payoff schedule, and is the seller paying it off at close or rolling it to the buyer?
- Is there a deadline driving the sale (1031 exchange, divorce, estate, relocation)? That informs how much negotiation room exists.
- Schools are D-rated, which usually means shorter tenancies and higher turnover. Who's the typical renter profile here, and what's been the actual vacancy rate?
- What's the average days-on-market for RENTAL listings here right now (not sales)? A rising rental-DOM trend means longer vacancies and softer asking-rent achievability than the comps imply.
- What's the recent tenant-quality profile in this submarket — average credit score on applications, eviction rate, late-payment / NSF rate, and stable-employment percentage? A property-management company in the area should have these aggregated.
- How much new apartment / multifamily construction is in the pipeline within 1–3 miles? Heavy new supply (>2% of stock underway) typically softens rents 12–24 months out; light construction supports rent growth.
Investment metrics
- 1% rule
- 2.00% ✓
- Cap rate
- 14.28%
- Cash-on-cash
- 28.54%
- DSCR
- 2.27
- GRM
- 4.2
CMA / ARV
No comps found within radius.
Projected returns pro-forma
-3.0% appreciation · 3.0% rent growth · sell at horizon
- IRR
- 22.9%
- Equity multiple
- 1.94×
- Total profit
- $36,667
- Equity at exit
- $20,725
- IRR
- 30.9%
- Equity multiple
- 3.80×
- Total profit
- $108,797
- Equity at exit
- $12,018
Cash invested: $38,920 (down + closing). Projections, not guarantees.
Landlord ↔ Tenant lean methodology
- Overall (STATE)
- 43 Moderately Tenant-Leaning
- State Illinois
- 43 Moderately Tenant-Leaning · D+7
- County
- — inherits STATE
- City
- — inherits STATE
ZIP-level market 60443
- Home prices YoY
- -32.6%
- Active inventory
- 69
- Price-to-rent
- 4.2×
Monthly cashflow live
- Estimated rent
- $2,784 medium interval (Pro) →
- Mortgage (P&I)
- −$729
- Tax from tax record
- −$289 /mo · $3,474/yr
- Insurance
- −$58
- HOA
- −$197
- Vacancy / Maint / Mgmt
- −$585
- Net cashflow
- $926
Break-even live
UW: 25.0% down · 7.5% · 30yr · 1.5% tax · 5.0% vac · 8.0% maint · 8.0% mgmt
Financing live
Cash to close
- Down payment
- $34,750
- Closing costs
- $4,170
- Reserves months
- —
- Total cash needed
- —
Loan-product check · same deal, 3 products live
Conventional
25% down · 7.5% · 30yr
- Down + closing
- —
- Monthly P&I
- —
- Monthly cashflow
- —
- DSCR
- —
- Eligible?
- —
Personal DTI + credit; lowest rate.
DSCR
20% down · 8.5% · 30yr
- Down + closing
- —
- Monthly P&I
- —
- Monthly cashflow
- —
- DSCR
- —
- Eligible?
- —
No personal income docs; deal must DSCR.
Hard money
10% down · 12.0% · 12mo
- Down + closing
- —
- Monthly P&I
- —
- Monthly cashflow
- —
- DSCR
- —
- Eligible?
- —
Short-term bridge; refi at stabilization.
Rent comps 4 comps
| Address | Beds | Baths | Sqft | Rent | $/sqft | DOM | Units | Dist |
|---|---|---|---|---|---|---|---|---|
| 5817 Allemong Dr Matteson, IL | 3.0 | 1.5 | 1350 | $2,500 | $1.85 | 7d | 1 | 0.40mi |
| 6024 Aspen Ln Matteson, IL | 3.0 | 2.0 | 1294 | $2,800 | $2.16 | 1d | 1 | 0.73mi |
| 4962 Bennett St Matteson, IL | 2.0–3.0 | 2.5 | 1341 | $3,120 | $2.33 | 1d | 7 | 0.73mi |
| 946 Harvard Ln Matteson, IL | 4.0 | 1.5 | 1247 | $2,990 | $2.40 | 24d | 1 | 1.00mi |
HOA detail condo
- Monthly dues
- $197 · $2,364/yr
- Likely covers
- water
- Assessments
- None detected in remarks — confirm with the listing agent.
Listing history 6 events
-
2026-06-18days on market $139,000 Active 7 DOM
-
2026-06-17days on market $139,000 Active 6 DOM
-
2026-06-16days on market $139,000 Active 5 DOM
-
2026-06-15days on market $139,000 Active 4 DOM
-
2026-06-13remarks 222-char remark
-
2026-06-13$139,000 Active 2 DOM
ⓘ Source: listings_history table (triggers on properties + properties_extension) + one-shot
backfill from property_details.listing_events for pre-trigger history.
Tax reassessment forecast IL · Partial reset (capped growth)
- Current annual tax
- $3,474 · $289/mo
- Projected year-2 tax
- $3,474 · $289/mo
- Expected delta
- $0/yr ($0/mo · 0.0%)
ⓘ Screening estimate from a state-policy table — verify with the county assessor before closing.
Climate risk First Street
- Flood 1/10 Low FEMA zone X (unshaded) · 0% chance over 30 yrs
- Wildfire 3/10 Moderate
- Heat 3/10 Moderate 7 d/yr ≥101°F today · 16 d/yr by 30 yrs out
- Wind 2/10 Low
- Air quality 2/10 Low 1 unhealthy d/yr today · 1 by 30 yrs out
Nearby sold comps map
Loading sold comps map…
Walkable amenities ~0.75 mi
Loading nearby amenities…
Taxation est. · year 1
- Rental income
- $33,403
- − Mortgage interest
- −$7,786
- − Property taxes
- −$3,474
- − Insurance
- −$695
- − Repairs & maintenance
- −$2,672
- − Management
- −$2,672
- − HOA
- −$2,364
- − Depreciation
- −$4,044
- Taxable income
- $9,696
- Est. tax owed @ 24.0%
- −$2,327
- After-tax cash flow
- $8,781/yr
For passive investors: Depreciation is non-cash, so a rental often shows a tax loss while cash-flowing — sheltering income. Rental losses are passive: they offset passive income freely, and up to $25,000/yr can offset ordinary (W-2) income if you actively participate and your MAGI is under $100k (phasing out to $0 by $150k); unused losses carry forward. On sale, claimed depreciation is recaptured at up to 25%, and gains may owe capital-gains tax (a 1031 exchange can defer both). Figures are a year-1 estimate at your 24.0% rate — not tax advice; consult a CPA.
Schools (NCES district)
- District
- Rich Twp Hsd 227
- NCES district ID
- 1733420
- Math proficiency
- 5% ▼ -3.00%
- Reading proficiency
- 12% ▬ 0.00%
- Median HH income
- $56,056
- Composite
- 8.93/100
- National rank
- #9885
- State rank
- #577 of 620 in IL
Livability — Matteson
- Score
- 67/100
- State rank
- #525
- US rank
- #10883
Category grades
Schools grade is shown separately in the Schools card above.
Census & demographics
- Census place
- Matteson, IL
- City population
- 20,606
- Population (ZIP)
- 20,606
Population outlook (Cook County) Hauer SSP2
- Today (2025)
- 5,347,519 people
- By 2030
- 5,357,703 · +0.2%
- By 2040
- 5,324,924 · -0.4%
- By 2050
- 5,230,762 · -2.2%
- By 2075
- 4,785,735 · -10.5%
- By 2100
- 4,188,836 · -21.7%
Race, ethnicity, and origin ACS 2023
- Neighborhood character
- Predominantly Black (72%)
- Race & ethnicity
- Black 72% White 18% Two or more races 6% Hispanic / Latino 5% Asian 1%
- Hispanic origin (detail)
- Mexican 4%
- Common ancestry
- Romanian 2%
- Foreign-born
- 4% · Canada
- Languages at home
- 94% English-only · Spanish 4%
Political lean MEDSL · Cook
- 2024 margin
- Solid D (+42.0) · D 70.4% · R 28.4% · Other 1.2%
- 2008→2024 swing
- -11.4pp toward R · 2008: 53.4pp · 2024: 42.0pp
- All cycles
- 2024: D+42.0 2020: D+50.3 2016: D+53.0 2012: D+49.4 2008: D+53.4
Not yet ingested
- Civics
- —
Market trends
- HPI YoY
- ▼ -89.68%
- Current HPI
- 185.4404
- Rent YoY
- —
- Metro
- —
- State GDP YoY
- ▲ 1.59%
- F500 in state
- 60
Industry mix (Fortune 500 HQ in IL)
| Industry | F500 HQs | Revenue |
|---|---|---|
| Insurance | 4 | $201B |
|
||
| Consumer Goods | 4 | $87B |
|
||
| Industrial Machinery | 3 | $64B |
|
||
| Healthcare | 2 | $55B |
|
||
| Retail / Pharmacy | 1 | $148B |
|
||
| Agriculture / Food | 1 | $86B |
|
||
Price history
+251.9% since first listed18 events — show timeline
- 2026-06-11 Listed $139,000 MRED as Distributed by MLS Grid
- 2022-09-14 Sold (Public Records) $77,500 Public Records
- 2022-07-30 Pending — MRED as Distributed by MLS Grid
- 2022-07-15 Price Changed — MRED as Distributed by MLS Grid
- 2022-06-29 Relisted — MRED as Distributed by MLS Grid
- 2022-06-23 Contingent — MRED as Distributed by MLS Grid
- 2022-06-10 Relisted — MRED as Distributed by MLS Grid
- 2022-06-03 Contingent — MRED as Distributed by MLS Grid
- 2022-05-24 Relisted — MRED as Distributed by MLS Grid
- 2022-05-18 Contingent — MRED as Distributed by MLS Grid
- 2022-05-13 Price Changed — MRED as Distributed by MLS Grid
- 2022-04-09 Listing Removed — MRED as Distributed by MLS Grid
- 2022-04-09 Listing Removed — MRED as Distributed by MLS Grid
- 2022-04-09 Listed — MRED as Distributed by MLS Grid
- 2022-04-09 Listed — MRED as Distributed by MLS Grid
- 2022-03-31 Listed — MRED as Distributed by MLS Grid
- 2006-08-30 Sold (Public Records) $94,500 Public Records
- 1995-06-30 Sold (Public Records) $39,500 Public Records
Property tax history
+8.0%/yrLatest (2023): $3,474 · +257.4% YoY. Source: county tax records.
Cash-flow waterfall
monthlySold comps — $/sqft
last 12 mo · ≤1 miLoading sold comps…