 Duplex
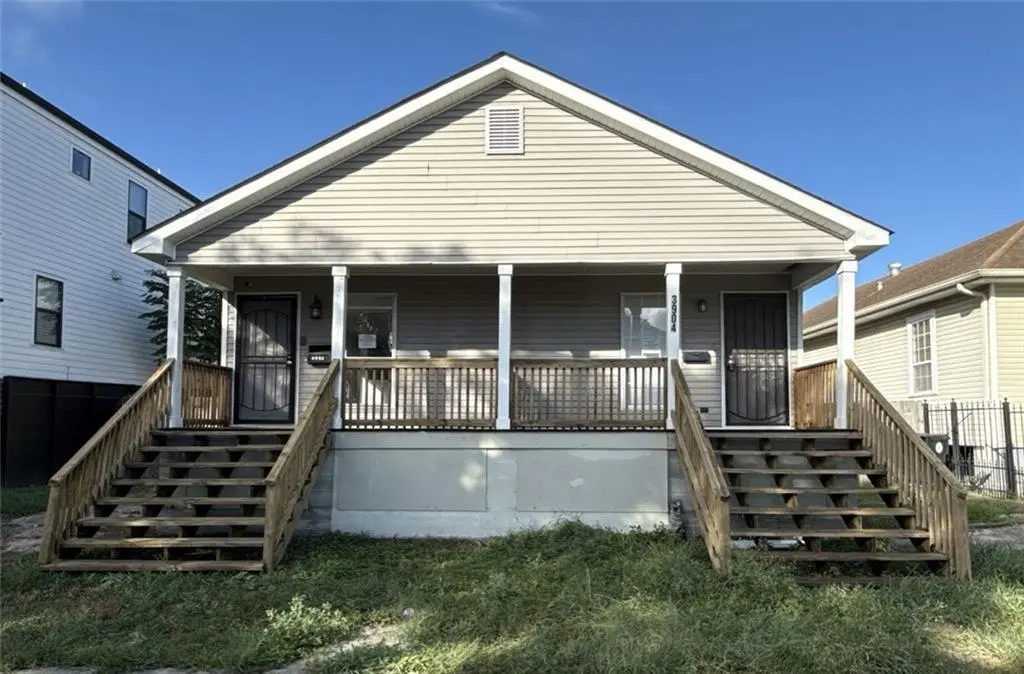
3902-04 Louisiana Avenue Pkwy · New Orleans, LA
Flood risk 9/10 · Severe
- FEMA flood zone
- AE
- Chance of flooding over 30 yrs
- 0.78%
- Est. flood insurance / yr
- $1,737 – $8,500
Fire risk 1/10 · Minimal
- Est. fire insurance / yr
- $1,269 – $2,357
Heat risk 10/10 · Severe
- Hot days now (above 108°F)
- 7 days/yr
- Hot days in 30 yrs
- 21 days/yr
Wind risk 10/10 · Severe
- Chance of severe wind over 30 yrs
- 99.0%
Air-quality risk 3/10 · Minor
- Unhealthy air days now
- 3 days/yr
- Unhealthy air days in 30 yrs
- 4 days/yr
Risk factors via First Street. Map © Google.
Why this score? — see what drove the B- grade
The composite is a weighted blend of 9 inputs, each scored 0–100. Each bar is that input's sub-score; the figure is the points it added to the 100-point composite (weight × sub-score).
- Cash flow +25.5/30.0
- ARV discount +15.0/15.0
- DSCR +8.4/10.0
- 1% rule +6.8/10.0
- Livability +4.0/5.0
- Rent growth +2.7/5.0
- Condition / age +2.5/5.0
- Schools +1.6/10.0
- Appreciation +0.0/10.0
$274,900
🖨 Deal sheet 📄 Offer letter ✓ Due diligence
Multi-family units
County records classify this as Multi-Family (2-4 Unit). Listing-text estimate: 2 units. confirmed
Listing remarks MLS
Great Location East Broadmoor area, around S Board, Washington just waiting for you. Don't let this opportunity pass you by. This Shotgun Camelback style duplex features Living room, kitchen 3 bedroom and 2 full baths. Each side has open living room and kitchen followed by laundry room, downstairs bathroom and 1 bedroom with outside yard access, upstairs features 2 bedroom with 1 full bath.
Key facts
- Open living room
- Outside yard access
- 4,499 sq ft lot
Tags
Neighborhood map
What this means for you Summary
Snapshot
- This is a 1×3bd/2ba + 1×2bd/1ba units multifamily listed at $275k.
Deal economics
- At list price, monthly cash flow is $213 ($3k/yr) — positive. Per door: $107/mo.
- The deal already cash-flows at list — no discount required.
- Meets the 1% rule at list price ($3k rent vs $275k).
- Recommended offer: $242k (12.0% below list) — sets the bar for market timing.
- Cap rate 9.1% vs local median 4.4% in New Orleans — top-decile yield for the area; either an underpriced asset or a hidden risk that comps aren't pricing in. Stress-test before assuming the spread holds.
Location & tenants
- Location reads 81/100 on livability (#3 in LA, #1,383 nationally) — a professional / high-income tenant draw. Strengths: amenities A+, commute A+, health & safety A+; Watch: crime C-, employment D.
- Orleans Parish (urban): math 11% / reading 27% proficiency, ranked #69 of 98 in LA (top 70%) — low school quality limits family demand, transient renter base, plan for 1-2y turnover; 68% free/reduced lunch — lower-income household profile, screen leases tightly.
- Market conditions: Rents flat; 217 active listings in the ZIP; 40 comparable units currently listed for rent nearby; rentals at typical pace (median 21d on market — plan ~3-4 weeks tenant-placement turnaround); 710 units permitted in Orleans Parish in 2024 (244 in 5+ unit buildings).
- At $3,248/mo this rent would consume 64% of the median local household income ($61k/yr) (locally 1270% of renters already pay >50% of income on rent) — very limited rent-growth headroom before tenants either downsize or default.
Forward outlook
- Local home prices are declining (-3.0%/yr); year-one equity from $2k of loan paydown is wiped out by about $8k of value loss. Plan a longer hold.
- Orleans County population projected at +61% by 2050 — long-run rental-demand tailwind backs the buy-and-hold thesis.
Negotiation context
- It's been on market 262 days — a 12% lower offer ($242k) is reasonable based on typical stale-listing flexibility.
- 2 sale attempts since 2y ago; this cycle's ask has dropped $45k (14%) from the opening price — seller is motivated, your offer sets the floor, not the list.
- Current owner paid $42k; list at $275k implies a 547% gain — meaningful room to come down on a strong offer.
Risks & watch-outs
- Watch-outs: flood insurance adds $427/mo; built in 1950 — expect roof / HVAC / electrical / plumbing capex.
- Climate carrying-cost: in FEMA flood zone AE (mandatory federal flood insurance); severe wind risk, 99% chance of damaging wind over 30y; extreme-heat days projected 7→21/yr by 2055 (HVAC capex compounding) — expect insurance premiums to compound above CPI over the hold.
Questions for the listing agent
- It's been on market 262 days. Have you received any prior offers? Is the seller open to a 12% concession, seller financing, or rate buy-down credit?
- Can we see the unit-by-unit rent roll, current vacancy, and any below-market leases? What's the average tenancy length?
- What capital expenditures (roof, boiler, parking lot, exteriors) have been made in the last 5 years, and what's planned in the next 2?
- Built in 1950 — when were the roof, HVAC, electrical panel, plumbing, and water heater last replaced?
- What's the actual annual flood-insurance premium (NFIP or private), and is the property in a SFHA with mandatory coverage?
- Why hasn't it sold? Are there any deal-killer items the seller is aware of (foundation, flood, title, zoning, code violations)?
- Is there a deadline driving the sale (1031 exchange, divorce, estate, relocation)? That informs how much negotiation room exists.
- What's the average days-on-market for RENTAL listings here right now (not sales)? A rising rental-DOM trend means longer vacancies and softer asking-rent achievability than the comps imply.
- What's the recent tenant-quality profile in this submarket — average credit score on applications, eviction rate, late-payment / NSF rate, and stable-employment percentage? A property-management company in the area should have these aggregated.
- How much new apartment / multifamily construction is in the pipeline within 1–3 miles? Heavy new supply (>2% of stock underway) typically softens rents 12–24 months out; light construction supports rent growth.
Investment metrics
- 1% rule
- 1.18% ✓
- Cap rate
- 9.08%
- Cash-on-cash
- 9.97%
- DSCR
- 1.44
- GRM
- 7.1
CMA / ARV
- ARV (median comp)
- $356,951
- List price
- $274,900
- Delta
- -22.99%
- Verdict
- UNDERPRICED
- Comps
- 20 within 1.0 mi
Show comp detail 12 sales within ~0.75 mi
| Address | Dist | Beds/Ba | Sqft | Sold | Price | $/sf | Match |
|---|---|---|---|---|---|---|---|
| 3619-25 Delachaise St | 0.17mi | 4/4.0 | 2,162 (+8%) | 7mo | $315,000 | $146 | 74 |
| 2232-34 S Salcedo St | 0.37mi | 4/2.0 | 2,108 (+5%) | 1mo | $391,237 | $186 | 74 |
| 4325 27 Jena St | 0.38mi | 4/2.0 | 2,149 (+7%) | 3mo | $307,500 | $143 | 69 |
| 3235 37 Vincennes Pl | 0.54mi | 4/2.0 | 2,072 (+3%) | 1mo | $150,000 | $72 | 68 |
| 4325-27 Jena St | 0.40mi | —/— | 2,149 (+7%) | 3mo | $307,500 | $143 | 68 |
| 6204 S Rocheblave St | 0.68mi | 4/4.0 | 2,000 (-0%) | 0mo | $402,500 | $201 | 67 |
| 6208 S Rocheblave St | 0.69mi | 4/4.0 | 2,000 (-0%) | 0mo | $402,500 | $201 | 67 |
| 2712 14 S Johnson St | 0.35mi | 4/4.0 | 1,870 (-7%) | 6mo | $246,200 | $132 | 67 |
| 1505 07 S White St | 0.25mi | 5/2.0 | 2,268 (+13%) | 3mo | $144,900 | $64 | 64 |
| 3235-37 Vincennes Pl | 0.64mi | —/— | 2,072 (+3%) | 1mo | $150,000 | $72 | 64 |
| 3020 22 Gen Taylor St | 0.54mi | 4/2.0 | 1,717 (-15%) | 6mo | $190,000 | $111 | 45 |
| 3721 23 Willow St | 0.66mi | 6/2.0 | 2,281 (+14%) | 3mo | $117,000 | $51 | 45 |
Match score weights: distance 35% · size 25% · config 20% · recency 20%. Top-matched comps best support the ARV.
Projected returns pro-forma
-3.0% appreciation · 0.73% rent growth · sell at horizon
- IRR
- -14.1%
- Equity multiple
- 0.51×
- Total profit
- $-37,904
- Equity at exit
- $40,988
- IRR
- -10.4%
- Equity multiple
- 0.45×
- Total profit
- $-42,648
- Equity at exit
- $23,768
Cash invested: $76,972 (down + closing). Projections, not guarantees.
Landlord ↔ Tenant lean methodology
- Overall (STATE)
- 90 Strongly Landlord-Friendly
- State Louisiana
- 90 Strongly Landlord-Friendly · R+12
- County
- — inherits STATE
- City
- — inherits STATE
ZIP-level market 70125
- Home prices YoY
- -16.3%
- Rents YoY
- 0.7%
- Active inventory
- 217
- Price-to-rent
- 13.7×
Monthly cashflow live
- Estimated rent
- $3,248 high interval (Pro) →
- Mortgage (P&I)
- −$1,442
- Tax from tax record
- −$370 /mo · $4,442/yr
- Insurance
- −$115
- Flood insurance flood zone
- −$427 /mo · $5,118/yr
- HOA
- −$0
- Vacancy / Maint / Mgmt
- −$682
- Net cashflow
- $213
Break-even live
2-unit breakdown (identical units grouped — click to expand)
| Units | Beds | Baths | Est. rent |
|---|---|---|---|
| 1× unit | 3 | 2 | $1,675 |
| 1× unit | 2 | 1 | $1,573 |
| Total (2 units) | $3,248 | ||
UW: 25.0% down · 7.5% · 30yr · 1.5% tax · 5.0% vac · 8.0% maint · 8.0% mgmt
Financing live
Cash to close
- Down payment
- $68,725
- Closing costs
- $8,247
- Reserves months
- —
- Total cash needed
- —
Loan-product check · same deal, 3 products live
Conventional
25% down · 7.5% · 30yr
- Down + closing
- —
- Monthly P&I
- —
- Monthly cashflow
- —
- DSCR
- —
- Eligible?
- —
Personal DTI + credit; lowest rate.
DSCR
20% down · 8.5% · 30yr
- Down + closing
- —
- Monthly P&I
- —
- Monthly cashflow
- —
- DSCR
- —
- Eligible?
- —
No personal income docs; deal must DSCR.
Hard money
10% down · 12.0% · 12mo
- Down + closing
- —
- Monthly P&I
- —
- Monthly cashflow
- —
- DSCR
- —
- Eligible?
- —
Short-term bridge; refi at stabilization.
Rent comps 40 comps
| Address | Beds | Baths | Sqft | Rent | $/sqft | DOM | Units | Dist |
|---|---|---|---|---|---|---|---|---|
| 2606 S Miro St New Orleans, LA | 3.0 | 2.0 | 1450 | $2,016 | $1.39 | 23d | 1 | 0.28mi |
| 2617 S Johnson St New Orleans, LA | 2.0 | 1.0 | 1500 | $1,300 | $0.87 | 23d | 1 | 0.35mi |
| 4400 Elba St New Orleans, LA | 3.0 | 2.0 | 1600 | $1,875 | $1.17 | 23d | 1 | 0.36mi |
| 4403 Elba St New Orleans, LA | 3.0 | 2.0 | 1400 | $1,800 | $1.29 | 3d | 1 | 0.36mi |
| 4401 Elba St New Orleans, LA | 3.0 | 2.0 | 1400 | $1,850 | $1.32 | 23d | 1 | 0.36mi |
| 4500 S Miro St Unit B New Orleans, LA | 2.0 | 1.0 | 1500 | $2,000 | $1.33 | 23d | 1 | 0.36mi |
| 2614 S Johnson St New Orleans, LA | 3.0 | 2.0 | 1536 | $2,079 | $1.35 | 14d | 1 | 0.38mi |
| 3636 Upperline St New Orleans, LA | 3.0 | 1.0 | 1600 | $1,975 | $1.23 | 23d | 1 | 0.38mi |
| 4603 S Miro St New Orleans, LA | 3.0 | 2.0 | 1650 | $1,650 | $1.00 | 23d | 1 | 0.40mi |
| 4120 Erato St New Orleans, LA | 3.0 | 2.0 | 2250 | $1,750 | $0.78 | 23d | 1 | 0.41mi |
| 3350 Jena St New Orleans, LA | 3.0 | 2.5 | 2200 | $2,500 | $1.14 | 43d | 1 | 0.44mi |
| 4027 S Derbigny St New Orleans, LA | 3.0 | 2.0 | 2950 | $1,950 | $0.66 | 23d | 1 | 0.49mi |
| 2833 S Derbigny St New Orleans, LA | 3.0 | 2.0 | 1500 | $1,795 | $1.20 | 23d | 1 | 0.49mi |
| 3044 Louisiana Avenue Pkwy New Orleans, LA | 3.0 | 2.0 | 1800 | $1,900 | $1.06 | 23d | 1 | 0.50mi |
| 3035 Delachaise St New Orleans, LA | 3.0 | 1.0 | 1968 | $1,750 | $0.89 | 1d | 1 | 0.51mi |
| 4117 State Street Dr New Orleans, LA | 3.0 | 1.0 | 1678 | $1,550 | $0.92 | 11d | 1 | 0.59mi |
| 3114 Cadiz St New Orleans, LA | 2.0 | 2.0 | 1500 | $2,500 | $1.67 | 23d | 1 | 0.60mi |
| 3816 State Street Dr New Orleans, LA | 2.0 | 2.0 | 2828 | $2,250 | $0.80 | 15d | 1 | 0.60mi |
| 5417 S Johnson St New Orleans, LA | 3.0 | 3.0 | 1739 | $2,900 | $1.67 | 17d | 1 | 0.63mi |
| 3180 State Street Dr New Orleans, LA | 3.0 | 2.0 | 1600 | $1,900 | $1.19 | 10d | 1 | 0.69mi |
| 3429 Clara St New Orleans, LA | 3.0 | 2.0 | 1620 | $2,350 | $1.45 | 14d | 1 | 0.71mi |
| 2921 Audubon St New Orleans, LA | 2.0 | 1.0 | 1500 | $1,550 | $1.03 | 17d | 1 | 0.76mi |
| 2717 Milan St New Orleans, LA | 3.0 | 1.5 | 1850 | $1,650 | $0.89 | 14d | 1 | 0.77mi |
| 2338 Audubon St New Orleans, LA | 3.0 | 2.0 | 1935 | $2,000 | $1.03 | 3d | 1 | 0.84mi |
| 2702 Felicity St Unit 4 New Orleans, LA | 1.0 | 1.0 | 1734 | $825 | $0.48 | 3d | 1 | 0.87mi |
| 2651 Poydras St New Orleans, LA | 1.0–4.0 | 1.0–2.0 | 1095 | $1,732 | $1.58 | 1d | 16 | 0.87mi |
| 2838 Palmer Ave New Orleans, LA | 3.0 | 1.5 | 1500 | $2,000 | $1.33 | 17d | 1 | 0.88mi |
| 2834 Palmer Ave New Orleans, LA | 3.0 | 2.0 | 1533 | $2,800 | $1.83 | 17d | 1 | 0.88mi |
| 2814 Palmer Ave New Orleans, LA | 3.0 | 2.0 | 1500 | $2,400 | $1.60 | 17d | 1 | 0.90mi |
| 2211 Broadway St New Orleans, LA | 1.0 | 1.0 | 1764 | $1,000 | $0.57 | 17d | 1 | 0.91mi |
| 2203 Broadway St New Orleans, LA | 3.0 | 2.0 | 1491 | $3,000 | $2.01 | 21d | 1 | 0.92mi |
| 2824 Calhoun St Unit A New Orleans, LA | 3.0 | 2.0 | 1828 | $3,900 | $2.13 | 43d | 1 | 0.92mi |
| 1407 Magnolia St New Orleans, LA | 3.0 | 2.0 | 1824 | $1,500 | $0.82 | 23d | 1 | 0.95mi |
| 2427 Soniat St New Orleans, LA | 3.0 | 2.0 | 1500 | $2,750 | $1.83 | 17d | 1 | 0.97mi |
| 2425 Soniat St New Orleans, LA | 3.0 | 2.5 | 1500 | $2,850 | $1.90 | 11d | 1 | 0.97mi |
| 5422 Clara St New Orleans, LA | 2.0 | 1.5 | 1690 | $2,100 | $1.24 | 23d | 1 | 0.98mi |
| 2520 Jefferson Ave New Orleans, LA | 2.0 | 1.0 | 1500 | $1,800 | $1.20 | 23d | 1 | 0.99mi |
| 5830 Willow St New Orleans, LA | 3.0 | 3.5 | 1400 | $2,500 | $1.79 | 21d | 1 | 1.02mi |
| 5838 Willow St New Orleans, LA | 3.0 | 3.0 | 1400 | $2,500 | $1.79 | 43d | 1 | 1.03mi |
| 2429 Octavia St New Orleans, LA | 3.0 | 2.0 | 1640 | $2,350 | $1.43 | 23d | 1 | 1.04mi |
Listing history 24 events
-
2026-06-18days on market $274,900 Active 262 DOM
-
2026-06-17days on market $274,900 Active 261 DOM
-
2026-06-16days on market $274,900 Active 260 DOM
-
2026-06-15days on market $274,900 Active 259 DOM
-
2026-06-13days on market $274,900 Active 257 DOM
-
2026-06-10days on market $274,900 Active 254 DOM
-
2026-06-09days on market $274,900 Active 253 DOM
-
2026-06-08days on market $274,900 Active 252 DOM
-
2026-06-05days on market $274,900 Active 251 DOM
-
2026-06-03days on market $274,900 Active 250 DOM
-
2026-06-02days on market $274,900 Active 249 DOM
-
2026-06-01days on market $274,900 Active 248 DOM
-
2026-05-31days on market $274,900 Active 247 DOM
-
2026-05-16price $274,900 393-char remark
Show marketing remark (393 chars)
Great Location East Broadmoor area, around S Board, Washington just waiting for you. Don't let this opportunity pass you by. This Shotgun Camelback style duplex features Living room, kitchen 3 bedroom and 2 full baths. Each side has open living room and kitchen followed by laundry room, downstairs bathroom and 1 bedroom with outside yard access, upstairs features 2 bedroom with 1 full bath.
-
2026-03-17price $284,900 393-char remark
Show marketing remark (393 chars)
Great Location East Broadmoor area, around S Board, Washington just waiting for you. Don't let this opportunity pass you by. This Shotgun Camelback style duplex features Living room, kitchen 3 bedroom and 2 full baths. Each side has open living room and kitchen followed by laundry room, downstairs bathroom and 1 bedroom with outside yard access, upstairs features 2 bedroom with 1 full bath.
-
2026-02-21price $294,900 393-char remark
Show marketing remark (393 chars)
Great Location East Broadmoor area, around S Board, Washington just waiting for you. Don't let this opportunity pass you by. This Shotgun Camelback style duplex features Living room, kitchen 3 bedroom and 2 full baths. Each side has open living room and kitchen followed by laundry room, downstairs bathroom and 1 bedroom with outside yard access, upstairs features 2 bedroom with 1 full bath.
-
2025-12-23price $299,900 393-char remark
Show marketing remark (393 chars)
Great Location East Broadmoor area, around S Board, Washington just waiting for you. Don't let this opportunity pass you by. This Shotgun Camelback style duplex features Living room, kitchen 3 bedroom and 2 full baths. Each side has open living room and kitchen followed by laundry room, downstairs bathroom and 1 bedroom with outside yard access, upstairs features 2 bedroom with 1 full bath.
-
2025-12-23price $262,500 393-char remark
Show marketing remark (393 chars)
Great Location East Broadmoor area, around S Board, Washington just waiting for you. Don't let this opportunity pass you by. This Shotgun Camelback style duplex features Living room, kitchen 3 bedroom and 2 full baths. Each side has open living room and kitchen followed by laundry room, downstairs bathroom and 1 bedroom with outside yard access, upstairs features 2 bedroom with 1 full bath.
-
2025-11-12price $299,900 393-char remark
Show marketing remark (393 chars)
Great Location East Broadmoor area, around S Board, Washington just waiting for you. Don't let this opportunity pass you by. This Shotgun Camelback style duplex features Living room, kitchen 3 bedroom and 2 full baths. Each side has open living room and kitchen followed by laundry room, downstairs bathroom and 1 bedroom with outside yard access, upstairs features 2 bedroom with 1 full bath.
-
2025-09-25$319,900 Active 393-char remark
Show marketing remark (393 chars)
Great Location East Broadmoor area, around S Board, Washington just waiting for you. Don't let this opportunity pass you by. This Shotgun Camelback style duplex features Living room, kitchen 3 bedroom and 2 full baths. Each side has open living room and kitchen followed by laundry room, downstairs bathroom and 1 bedroom with outside yard access, upstairs features 2 bedroom with 1 full bath.
-
2025-01-16price $299,000
-
2024-12-05price $319,000
-
2024-11-06$338,000 Active
-
1977-10-05soldstatus $42,500
ⓘ Source: listings_history table (triggers on properties + properties_extension) + one-shot
backfill from property_details.listing_events for pre-trigger history.
Tax reassessment forecast LA · Resets to sale price
- Current annual tax
- $4,442 · $370/mo
- Projected year-2 tax
- $4,442 · $370/mo
- Expected delta
- $0/yr ($0/mo · 0.0%)
ⓘ Screening estimate from a state-policy table — verify with the county assessor before closing.
Climate risk First Street
- Flood 9/10 Extreme FEMA zone AE · 78% chance over 30 yrs
- Wildfire 1/10 Low
- Heat 10/10 Extreme 7 d/yr ≥108°F today · 21 d/yr by 30 yrs out
- Wind 10/10 Extreme 99% chance of damaging wind over 30 yrs
- Air quality 3/10 Moderate 3 unhealthy d/yr today · 4 by 30 yrs out
Nearby sold comps map
Loading sold comps map…
Walkable amenities ~0.75 mi
Loading nearby amenities…
Taxation est. · year 1
- Rental income
- $38,976
- − Mortgage interest
- −$15,399
- − Property taxes
- −$4,442
- − Insurance
- −$6,493
- − Repairs & maintenance
- −$3,118
- − Management
- −$3,118
- − Depreciation
- −$7,997
- Taxable loss
- −$1,591
- Est. tax savings @ 24.0%
- +$382
- After-tax cash flow
- $2,938/yr
For passive investors: Depreciation is non-cash, so a rental often shows a tax loss while cash-flowing — sheltering income. Rental losses are passive: they offset passive income freely, and up to $25,000/yr can offset ordinary (W-2) income if you actively participate and your MAGI is under $100k (phasing out to $0 by $150k); unused losses carry forward. On sale, claimed depreciation is recaptured at up to 25%, and gains may owe capital-gains tax (a 1031 exchange can defer both). Figures are a year-1 estimate at your 24.0% rate — not tax advice; consult a CPA.
Schools (NCES district)
- District
- Orleans Parish
- NCES district ID
- 2201170
- Math proficiency
- 11% ▼ -52.00%
- Reading proficiency
- 27% ▼ -46.00%
- Median HH income
- $37,011
- Composite
- 15.78/100
- National rank
- #9271
- State rank
- #69 of 98 in LA
Livability — New Orleans
- Score
- 81/100
- State rank
- #3
- US rank
- #1383
Category grades
Schools grade is shown separately in the Schools card above.
Census & demographics
- Census place
- New Orleans, LA
- County
- Orleans Parish · 338,817 people
- City population
- 338,817
- Metro
- New Orleans-Metairie, LA
- Population (ZIP)
- 17,821
- Household income
- $61,174
- Rent vs Own
- Severe rent burden
- 1270.0
Population outlook (Orleans County) Hauer SSP2
- Today (2025)
- 513,025 people
- By 2030
- 575,781 · +12.2%
- By 2040
- 700,174 · +36.5%
- By 2050
- 826,541 · +61.1%
- By 2075
- 1,123,374 · +119.0%
- By 2100
- 1,355,609 · +164.2%
Race, ethnicity, and origin ACS 2023
- Neighborhood character
- Diverse neighborhood (Simpson 0.63)
- Race & ethnicity
- Black 51% White 32% Hispanic / Latino 9% Two or more races 9% Asian 2% Native American 1%
- Hispanic origin (detail)
- Mexican 2%
- Common ancestry
- Lithuanian 8% Romanian 1% Slovak 1%
- Foreign-born
- 7% · Canada, China
- Languages at home
- 90% English-only · Spanish 6% French/Haitian/Cajun 1% Chinese 1%
Political lean MEDSL · Orleans
- 2024 margin
- Solid D (+67.0) · D 82.2% · R 15.2% · Other 2.7%
- 2008→2024 swing
- +6.7pp toward D · 2008: 60.3pp · 2024: 67.0pp
- All cycles
- 2024: D+67.0 2020: D+68.2 2016: D+66.2 2012: D+62.5 2008: D+60.3
Not yet ingested
- Civics
- —
Market trends
- HPI YoY
- ▼ -49.68%
- Current HPI
- 255.5998
- Rent YoY
- ▲ 0.73%
- Metro
- New Orleans-Metairie, LA
- State GDP YoY
- ▲ 3.29%
- F500 in state
- 10
Industry mix (Fortune 500 HQ in LA)
| Industry | F500 HQs | Revenue |
|---|---|---|
| Telecommunications | 2 | $23B |
|
||
| Utilities | 1 | $12B |
|
||
| Wholesale / Distribution | 1 | $5B |
|
||
| Advertising | 1 | $2B |
|
||
Price history
+546.8% since first listed11 events — show timeline
- 2026-05-16 Price Changed $274,900 AcadianaMLS
- 2026-03-17 Price Changed $284,900 AcadianaMLS
- 2026-02-21 Price Changed $294,900 AcadianaMLS
- 2025-12-23 Price Changed $299,900 AcadianaMLS
- 2025-12-23 Price Changed $262,500 AcadianaMLS
- 2025-11-12 Price Changed $299,900 AcadianaMLS
- 2025-09-25 Listed $319,900 AcadianaMLS
- 2025-01-16 Price Changed $299,000 AcadianaMLS
- 2024-12-05 Price Changed $319,000 AcadianaMLS
- 2024-11-06 Listed $338,000 AcadianaMLS
- 1977-10-05 Sold (Public Records) $42,500 Public Records
Property tax history
+6.4%/yrLatest (2026): $4,442 · +2.8% YoY. Source: county tax records.
Cash-flow waterfall
monthlySold comps — $/sqft
last 12 mo · ≤1 miLoading sold comps…