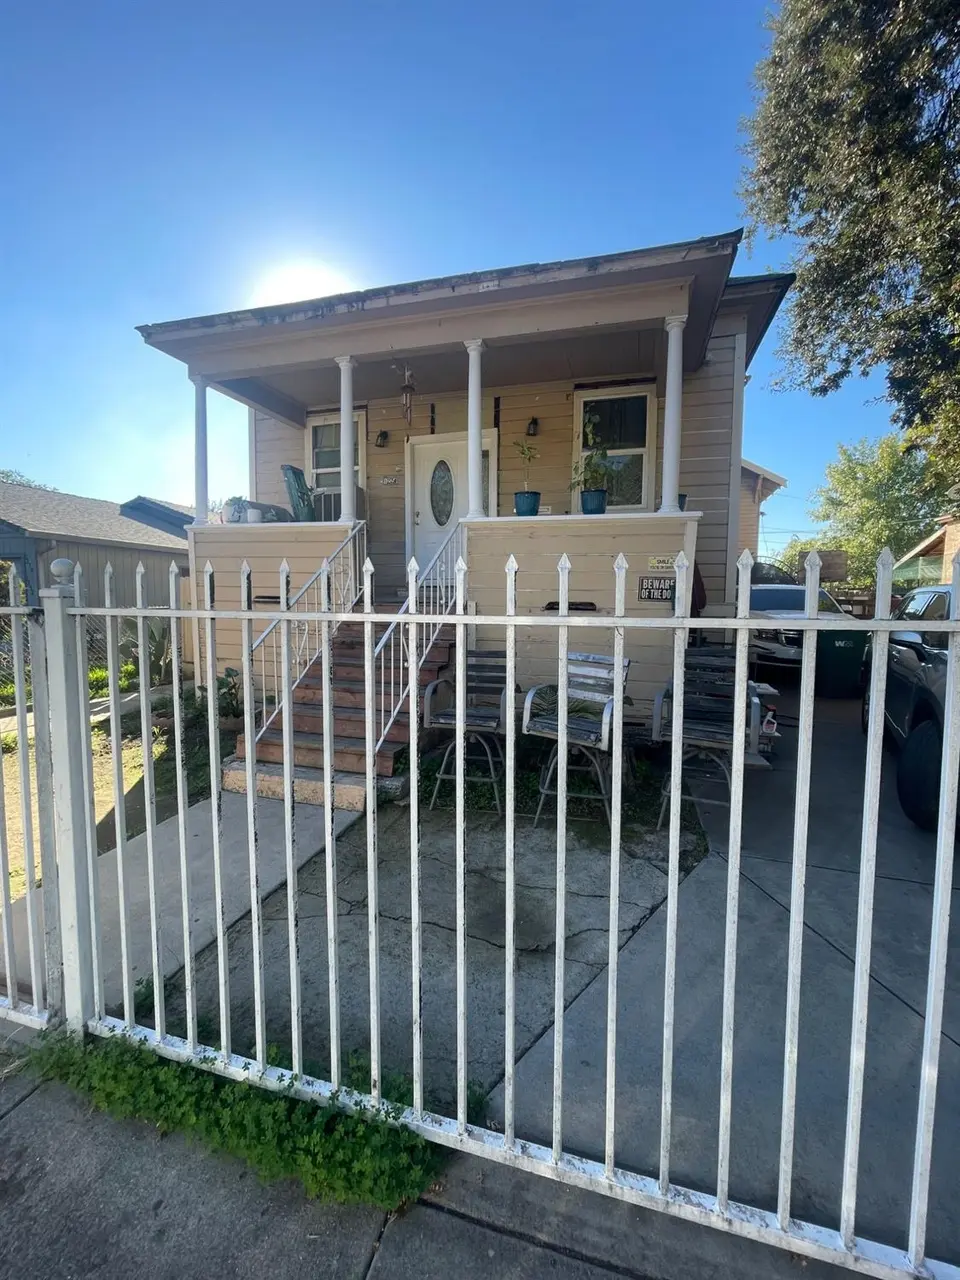
1224 E Lafayette St · Stockton, CA
Flood risk 7/10 · Major
- FEMA flood zone
- X
- Chance of flooding over 30 yrs
- 0.76%
- Est. flood insurance / yr
- $507 – $1,088
Fire risk 1/10 · Minimal
- Est. fire insurance / yr
- $659 – $1,223
Heat risk 7/10 · Major
- Hot days now (above 103°F)
- 7 days/yr
- Hot days in 30 yrs
- 15 days/yr
Wind risk 1/10 · Minimal
- Chance of severe wind over 30 yrs
- —
Air-quality risk 10/10 · Severe
- Unhealthy air days now
- 30 days/yr
- Unhealthy air days in 30 yrs
- 30 days/yr
Risk factors via First Street. Map © Google.
Why this score? — see what drove the D grade
The composite is a weighted blend of 9 inputs, each scored 0–100. Each bar is that input's sub-score; the figure is the points it added to the 100-point composite (weight × sub-score).
- Cash flow +13.3/30.0
- ARV discount +12.7/15.0
- DSCR +4.0/10.0
- 1% rule +2.9/10.0
- Schools +2.9/10.0
- Livability +2.9/5.0
- Rent growth +2.5/5.0
- Condition / age +2.5/5.0
- Appreciation +0.0/10.0
$309,999
🖨 Deal sheet 📄 Offer letter ✓ Due diligence
Listing remarks
THIS IS THE OLDEST HOME I HAVE EVER LISTED! BUILT IN 1888 ! Nice character, Older wooden porch and wood exterior. Garage has been converted to a possible living area with kitchen/bath possibilities. Basement. This family has given the interior nice touches, some windows have been replaced and walls have been sheet rocked plus granite counter tops in kitchen and inside laundry area. Living areas are roomy. Tidy interior. Back yard has room for creative ideas patio and garden areas nice sunlight, side yard can be used for extra off street parking . This home will need some exterior refinishing and painting. A lot of possibilities. Need a roomy home, fenced grounds, close to shopping area
Key facts
- Wooden porch
- Converted garage
- Granite counter tops
Tags
Neighborhood map
What this means for you Summary
Snapshot
- This is a 4-bed/1.5-bath single-family listed at $310k.
Deal economics
- At list price, monthly cash flow is $-65 ($-776/yr) — negative.
- To cash-flow at today's rent, offer at most $299k (3.7% below list).
- To meet the 1% rule (rent ≥ 1% of price), the offer needs to be $244k (21.3% below list).
- Recommended offer: $244k (21.3% below list) — sets the bar for 1% rule.
- Cap rate 6.3% vs local median 3.6% in Stockton — top-decile yield for the area; either an underpriced asset or a hidden risk that comps aren't pricing in. Stress-test before assuming the spread holds.
Location & tenants
- Location reads 57/100 on livability (#734 in CA) — a working-class tenant base; expect higher turnover. Strengths: housing A+, health & safety A, amenities A-; Watch: employment C-, schools D-, crime F.
- Stockton Unified (urban): math 23% / reading 46% proficiency, ranked #295 of 517 in CA (top 57%) — families likely to look elsewhere, expect single-tenant / working-renter base with shorter leases; 78% free/reduced lunch — lower-income household profile, screen leases tightly.
- Market conditions: 84 active listings in the ZIP; 2 comparable units currently listed for rent nearby; 3,779 units permitted in San Joaquin County in 2024 (0 in 5+ unit buildings).
- At $2,439/mo this rent would consume 49% of the median local household income ($60k/yr) (locally 1712% of renters already pay >50% of income on rent) — very limited rent-growth headroom before tenants either downsize or default.
Forward outlook
- Local home prices are declining (-3.0%/yr); year-one equity from $2k of loan paydown is wiped out by about $9k of value loss. Plan a longer hold.
- San Joaquin County population projected at +17% by 2050 — long-run rental-demand tailwind backs the buy-and-hold thesis.
Negotiation context
- It's been on market 317 days — a 12% lower offer ($273k) is reasonable based on typical stale-listing flexibility.
Risks & watch-outs
- Watch-outs: flood insurance adds $66/mo; built in 1888 — expect roof / HVAC / electrical / plumbing capex.
- Climate carrying-cost: major flood risk; extreme-heat days projected 7→15/yr by 2055 (HVAC capex compounding) — expect insurance premiums to compound above CPI over the hold.
Questions for the listing agent
- What do current leases actually rent for vs. the listed asking? Can we see a recent rent roll and the last 12 months of T-12 income?
- It's been on market 317 days. Have you received any prior offers? Is the seller open to a 21% concession, seller financing, or rate buy-down credit?
- Built in 1888 — when were the roof, HVAC, electrical panel, plumbing, and water heater last replaced?
- What's the actual annual flood-insurance premium (NFIP or private), and is the property in a SFHA with mandatory coverage?
- Why hasn't it sold? Are there any deal-killer items the seller is aware of (foundation, flood, title, zoning, code violations)?
- Is there a deadline driving the sale (1031 exchange, divorce, estate, relocation)? That informs how much negotiation room exists.
- Schools are D-rated, which usually means shorter tenancies and higher turnover. Who's the typical renter profile here, and what's been the actual vacancy rate?
- Crime grade is F in this area — have there been break-ins, vandalism, or insurance claims at this property in the last 3 years? What carrier currently insures it and at what premium?
- The area grade is low — what's the realistic commute time and amenity access for the typical tenant pool here? Any planned neighborhood developments (good or bad) we should know about?
- What's the average days-on-market for RENTAL listings here right now (not sales)? A rising rental-DOM trend means longer vacancies and softer asking-rent achievability than the comps imply.
- What's the recent tenant-quality profile in this submarket — average credit score on applications, eviction rate, late-payment / NSF rate, and stable-employment percentage? A property-management company in the area should have these aggregated.
- How much new for-sale + rental construction is in the pipeline within 1–3 miles? Heavy new supply typically softens prices + rents 12–24 months out; constrained supply supports both.
Investment metrics
- 1% rule
- 0.79% ✗
- Cap rate
- 6.30%
- Cash-on-cash
- 0.02%
- DSCR
- 1.00
- GRM
- 10.6
CMA / ARV
- ARV (median comp)
- $350,226
- List price
- $309,999
- Delta
- -11.49%
- Verdict
- UNDERPRICED
- Comps
- 20 within 1.0 mi
Show comp detail 12 sales within ~0.75 mi
| Address | Dist | Beds/Ba | Sqft | Sold | Price | $/sf | Match |
|---|---|---|---|---|---|---|---|
| 709 E Sonora St | 0.38mi | 3/1.0 (-1) | 1,247 (-9%) | 2mo | $340,000 | $273 | 58 |
| 748 E Worth St | 0.54mi | 4/2.0 | 1,292 (-6%) | 9mo | $335,000 | $259 | 56 |
| 328 Florence | 0.63mi | 3/2.0 (-1) | 1,460 (+6%) | 8mo | $360,000 | $247 | 46 |
| 610 E Anderson St | 0.66mi | 4/2.0 | 1,450 (+6%) | 15mo | $368,000 | $254 | 46 |
| 1835 E Anderson St | 0.66mi | 3/2.0 (-1) | 1,235 (-10%) | 1mo | $270,000 | $219 | 45 |
| 422 E Sonora St | 0.59mi | 3/2.0 (-1) | 1,552 (+13%) | 1mo | $349,000 | $225 | 43 |
| 322 E Sonora St | 0.66mi | 4/2.0 | 1,519 (+11%) | 8mo | $310,000 | $204 | 43 |
| 2030 E Lafayette St | 0.64mi | 3/2.0 (-1) | 1,200 (-12%) | 0mo | $395,000 | $329 | 42 |
| 1404 E Park St | 0.71mi | 5/2.0 (+1) | 1,233 (-10%) | 4mo | $315,000 | $255 | 40 |
| 1418 E Lindsay St | 0.51mi | 4/2.0 | 1,183 (-14%) | 14mo | $360,000 | $304 | 40 |
| 2075 E Myrtle St | 0.71mi | 4/2.0 | 1,169 (-15%) | 6mo | $325,000 | $278 | 35 |
| 702 E Oak St | 0.74mi | 3/1.0 (-1) | 1,222 (-11%) | 9mo | $165,000 | $135 | 32 |
Match score weights: distance 35% · size 25% · config 20% · recency 20%. Top-matched comps best support the ARV.
Projected returns pro-forma
-3.0% appreciation · 3.0% rent growth · sell at horizon
- IRR
- -17.8%
- Equity multiple
- 0.37×
- Total profit
- $-54,408
- Equity at exit
- $46,222
- IRR
- -10.0%
- Equity multiple
- 0.39×
- Total profit
- $-52,907
- Equity at exit
- $26,803
Cash invested: $86,800 (down + closing). Projections, not guarantees.
Landlord ↔ Tenant lean methodology
- Overall (STATE)
- 18 Strongly Tenant-Friendly
- State California
- 18 Strongly Tenant-Friendly · D+13
- County
- — inherits STATE
- City
- — inherits STATE
ZIP-level market 95205
- Active inventory
- 84
- Price-to-rent
- 10.6×
Monthly cashflow live
- Estimated rent
- $2,439 medium interval (Pro) →
- Mortgage (P&I)
- −$1,626
- Tax from tax record
- −$171 /mo · $2,046/yr
- Insurance
- −$129
- Flood insurance flood zone
- −$66 /mo · $798/yr
- HOA
- −$0
- Vacancy / Maint / Mgmt
- −$512
- Net cashflow
- $-65
Break-even live
UW: 25.0% down · 7.5% · 30yr · 1.5% tax · 5.0% vac · 8.0% maint · 8.0% mgmt
Financing live
Cash to close
- Down payment
- $77,500
- Closing costs
- $9,300
- Reserves months
- —
- Total cash needed
- —
Loan-product check · same deal, 3 products live
Conventional
25% down · 7.5% · 30yr
- Down + closing
- —
- Monthly P&I
- —
- Monthly cashflow
- —
- DSCR
- —
- Eligible?
- —
Personal DTI + credit; lowest rate.
DSCR
20% down · 8.5% · 30yr
- Down + closing
- —
- Monthly P&I
- —
- Monthly cashflow
- —
- DSCR
- —
- Eligible?
- —
No personal income docs; deal must DSCR.
Hard money
10% down · 12.0% · 12mo
- Down + closing
- —
- Monthly P&I
- —
- Monthly cashflow
- —
- DSCR
- —
- Eligible?
- —
Short-term bridge; refi at stabilization.
Rent comps 2 comps
| Address | Beds | Baths | Sqft | Rent | $/sqft | DOM | Units | Dist |
|---|---|---|---|---|---|---|---|---|
| 2271 E Church St Stockton, CA | 3.0 | 1.5 | 1285 | $2,245 | $1.75 | 23d | 1 | 0.91mi |
| 1526 N Sierra Nevada St Stockton, CA | 3.0 | 2.0 | 1024 | $2,600 | $2.54 | 23d | 1 | 1.32mi |
Listing history 16 events
-
2026-06-18days on market $309,999 Active 317 DOM
-
2026-06-17days on market $309,999 Active 316 DOM
-
2026-06-16days on market $309,999 Active 315 DOM
-
2026-06-15days on market $309,999 Active 314 DOM
-
2026-06-14days on market $309,999 Active 312 DOM
-
2026-06-10days on market $309,999 Active 309 DOM
-
2026-06-09days on market $309,999 Active 308 DOM
-
2026-06-08days on market $309,999 Active 307 DOM
-
2026-06-07days on market $309,999 Active 306 DOM
-
2026-06-05days on market $309,999 Active 303 DOM
-
2026-06-03days on market $309,999 Active 302 DOM
-
2026-06-03days on market $309,999 Active 301 DOM
-
2026-06-01days on market $309,999 Active 300 DOM
-
2026-05-31days on market $309,999 Active 299 DOM
-
2005-05-31soldstatus $284,000
-
2003-01-31soldstatus $140,000
ⓘ Source: listings_history table (triggers on properties + properties_extension) + one-shot
backfill from property_details.listing_events for pre-trigger history.
Tax reassessment forecast CA · Resets to sale price
- Current annual tax
- $2,046 · $171/mo
- Projected year-2 tax
- $2,356 · $196/mo
- Expected delta
- +$310/yr (+$26/mo · 15.1%)
ⓘ Screening estimate from a state-policy table — verify with the county assessor before closing.
Climate risk First Street
- Flood 7/10 Severe FEMA zone X · 76% chance over 30 yrs
- Wildfire 1/10 Low
- Heat 7/10 Severe 7 d/yr ≥103°F today · 15 d/yr by 30 yrs out
- Wind 1/10 Low
- Air quality 10/10 Extreme 30 unhealthy d/yr today · 30 by 30 yrs out
Nearby sold comps map
Loading sold comps map…
Walkable amenities ~0.75 mi
Loading nearby amenities…
Taxation est. · year 1
- Rental income
- $29,273
- − Mortgage interest
- −$17,365
- − Property taxes
- −$2,046
- − Insurance
- −$2,347
- − Repairs & maintenance
- −$2,342
- − Management
- −$2,342
- − Depreciation
- −$9,018
- Taxable loss
- −$6,187
- Est. tax savings @ 24.0%
- +$1,485
- After-tax cash flow
- $709/yr
For passive investors: Depreciation is non-cash, so a rental often shows a tax loss while cash-flowing — sheltering income. Rental losses are passive: they offset passive income freely, and up to $25,000/yr can offset ordinary (W-2) income if you actively participate and your MAGI is under $100k (phasing out to $0 by $150k); unused losses carry forward. On sale, claimed depreciation is recaptured at up to 25%, and gains may owe capital-gains tax (a 1031 exchange can defer both). Figures are a year-1 estimate at your 24.0% rate — not tax advice; consult a CPA.
Schools (NCES district)
- District
- Stockton Unified
- NCES district ID
- 0638010
- Math proficiency
- 23% ▲ 2.00%
- Reading proficiency
- 46% ▲ 16.00%
- Median HH income
- $37,563
- Composite
- 28.65/100
- National rank
- #6701
- State rank
- #295 of 517 in CA
Livability — Stockton
- Score
- 57/100
- State rank
- #734
- US rank
- #21638
Category grades
Schools grade is shown separately in the Schools card above.
Census & demographics
- Census place
- Stockton, CA
- County
- San Joaquin County · 729,570 people
- City population
- 332,006
- Metro
- Stockton, CA
- Population (ZIP)
- 39,608
- Household income
- $60,325
- Rent vs Own
- Severe rent burden
- 1712.0
Population outlook (San Joaquin County) Hauer SSP2
- Today (2025)
- 796,965 people
- By 2030
- 828,849 · +4.0%
- By 2040
- 885,611 · +11.1%
- By 2050
- 929,798 · +16.7%
- By 2075
- 994,578 · +24.8%
- By 2100
- 971,291 · +21.9%
Race, ethnicity, and origin ACS 2023
- Neighborhood character
- Predominantly Hispanic (77%)
- Race & ethnicity
- Hispanic / Latino 77% Two or more races 21% White 9% Asian 6% Black 6% Native American 2%
- Hispanic origin (detail)
- Mexican 72%
- Foreign-born
- 33% · Canada
- Languages at home
- 36% English-only · Spanish 58% Tagalog/Filipino 2% Other Indo-European 2%
Political lean MEDSL · San Joaquin
- 2024 margin
- Toss-up / Even · D 48.0% · R 48.9% · Other 3.0%
- 2008→2024 swing
- -11.6pp toward R · 2008: 10.7pp · 2024: -0.9pp
- All cycles
- 2024: R+0.9 2020: D+13.9 2016: D+12.9 2012: D+8.9 2008: D+10.7
Not yet ingested
- Civics
- —
Market trends
- HPI YoY
- ▼ -298.45%
- Current HPI
- 502.8934
- Rent YoY
- —
- Metro
- Stockton, CA
- State GDP YoY
- ▲ 3.21%
- F500 in state
- 116
Industry mix (Fortune 500 HQ in CA)
| Industry | F500 HQs | Revenue |
|---|---|---|
| Technology | 27 | $1,492B |
|
||
| Financial Services | 3 | $174B |
|
||
| Retail | 3 | $44B |
|
||
| Insurance | 3 | $26B |
|
||
| Media / Entertainment | 2 | $115B |
|
||
| Pharmaceuticals / Biotech | 2 | $62B |
|
||
Price history
+102.9% since first listed2 events — show timeline
- 2005-05-31 Sold (Public Records) $284,000 Public Records
- 2003-01-31 Sold (Public Records) $140,000 Public Records
Property tax history
-1.1%/yrLatest (2025): $2,046 · +1.7% YoY. Source: county tax records.
Cash-flow waterfall
monthlySold comps — $/sqft
last 12 mo · ≤1 miLoading sold comps…