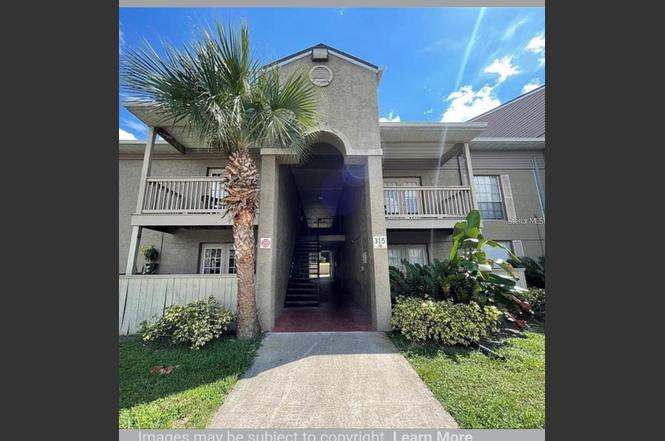
315 Wymore Rd #104 · Altamonte Springs, FL
Flood risk 4/10 · Minor
- FEMA flood zone
- X (unshaded)
- Chance of flooding over 30 yrs
- 0.24%
- Est. flood insurance / yr
- $507 – $1,088
Fire risk 1/10 · Minimal
- Est. fire insurance / yr
- $947 – $1,759
Heat risk 9/10 · Severe
- Hot days now (above 108°F)
- 7 days/yr
- Hot days in 30 yrs
- 23 days/yr
Wind risk 9/10 · Severe
- Chance of severe wind over 30 yrs
- 99.0%
Air-quality risk 2/10 · Minimal
- Unhealthy air days now
- 1 days/yr
- Unhealthy air days in 30 yrs
- 1 days/yr
Risk factors via First Street. Map © Google.
Why this score? — see what drove the D grade
The composite is a weighted blend of 9 inputs, each scored 0–100. Each bar is that input's sub-score; the figure is the points it added to the 100-point composite (weight × sub-score).
- Cash flow +10.0/30.0
- ARV discount +7.5/15.0
- 1% rule +6.9/10.0
- Schools +5.1/10.0
- Livability +4.1/5.0
- DSCR +2.8/10.0
- Condition / age +2.5/5.0
- Rent growth +2.3/5.0
- Appreciation +0.0/10.0
$102,500
🖨 Deal sheet 📄 Offer letter ✓ Due diligence
Listing remarks
Investor Alert. Nice first-floor 1 bedroom, 1 bathroom condo located in the heart of Altamonte Springs. Enjoy great community amenities with a large pool, tennis courts, gym, and sauna. HOA fee includes water, trash, and sewer.
Key facts
- First-floor condo
- Community amenities
- Large pool
Tags
Property features AI
Finance
- Other: Property subtype: Condominium; Zoning: R-3
- Financial info: Total monthly fees: $323; Total annual fees: $3,876; Lease restrictions apply
- HOA & community: Monthly HOA fee of $323 (includes pool, insurance, building and grounds maintenance, management, sewer, trash, and water); Association name: Eva Valencia; Association approval required; Pets allowed: Cats and dogs; Community pool
Exterior
- Utilities: Private and public water available; Private sewer; Cable available
- Home design: Condominium; Residential property; North-facing; One level (unit on floor 1); 2 total stories in building; Entry level: One
- Construction: Stucco construction; Shingle roof; Concrete perimeter foundation; Slab foundation; Building/Unit number 104
- Exterior features: Balcony; Paved road access
Interior
- Kitchen: Dishwasher; Range; Range hood; Refrigerator
- Bedrooms: 1 bedroom
- Flooring: Carpet; Vinyl
- Bathrooms: 1 full bathroom
- Heating & cooling: Central heating; Central air conditioning
- Interior features: Other interior features; 3 total rooms
- Laundry & utility: Laundry located in the kitchen; Dryer
Neighborhood map
What this means for you Summary
Snapshot
- This is a 1-bed/1.0-bath condo listed at $102k.
Deal economics
- At list price, monthly cash flow is $-62 ($-743/yr) — negative.
- To cash-flow at today's rent, offer at most $92k (10.7% below list).
- Meets the 1% rule at list price ($1k rent vs $102k).
- Recommended offer: $90k (12.0% below list) — sets the bar for market timing.
- Cap rate 5.6% vs local median 3.4% in Altamonte Springs — top-decile yield for the area; either an underpriced asset or a hidden risk that comps aren't pricing in. Stress-test before assuming the spread holds.
Location & tenants
- Location reads 82/100 on livability (#62 in FL, #1,095 nationally) — a professional / high-income tenant draw. Strengths: commute A+, cost of living A+, housing A+; Watch: employment C-, crime D+, amenities D-.
- Seminole (suburban): math 57% / reading 61% proficiency, ranked #13 of 73 in FL (top 18%) — acceptable for families but not a draw, mixed tenant base, ~2y average lease.
- Market conditions: Rents soft (-0.8%/yr); 257 active listings in the ZIP; 40 comparable units currently listed for rent nearby; rentals at typical pace (median 18d on market — plan ~3-4 weeks tenant-placement turnaround); 1,979 units permitted in Seminole County in 2024 (1,191 in 5+ unit buildings).
Forward outlook
- Local home prices are declining (-3.0%/yr); year-one equity from $709 of loan paydown is wiped out by about $3k of value loss. Plan a longer hold.
- Seminole County population projected at +24% by 2050 — long-run rental-demand tailwind backs the buy-and-hold thesis.
Negotiation context
- It's been on market 225 days — a 12% lower offer ($90k) is reasonable based on typical stale-listing flexibility.
- 3 sale attempts; this cycle's ask has dropped $22k (18%) from the opening price — seller is motivated, your offer sets the floor, not the list.
- Current owner paid $80k; 28% above their basis — modest negotiation headroom, anchor on the comps not their cost.
Risks & watch-outs
- Watch-outs: HOA is 27% of rent.
- Climate carrying-cost: severe wind risk, 99% chance of damaging wind over 30y; extreme-heat days projected 7→23/yr by 2055 (HVAC capex compounding) — expect insurance premiums to compound above CPI over the hold.
Questions for the listing agent
- What do current leases actually rent for vs. the listed asking? Can we see a recent rent roll and the last 12 months of T-12 income?
- It's been on market 225 days. Have you received any prior offers? Is the seller open to a 12% concession, seller financing, or rate buy-down credit?
- Built in 1971 — when were the roof, HVAC, electrical panel, plumbing, and water heater last replaced?
- What does the HOA fee cover, when was the last increase, and are there any pending special assessments or reserve-fund shortfalls?
- Any open or pending special assessments — roof, HVAC, plumbing, elevator, façade? What's the per-unit balance and payoff schedule, and is the seller paying it off at close or rolling it to the buyer?
- Why hasn't it sold? Are there any deal-killer items the seller is aware of (foundation, flood, title, zoning, code violations)?
- Is there a deadline driving the sale (1031 exchange, divorce, estate, relocation)? That informs how much negotiation room exists.
- Crime grade is D in this area — have there been break-ins, vandalism, or insurance claims at this property in the last 3 years? What carrier currently insures it and at what premium?
- The area grade is low — what's the realistic commute time and amenity access for the typical tenant pool here? Any planned neighborhood developments (good or bad) we should know about?
- What's the average days-on-market for RENTAL listings here right now (not sales)? A rising rental-DOM trend means longer vacancies and softer asking-rent achievability than the comps imply.
- What's the recent tenant-quality profile in this submarket — average credit score on applications, eviction rate, late-payment / NSF rate, and stable-employment percentage? A property-management company in the area should have these aggregated.
- How much new apartment / multifamily construction is in the pipeline within 1–3 miles? Heavy new supply (>2% of stock underway) typically softens rents 12–24 months out; light construction supports rent growth.
Investment metrics
- 1% rule
- 1.19% ✓
- Cap rate
- 5.57%
- Cash-on-cash
- -2.59%
- DSCR
- 0.88
- GRM
- 7.0
CMA / ARV
No comps found within radius.
Projected returns pro-forma
-3.0% appreciation · 0.0% rent growth · sell at horizon
- IRR
- -25.5%
- Equity multiple
- 0.17×
- Total profit
- $-23,906
- Equity at exit
- $15,283
- IRR
- -46.6%
- Equity multiple
- -0.35×
- Total profit
- $-38,808
- Equity at exit
- $8,862
Cash invested: $28,700 (down + closing). Projections, not guarantees.
Landlord ↔ Tenant lean methodology
- Overall (STATE)
- 87 Strongly Landlord-Friendly
- State Florida
- 87 Strongly Landlord-Friendly · R+3
- County
- — inherits STATE
- City
- — inherits STATE
ZIP-level market 32714
- Rents YoY
- -0.8%
- Active inventory
- 257
- Price-to-rent
- 7.0×
Monthly cashflow live
- Estimated rent
- $1,216 high interval (Pro) →
- Mortgage (P&I)
- −$538
- Tax from tax record
- −$119 /mo · $1,431/yr
- Insurance
- −$43
- HOA
- −$323
- Vacancy / Maint / Mgmt
- −$255
- Net cashflow
- $-62
Break-even live
UW: 25.0% down · 7.5% · 30yr · 1.5% tax · 5.0% vac · 8.0% maint · 8.0% mgmt
Financing live
Cash to close
- Down payment
- $25,625
- Closing costs
- $3,075
- Reserves months
- —
- Total cash needed
- —
Loan-product check · same deal, 3 products live
Conventional
25% down · 7.5% · 30yr
- Down + closing
- —
- Monthly P&I
- —
- Monthly cashflow
- —
- DSCR
- —
- Eligible?
- —
Personal DTI + credit; lowest rate.
DSCR
20% down · 8.5% · 30yr
- Down + closing
- —
- Monthly P&I
- —
- Monthly cashflow
- —
- DSCR
- —
- Eligible?
- —
No personal income docs; deal must DSCR.
Hard money
10% down · 12.0% · 12mo
- Down + closing
- —
- Monthly P&I
- —
- Monthly cashflow
- —
- DSCR
- —
- Eligible?
- —
Short-term bridge; refi at stabilization.
Rent comps 40 comps
| Address | Beds | Baths | Sqft | Rent | $/sqft | DOM | Units | Dist |
|---|---|---|---|---|---|---|---|---|
| 315 Wymore Rd Altamonte Springs, FL | 1.0 | 1.0 | 650 | $1,172 | $1.80 | 23d | 2 | 0.03mi |
| 315 Wymore Rd Altamonte Springs, FL | 1.0 | 1.0 | 650 | $1,150 | $1.77 | 17d | 1 | 0.03mi |
| 285 Wymore Rd Unit 285-104 Altamonte Springs, FL | 1.0 | 1.0 | 651 | $1,100 | $1.69 | 23d | 1 | 0.05mi |
| 325 Wymore Rd Unit 325-106 Altamonte Springs, FL | 1.0 | 1.0 | 651 | $1,000 | $1.54 | 23d | 1 | 0.05mi |
| 334 Wymore Rd Altamonte Springs, FL | 1.0 | 1.0 | 663 | $995 | $1.50 | 21d | 1 | 0.10mi |
| 360 Wymore Rd Altamonte Springs, FL | 1.0–3.0 | 1.0–2.0 | 1108 | $995 | $0.90 | 1d | 6 | 0.14mi |
| 264 Springs Colony Cir Altamonte Springs, FL | 1.0–3.0 | 1.0–2.0 | 1000 | $1,362 | $1.36 | 2d | 9 | 0.17mi |
| 435 Wymore Rd #207 Altamonte Springs, FL | 1.0 | 1.0 | 650 | $1,300 | $2.00 | 17d | 1 | 0.18mi |
| 351 Northlake Blvd Altamonte Springs, FL | 1.0–2.0 | 1.0–2.0 | 837 | $1,388 | $1.66 | 1d | 26 | 0.27mi |
| 122 Water Front Way #170 Altamonte Springs, FL | 1.0 | 1.0 | 496 | $1,300 | $2.62 | 17d | 1 | 0.45mi |
| 693 Wymore Rd Altamonte Springs, FL | 1.0–2.0 | 1.0–2.0 | 860 | $1,454 | $1.69 | 2d | 15 | 0.45mi |
| 128 Water Front Way Altamonte Springs, FL | 1.0 | 1.0 | 496 | $1,095 | $2.21 | 12d | 1 | 0.46mi |
| 131 Water Front Way #150 Altamonte Springs, FL | 1.0 | 1.0 | 496 | $1,200 | $2.42 | 2d | 1 | 0.48mi |
| 120 Blue Point Way Altamonte Springs, FL | 1.0 | 1.0 | 496 | $1,170 | $2.36 | 20d | 2 | 0.48mi |
| 123 Blue Point Way #100 Altamonte Springs, FL | 1.0 | 1.0 | 496 | $1,300 | $2.62 | 23d | 1 | 0.51mi |
| 136 Blue Point Way #310 Altamonte Springs, FL | 1.0 | 1.0 | 496 | $1,095 | $2.21 | 2d | 1 | 0.51mi |
| 129 Blue Point Way #150 Altamonte Springs, FL | 1.0 | 1.0 | 496 | $1,175 | $2.37 | 17d | 1 | 0.51mi |
| 465 Forestway Cir #302 Altamonte Springs, FL | 1.0 | 1.0 | 664 | $1,249 | $1.88 | 1d | 1 | 0.54mi |
| 320 Black Oak Ct #207 Altamonte Springs, FL | 1.0 | 1.0 | 712 | $1,350 | $1.90 | 23d | 1 | 0.57mi |
| 230 Country Walk Pl Altamonte Springs, FL | 1.0–3.0 | 1.0–2.5 | 1068 | $1,297 | $1.21 | 1d | 52 | 0.58mi |
| 380 Lakepointe Dr #204 Altamonte Springs, FL | 1.0 | 1.0 | 712 | $1,345 | $1.89 | 4d | 1 | 0.62mi |
| 365 Forestway Cir Altamonte Springs, FL | 1.0 | 1.0 | 644 | $1,325 | $2.06 | 23d | 2 | 0.64mi |
| 365 Forestway Cir #306 Altamonte Springs, FL | 1.0 | 1.0 | 644 | $1,350 | $2.10 | 14d | 1 | 0.64mi |
| 351 Lone Hill Dr #306 Altamonte Springs, FL | 1.0 | 1.0 | 644 | $1,350 | $2.10 | 4d | 1 | 0.64mi |
| 370 Lake Tahoe Ct Altamonte Springs, FL | 1.0 | 1.0 | 712 | $1,295 | $1.82 | 17d | 2 | 0.67mi |
| 375 Lake Ontario Ct Altamonte Springs, FL | 1.0 | 1.0 | 678 | $1,322 | $1.95 | 3d | 2 | 0.67mi |
| 385 Woodside Dr #201 Altamonte Springs, FL | 1.0 | 1.0 | 708 | $1,500 | $2.12 | 23d | 1 | 0.68mi |
| 300 Lakepointe Dr #204 Altamonte Springs, FL | 1.0 | 1.0 | 712 | $1,225 | $1.72 | 23d | 1 | 0.69mi |
| 390 Lake Placid Ct #303 Altamonte Springs, FL | 1.0 | 1.0 | 644 | $1,350 | $2.10 | 17d | 1 | 0.72mi |
| 245 Loraine Dr Altamonte Springs, FL | — | 1.0 | 500 | $1,000 | $2.00 | 23d | 1 | 0.77mi |
| 293 Loraine Dr Altamonte Springs, FL | 1.0–2.0 | 1.0 | 730 | $1,030 | $1.41 | 23d | 1 | 0.80mi |
| 425 Centerpointe Cir Altamonte Springs, FL | 2.0 | 1.0–2.0 | 779 | $2,450 | $3.14 | 2d | 130 | 0.86mi |
| 486 Centerpointe Cir Altamonte Springs, FL | 1.0–3.0 | 1.0–2.0 | 1037 | $1,816 | $1.75 | 2d | 15 | 0.87mi |
| 895 Wymore Rd Altamonte Springs, FL | 1.0–4.0 | 1.0–2.5 | 1304 | $1,293 | $0.99 | 1d | 21 | 0.90mi |
| 599 Calibre Crest Pkwy Altamonte Springs, FL | 1.0–2.0 | 1.0–2.5 | 951 | $1,352 | $1.42 | 1d | 23 | 1.05mi |
| 944 Lake Destiny Rd Altamonte Springs, FL | 1.0 | 1.0 | 625 | $1,142 | $1.83 | 19d | 3 | 1.07mi |
| 946 Lake Destiny Rd Unit E Altamonte Springs, FL | 1.0 | 1.0 | 462 | $1,150 | $2.49 | 23d | 1 | 1.08mi |
| 948 Lake Destiny Rd Altamonte Springs, FL | 1.0 | 1.0 | 625 | $1,250 | $2.00 | 3d | 1 | 1.09mi |
| 948 Lake Destiny Rd Unit C Altamonte Springs, FL | 1.0 | 1.0 | 625 | $1,200 | $1.92 | 23d | 1 | 1.09mi |
| 700 Altamira Cir Altamonte Springs, FL | 1.0–2.0 | 1.0–2.0 | 825 | $1,226 | $1.49 | 1d | 33 | 1.09mi |
HOA detail condo
- Monthly dues
- $323 · $3,876/yr
- Likely covers
- watersewertrashpoolgym
- Assessments
- None detected in remarks — confirm with the listing agent.
Listing history 32 events
-
2026-06-18days on market $102,500 Active 225 DOM
-
2026-06-17days on market $102,500 Active 224 DOM
-
2026-06-16days on market $102,500 Active 223 DOM
-
2026-06-15days on market $102,500 Active 222 DOM
-
2026-06-13days on market $102,500 Active 220 DOM
-
2026-06-09days on market $102,500 Active 216 DOM
-
2026-06-08days on market $102,500 Active 215 DOM
-
2026-06-07days on market $102,500 Active 214 DOM
-
2026-06-04days on market $102,500 Active 211 DOM
-
2026-06-03days on market $102,500 Active 210 DOM
-
2026-06-02days on market $102,500 Active 209 DOM
-
2026-06-02pricedays on market $102,500 Active 208 DOM
-
2026-05-31days on market $103,000 Active 207 DOM
-
2026-05-20price $103,000
-
2026-05-18price $105,000
-
2026-05-02status Active
-
2026-05-02price $107,888
-
2026-04-30historical
-
2026-04-08price $108,999
-
2026-03-16price $108,900
-
2026-02-12price $112,500
-
2026-02-05price $115,000
-
2026-01-13price $116,500
-
2025-11-26price $119,500
-
2025-11-04$125,000 Active
-
2025-10-27historical
-
2025-08-18price $114,900
-
2025-06-07price $119,900
-
2025-05-29$124,900 Active
-
2021-11-09soldstatus $80,000
-
2013-05-09soldstatus $49,500
-
2012-10-01soldstatus $3,995,000
ⓘ Source: listings_history table (triggers on properties + properties_extension) + one-shot
backfill from property_details.listing_events for pre-trigger history.
Tax reassessment forecast FL · Resets to sale price
- Current annual tax
- $1,431 · $119/mo
- Projected year-2 tax
- $1,431 · $119/mo
- Expected delta
- $0/yr ($0/mo · 0.0%)
ⓘ Screening estimate from a state-policy table — verify with the county assessor before closing.
Climate risk First Street
- Flood 4/10 Moderate FEMA zone X (unshaded) · 24% chance over 30 yrs
- Wildfire 1/10 Low
- Heat 9/10 Extreme 7 d/yr ≥108°F today · 23 d/yr by 30 yrs out
- Wind 9/10 Extreme 99% chance of damaging wind over 30 yrs
- Air quality 2/10 Low 1 unhealthy d/yr today · 1 by 30 yrs out
Nearby sold comps map
Loading sold comps map…
Walkable amenities ~0.75 mi
Loading nearby amenities…
Taxation est. · year 1
- Rental income
- $14,591
- − Mortgage interest
- −$5,742
- − Property taxes
- −$1,431
- − Insurance
- −$512
- − Repairs & maintenance
- −$1,167
- − Management
- −$1,167
- − HOA
- −$3,876
- − Depreciation
- −$2,982
- Taxable loss
- −$2,287
- Est. tax savings @ 24.0%
- +$549
- After-tax cash flow
- $-194/yr
For passive investors: Depreciation is non-cash, so a rental often shows a tax loss while cash-flowing — sheltering income. Rental losses are passive: they offset passive income freely, and up to $25,000/yr can offset ordinary (W-2) income if you actively participate and your MAGI is under $100k (phasing out to $0 by $150k); unused losses carry forward. On sale, claimed depreciation is recaptured at up to 25%, and gains may owe capital-gains tax (a 1031 exchange can defer both). Figures are a year-1 estimate at your 24.0% rate — not tax advice; consult a CPA.
Schools (NCES district)
- District
- Seminole
- NCES district ID
- 1201710
- Math proficiency
- 57% ▼ -7.00%
- Reading proficiency
- 61% ▼ -1.00%
- Median HH income
- $58,478
- Composite
- 51.05/100
- National rank
- #1769
- State rank
- #13 of 73 in FL
Livability — Altamonte Springs
- Score
- 82/100
- State rank
- #62
- US rank
- #1095
Category grades
Schools grade is shown separately in the Schools card above.
Census & demographics
- County
- Seminole County · 436,154 people
- City population
- 62,497
- Metro
- Orlando-Kissimmee-Sanford, FL
- Population (ZIP)
- 37,905
- Household income
- $70,955
- Rent vs Own
- Severe rent burden
- 1961.0
Population outlook (Seminole County) Hauer SSP2
- Today (2025)
- 515,494 people
- By 2030
- 545,713 · +5.9%
- By 2040
- 598,068 · +16.0%
- By 2050
- 640,663 · +24.3%
- By 2075
- 724,461 · +40.5%
- By 2100
- 755,530 · +46.6%
Race, ethnicity, and origin ACS 2023
- Neighborhood character
- Diverse neighborhood (Simpson 0.69)
- Race & ethnicity
- White 43% Hispanic / Latino 31% Two or more races 17% Black 17% Asian 2%
- Hispanic origin (detail)
- Mexican 3% Puerto Rican 10% Cuban 3% Dominican 2%
- Common ancestry
- Lithuanian 4% Hispanic 3% Scotch-Irish 2%
- Foreign-born
- 18% · Canada, Jamaica, South Korea
- Languages at home
- 71% English-only · Spanish 22% French/Haitian/Cajun 3% Other Indo-European 1%
Political lean MEDSL · Seminole
- 2024 margin
- Toss-up / Even · D 47.6% · R 51.1% · Other 1.3%
- 2008→2024 swing
- -0.8pp no change · 2008: -2.8pp · 2024: -3.5pp
- All cycles
- 2024: R+3.5 2020: D+2.8 2016: R+1.6 2012: R+6.5 2008: R+2.8
Not yet ingested
- Civics
- —
Market trends
- HPI YoY
- ▼ -200.78%
- Current HPI
- 338.6894
- Rent YoY
- ▼ -0.79%
- Metro
- Orlando-Kissimmee-Sanford, FL
- State GDP YoY
- ▲ 3.28%
- F500 in state
- 36
Industry mix (Fortune 500 HQ in FL)
| Industry | F500 HQs | Revenue |
|---|---|---|
| Industrial Technology | 2 | $29B |
|
||
| Insurance | 2 | $17B |
|
||
| Retail | 1 | $60B |
|
||
| Technology Distribution | 1 | $58B |
|
||
| Homebuilding | 1 | $35B |
|
||
| Technology Manufacturing | 1 | $35B |
|
||
Price history
-97.4% since first listed19 events — show timeline
- 2026-05-20 Price Changed $103,000 Stellar MLS as Distributed by MLS Grid
- 2026-05-18 Price Changed $105,000 Stellar MLS as Distributed by MLS Grid
- 2026-05-02 Relisted — Stellar MLS as Distributed by MLS Grid
- 2026-05-02 Price Changed $107,888 Stellar MLS as Distributed by MLS Grid
- 2026-04-30 Listing Removed — Stellar MLS as Distributed by MLS Grid
- 2026-04-08 Price Changed $108,999 Stellar MLS as Distributed by MLS Grid
- 2026-03-16 Price Changed $108,900 Stellar MLS as Distributed by MLS Grid
- 2026-02-12 Price Changed $112,500 Stellar MLS as Distributed by MLS Grid
- 2026-02-05 Price Changed $115,000 Stellar MLS as Distributed by MLS Grid
- 2026-01-13 Price Changed $116,500 Stellar MLS as Distributed by MLS Grid
- 2025-11-26 Price Changed $119,500 Stellar MLS as Distributed by MLS Grid
- 2025-11-04 Listed $125,000 Stellar MLS as Distributed by MLS Grid
- 2025-10-27 Listing Removed — Stellar MLS as Distributed by MLS Grid
- 2025-08-18 Price Changed $114,900 Stellar MLS as Distributed by MLS Grid
- 2025-06-07 Price Changed $119,900 Stellar MLS as Distributed by MLS Grid
- 2025-05-29 Listed $124,900 Stellar MLS as Distributed by MLS Grid
- 2021-11-09 Sold (Public Records) $80,000 Public Records
- 2013-05-09 Sold (Public Records) $49,500 Public Records
- 2012-10-01 Sold (Public Records) $3,995,000 Public Records
Property tax history
+10.9%/yrLatest (2025): $1,431 · +9.7% YoY. Source: county tax records.
Cash-flow waterfall
monthlySold comps — $/sqft
last 12 mo · ≤1 miLoading sold comps…