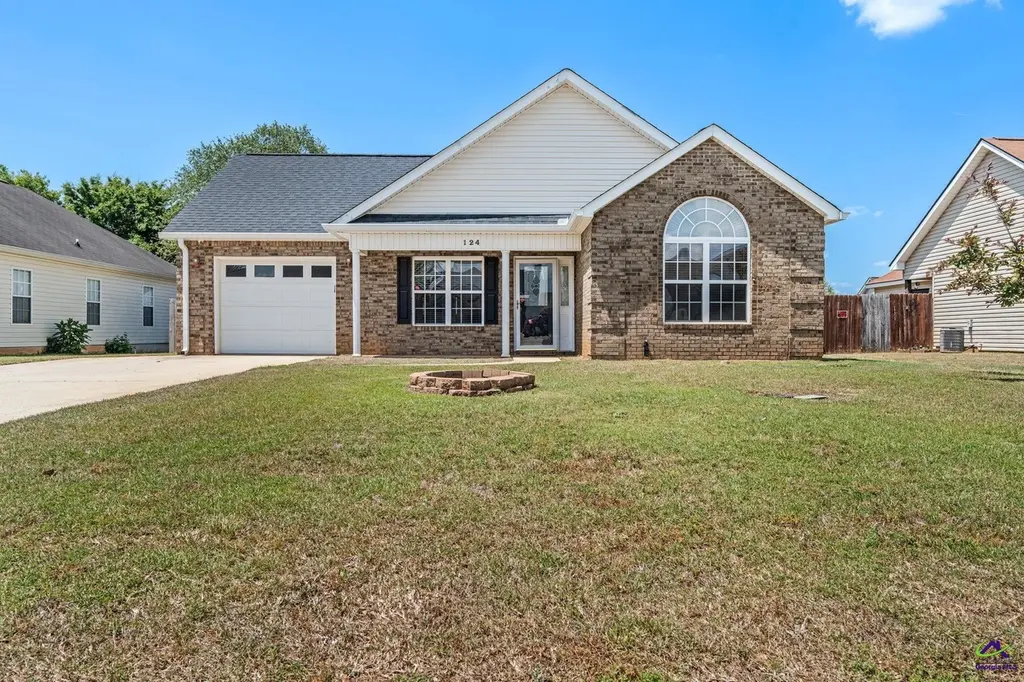
124 Cedarland Dr · Warner Robins, GA
Flood risk 1/10 · Minimal
- FEMA flood zone
- X (unshaded)
- Chance of flooding over 30 yrs
- 0.0%
- Est. flood insurance / yr
- $507 – $1,088
Fire risk 3/10 · Minor
- Est. fire insurance / yr
- $963 – $1,789
Heat risk 7/10 · Major
- Hot days now (above 107°F)
- 7 days/yr
- Hot days in 30 yrs
- 19 days/yr
Wind risk 6/10 · Moderate
- Chance of severe wind over 30 yrs
- 76.0%
Air-quality risk 3/10 · Minor
- Unhealthy air days now
- 2 days/yr
- Unhealthy air days in 30 yrs
- 3 days/yr
Risk factors via First Street. Map © Google.
Why this score? — see what drove the D grade
The composite is a weighted blend of 9 inputs, each scored 0–100. Each bar is that input's sub-score; the figure is the points it added to the 100-point composite (weight × sub-score).
- Cash flow +13.0/30.0
- ARV discount +9.6/15.0
- DSCR +3.9/10.0
- Schools +3.9/10.0
- Livability +3.2/5.0
- Rent growth +2.9/5.0
- 1% rule +2.8/10.0
- Condition / age +2.5/5.0
- Appreciation +0.0/10.0
$239,900
🖨 Deal sheet 📄 Offer letter ✓ Due diligence
Listing remarks MLS
Beautiful three bedroom two bathroom home in Glen Laurel subdivision. Very open floor plan with double-sided fireplace and eat-in kitchen has oak cabinetry. Tray ceiling and french doors leading into the master bath, separate enclosed shower, dual sinks, jetted tub, linen closet, and a walk-in master closet. Screened back porch with fully sodded yard.
Key facts
- Tray ceiling
- French doors
- Eat-in kitchen
Tags
Neighborhood map
What this means for you Summary
Snapshot
- This is a 3-bed/2.0-bath single-family listed at $240k.
Deal economics
- At list price, monthly cash flow is $-12 ($-138/yr) — negative.
- To cash-flow at today's rent, offer at most $238k (0.8% below list).
- To meet the 1% rule (rent ≥ 1% of price), the offer needs to be $187k (22.0% below list).
- Recommended offer: $187k (22.0% below list) — sets the bar for 1% rule.
- Cap rate 6.2% vs local median 4.9% in Warner Robins — meaningfully above typical; check what's discounted (condition, days-on-market, listing class) to confirm the premium yield is real.
Location & tenants
- Location reads 65/100 on livability (#227 in GA) — a middle-class / working-renter tenant base. Strengths: cost of living A+, housing A+, health & safety A+; Watch: employment D+, crime F, amenities F.
- Houston County (urban): math 43% / reading 46% proficiency, ranked #23 of 174 in GA (top 13%) — families likely to look elsewhere, expect single-tenant / working-renter base with shorter leases.
- Zoned schools: Lake Joy Primary School (666 students, 46% FRL); Feagin Mill Middle School (math 54% / reading 64%, grade B, #45 of 470 statewide, top 10%, 899 students, 41% FRL) — zoned schools at 43% FRL track the district average.
- Zoned-school proficiency averages 59% at this address vs 44% district-wide (+14 pts) — the actual schools serving this property are materially stronger than the Houston County average implies; a family-tenant draw the district grade alone would hide.
- Market conditions: Rents rising (+1.7%/yr); 286 active listings in the ZIP; 11 comparable units currently listed for rent nearby; rentals at typical pace (median 21d on market — plan ~3-4 weeks tenant-placement turnaround); 45% of comp listings sitting > 30 days — soft ceiling on asking rent; solid renter incomes; 1,545 units permitted in Houston County in 2024 (336 in 5+ unit buildings).
Forward outlook
- Local home prices are declining (-3.0%/yr); year-one equity from $2k of loan paydown is wiped out by about $7k of value loss. Plan a longer hold.
- Houston County population projected at +22% by 2050 — long-run rental-demand tailwind backs the buy-and-hold thesis.
Negotiation context
- Only 3 days on market — expect competitive offers; lowballing is unlikely to land.
- 2 sale attempts since 11y ago with the ask held roughly flat each time — persistent listings suggest the price (not the market) is what's stuck; bring a comps-based counter.
- Current owner paid $114k; list at $240k implies a 111% gain — meaningful room to come down on a strong offer.
Risks & watch-outs
- Climate carrying-cost: major wind risk, 76% chance of damaging wind over 30y; extreme-heat days projected 7→19/yr by 2055 (HVAC capex compounding) — expect insurance premiums to compound above CPI over the hold.
Questions for the listing agent
- What do current leases actually rent for vs. the listed asking? Can we see a recent rent roll and the last 12 months of T-12 income?
- Is there a deadline driving the sale (1031 exchange, divorce, estate, relocation)? That informs how much negotiation room exists.
- Schools are D-rated, which usually means shorter tenancies and higher turnover. Who's the typical renter profile here, and what's been the actual vacancy rate?
- Crime grade is F in this area — have there been break-ins, vandalism, or insurance claims at this property in the last 3 years? What carrier currently insures it and at what premium?
- The area grade is low — what's the realistic commute time and amenity access for the typical tenant pool here? Any planned neighborhood developments (good or bad) we should know about?
- What's the average days-on-market for RENTAL listings here right now (not sales)? A rising rental-DOM trend means longer vacancies and softer asking-rent achievability than the comps imply.
- What's the recent tenant-quality profile in this submarket — average credit score on applications, eviction rate, late-payment / NSF rate, and stable-employment percentage? A property-management company in the area should have these aggregated.
- How much new for-sale + rental construction is in the pipeline within 1–3 miles? Heavy new supply typically softens prices + rents 12–24 months out; constrained supply supports both.
Investment metrics
- 1% rule
- 0.78% ✗
- Cap rate
- 6.24%
- Cash-on-cash
- -0.21%
- DSCR
- 0.99
- GRM
- 10.7
CMA / ARV
- ARV (on-the-fly)
- $251,790
- Comps found
- 12
Show comp detail 12 sales within ~0.75 mi
| Address | Dist | Beds/Ba | Sqft | Sold | Price | $/sf | Match |
|---|---|---|---|---|---|---|---|
| 124 Cedarland Dr | 0.00mi | 3/2.0 | 1,526 (0%) | 1mo | $240,000 | $157 | 99 |
| 205 Wembley Dr | 0.19mi | 3/2.0 | 1,493 (-2%) | 2mo | $239,900 | $161 | 86 |
| 122 Halidon Dr | 0.14mi | 3/2.0 | 1,475 (-3%) | 5mo | $242,000 | $164 | 84 |
| 303 Sark Dr | 0.14mi | 3/2.0 | 1,402 (-8%) | 3mo | $235,000 | $168 | 78 |
| 303 Sark Dr | 0.14mi | 3/2.0 | 1,402 (-8%) | 3mo | $235,000 | $168 | 78 |
| 611 Sark Dr | 0.35mi | 4/2.0 (+1) | 1,531 (+0%) | 2mo | $250,000 | $163 | 76 |
| 216 Wembley Dr | 0.16mi | 3/2.0 | 1,390 (-9%) | 2mo | $230,000 | $165 | 76 |
| 107 Bellshill Ct | 0.34mi | 3/2.5 | 1,580 (+4%) | 1mo | $245,000 | $155 | 75 |
| 126 Millbrook Dr | 0.06mi | 3/2.0 | 1,325 (-13%) | 2mo | $219,900 | $166 | 74 |
| 217 Wembley Dr | 0.19mi | 3/2.0 | 1,419 (-7%) | 7mo | $232,000 | $163 | 74 |
| 232 Jerusalem Church Rd | 0.22mi | 3/2.0 | 1,328 (-13%) | 3mo | $219,900 | $166 | 66 |
| 221 Wembley Dr | 0.20mi | 3/2.0 | 1,328 (-13%) | 5mo | $228,000 | $172 | 65 |
Match score weights: distance 35% · size 25% · config 20% · recency 20%. Top-matched comps best support the ARV.
Projected returns pro-forma
-3.0% appreciation · 1.67% rent growth · sell at horizon
- IRR
- -18.0%
- Equity multiple
- 0.37×
- Total profit
- $-42,155
- Equity at exit
- $35,770
- IRR
- -12.8%
- Equity multiple
- 0.29×
- Total profit
- $-47,832
- Equity at exit
- $20,742
Cash invested: $67,172 (down + closing). Projections, not guarantees.
Landlord ↔ Tenant lean methodology
- Overall (STATE)
- 90 Strongly Landlord-Friendly
- State Georgia
- 90 Strongly Landlord-Friendly · R+3
- County
- — inherits STATE
- City
- — inherits STATE
ZIP-level market 31088
- Rents YoY
- 1.7%
- Active inventory
- 286
- Price-to-rent
- 10.7×
Monthly cashflow live
- Estimated rent
- $1,872 high interval (Pro) →
- Mortgage (P&I)
- −$1,258
- Tax from tax record
- −$132 /mo · $1,585/yr
- Insurance
- −$100
- HOA
- −$0
- Vacancy / Maint / Mgmt
- −$393
- Net cashflow
- $-12
Break-even live
UW: 25.0% down · 7.5% · 30yr · 1.5% tax · 5.0% vac · 8.0% maint · 8.0% mgmt
Financing live
Cash to close
- Down payment
- $59,975
- Closing costs
- $7,197
- Reserves months
- —
- Total cash needed
- —
Loan-product check · same deal, 3 products live
Conventional
25% down · 7.5% · 30yr
- Down + closing
- —
- Monthly P&I
- —
- Monthly cashflow
- —
- DSCR
- —
- Eligible?
- —
Personal DTI + credit; lowest rate.
DSCR
20% down · 8.5% · 30yr
- Down + closing
- —
- Monthly P&I
- —
- Monthly cashflow
- —
- DSCR
- —
- Eligible?
- —
No personal income docs; deal must DSCR.
Hard money
10% down · 12.0% · 12mo
- Down + closing
- —
- Monthly P&I
- —
- Monthly cashflow
- —
- DSCR
- —
- Eligible?
- —
Short-term bridge; refi at stabilization.
Rent comps 11 comps
| Address | Beds | Baths | Sqft | Rent | $/sqft | DOM | Units | Dist |
|---|---|---|---|---|---|---|---|---|
| 135 Cedarland Dr Warner Robins, GA | 3.0 | 2.0 | 1379 | $1,700 | $1.23 | 43d | 1 | 0.05mi |
| 200 Stirling Bridge Dr Warner Robins, GA | 3.0 | 2.0 | 1326 | $1,700 | $1.28 | 13d | 1 | 0.12mi |
| 205 Wembley Dr Warner Robins, GA | 3.0 | 2.0 | 1493 | $1,800 | $1.21 | 21d | 1 | 0.18mi |
| 402 Nandina Ct Warner Robins, GA | 2.0 | 2.0 | 1710 | $2,000 | $1.17 | 13d | 1 | 0.29mi |
| 604 Stirling Bridge Dr Warner Robins, GA | 3.0 | 2.0 | 1455 | $1,700 | $1.17 | 13d | 1 | 0.32mi |
| 136 Roseine Dr Warner Robins, GA | 4.0 | 3.5 | 2207 | $2,950 | $1.34 | 43d | 1 | 0.58mi |
| 136 Roseine Dr Warner Robins, GA | 4.0 | 3.5 | 2207 | $2,950 | $1.34 | 13d | 1 | 0.58mi |
| 209 Sedgebrooke Dr Warner Robins, GA | 3.0 | 2.0 | 1874 | $2,000 | $1.07 | 43d | 1 | 0.66mi |
| 104 Sir Patrick Way Warner Robins, GA | 4.0 | 2.0 | 1494 | $1,995 | $1.34 | 43d | 1 | 0.88mi |
| 104 Bryce Dr Warner Robins, GA | 4.0 | 2.0 | 1758 | $2,100 | $1.19 | 13d | 1 | 1.32mi |
| 107 Barrington Pl N Warner Robins, GA | 3.0 | 2.0 | 1780 | $1,800 | $1.01 | 43d | 1 | 1.39mi |
Listing history 7 events
-
2026-04-28status Pending
-
2026-04-25$239,900 Active
-
2015-10-01soldstatus $113,500
-
2015-09-28soldstatus $113,500 353-char remark
Show marketing remark (353 chars)
Beautiful three bedroom two bathroom home in Glen Laurel subdivision. Very open floor plan with double-sided fireplace and eat-in kitchen has oak cabinetry. Tray ceiling and french doors leading into the master bath, separate enclosed shower, dual sinks, jetted tub, linen closet, and a walk-in master closet. Screened back porch with fully sodded yard.
-
2015-04-21$116,000 353-char remark
Show marketing remark (353 chars)
Beautiful three bedroom two bathroom home in Glen Laurel subdivision. Very open floor plan with double-sided fireplace and eat-in kitchen has oak cabinetry. Tray ceiling and french doors leading into the master bath, separate enclosed shower, dual sinks, jetted tub, linen closet, and a walk-in master closet. Screened back porch with fully sodded yard.
-
2002-12-20soldstatus $18,555
-
2002-08-30soldstatus $15,000
ⓘ Source: listings_history table (triggers on properties + properties_extension) + one-shot
backfill from property_details.listing_events for pre-trigger history.
Tax reassessment forecast GA · Resets to sale price
- Current annual tax
- $1,585 · $132/mo
- Projected year-2 tax
- $2,207 · $184/mo
- Expected delta
- +$622/yr (+$52/mo · 39.2%)
ⓘ Screening estimate from a state-policy table — verify with the county assessor before closing.
Climate risk First Street
- Flood 1/10 Low FEMA zone X (unshaded) · 0% chance over 30 yrs
- Wildfire 3/10 Moderate
- Heat 7/10 Severe 7 d/yr ≥107°F today · 19 d/yr by 30 yrs out
- Wind 6/10 Major 76% chance of damaging wind over 30 yrs
- Air quality 3/10 Moderate 2 unhealthy d/yr today · 3 by 30 yrs out
Nearby sold comps map
Loading sold comps map…
Walkable amenities ~0.75 mi
Loading nearby amenities…
Taxation est. · year 1
- Rental income
- $22,460
- − Mortgage interest
- −$13,438
- − Property taxes
- −$1,585
- − Insurance
- −$1,200
- − Repairs & maintenance
- −$1,797
- − Management
- −$1,797
- − Depreciation
- −$6,979
- Taxable loss
- −$4,336
- Est. tax savings @ 24.0%
- +$1,041
- After-tax cash flow
- $902/yr
For passive investors: Depreciation is non-cash, so a rental often shows a tax loss while cash-flowing — sheltering income. Rental losses are passive: they offset passive income freely, and up to $25,000/yr can offset ordinary (W-2) income if you actively participate and your MAGI is under $100k (phasing out to $0 by $150k); unused losses carry forward. On sale, claimed depreciation is recaptured at up to 25%, and gains may owe capital-gains tax (a 1031 exchange can defer both). Figures are a year-1 estimate at your 24.0% rate — not tax advice; consult a CPA.
Schools (NCES district)
- District
- Houston County
- NCES district ID
- 1302880
- Math proficiency
- 43% ▼ -7.00%
- Reading proficiency
- 46% ▼ -2.00%
- Median HH income
- $54,823
- Composite
- 38.68/100
- National rank
- #4144
- State rank
- #23 of 174 in GA
Livability — Warner Robins
- Score
- 65/100
- State rank
- #227
- US rank
- #13290
Category grades
Schools grade is shown separately in the Schools card above.
Census & demographics
- Census place
- Warner Robins, GA
- County
- Houston County · 157,321 people
- City population
- 92,102
- Metro
- Warner Robins, GA
- Population (ZIP)
- 58,585
- Household income
- $83,082
- Rent vs Own
- Severe rent burden
- 1668.0
Population outlook (Houston County) Hauer SSP2
- Today (2025)
- 169,502 people
- By 2030
- 178,486 · +5.3%
- By 2040
- 194,642 · +14.8%
- By 2050
- 207,119 · +22.2%
- By 2075
- 231,480 · +36.6%
- By 2100
- 235,034 · +38.7%
Race, ethnicity, and origin ACS 2023
- Neighborhood character
- Diverse neighborhood (Simpson 0.63)
- Race & ethnicity
- White 51% Black 32% Two or more races 9% Hispanic / Latino 7% Asian 4%
- Hispanic origin (detail)
- Mexican 4%
- Common ancestry
- Romanian 2% Slovak 2% Lithuanian 2%
- Foreign-born
- 9% · Canada, Vietnam, Jamaica
- Languages at home
- 90% English-only · Spanish 5% Other Asian/Pacific 2% Vietnamese 2%
Political lean MEDSL · Houston
- 2024 margin
- R (+11.3) · D 44.0% · R 55.3%
- 2008→2024 swing
- +8.9pp toward D · 2008: -20.2pp · 2024: -11.3pp
- All cycles
- 2024: R+11.3 2020: R+12.4 2016: R+21.6 2012: R+20.7 2008: R+20.2
Not yet ingested
- Civics
- —
Market trends
- HPI YoY
- ▼ -135.75%
- Current HPI
- 219.8261
- Rent YoY
- ▲ 1.67%
- Metro
- Warner Robins, GA
- State GDP YoY
- ▲ 2.66%
- F500 in state
- 28
Industry mix (Fortune 500 HQ in GA)
| Industry | F500 HQs | Revenue |
|---|---|---|
| Paper / Packaging | 2 | $29B |
|
||
| Retail | 1 | $160B |
|
||
| Transportation / Logistics | 1 | $91B |
|
||
| Airlines | 1 | $62B |
|
||
| Consumer Goods | 1 | $47B |
|
||
| Utilities | 1 | $25B |
|
||
Price history
+1499.3% since first listed7 events — show timeline
- 2026-04-28 Pending — CGMLS
- 2026-04-25 Listed $239,900 CGMLS
- 2015-10-01 Sold (Public Records) $113,500 Public Records
- 2015-09-28 Sold (MLS) $113,500 CGMLS
- 2015-04-21 Listed $116,000 CGMLS
- 2002-12-20 Sold (Public Records) $18,555 Public Records
- 2002-08-30 Sold (Public Records) $15,000 Public Records
Property tax history
+5.4%/yrLatest (2025): $1,585 · +4.5% YoY. Source: county tax records.
Cash-flow waterfall
monthlySold comps — $/sqft
last 12 mo · ≤1 miLoading sold comps…