2601 NE 3rd Ct · Boynton Beach, FL
Flood risk 3/10 · Minor
- FEMA flood zone
- X (unshaded)
- Chance of flooding over 30 yrs
- 0.2%
- Est. flood insurance / yr
- $507 – $1,088
Fire risk 1/10 · Minimal
- Est. fire insurance / yr
- $947 – $1,759
Heat risk 9/10 · Severe
- Hot days now (above 105°F)
- 7 days/yr
- Hot days in 30 yrs
- 26 days/yr
Wind risk 10/10 · Severe
- Chance of severe wind over 30 yrs
- 99.0%
Air-quality risk 2/10 · Minimal
- Unhealthy air days now
- 0 days/yr
- Unhealthy air days in 30 yrs
- 2 days/yr
Risk factors via First Street. Map © Google.
Why this score? — see what drove the C grade
The composite is a weighted blend of 9 inputs, each scored 0–100. Each bar is that input's sub-score; the figure is the points it added to the 100-point composite (weight × sub-score).
- Cash flow +17.1/30.0
- 1% rule +10.0/10.0
- ARV discount +7.5/15.0
- DSCR +5.3/10.0
- Schools +4.3/10.0
- Condition / age +4.0/5.0
- Livability +3.6/5.0
- Rent growth +3.4/5.0
- Appreciation +0.0/10.0
$127,900
🖨 Deal sheet 📄 Offer letter ✓ Due diligence
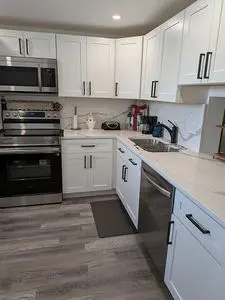
Listing remarks
Selling my two-bedroom two bathrooms, condo Village Royale on the green 55+ Community. Beautiful apartment. Furniture include. Completely renovated Many amenities HOA $689 includes water, cable, TV, internet service. Elevator building (2nd floor)Very clean atmosphere, laundry room on the same floor, parking space included AC is 1 year old
Key facts
- Built 1974
- Listed 10 days
Neighborhood map
What this means for you Summary
Snapshot
- This is a 2-bed/2.0-bath condo listed at $128k. Condition is rated good.
Deal economics
- At list price, monthly cash flow is $89 ($1k/yr) — positive.
- The deal already cash-flows at list — no discount required.
- Meets the 1% rule at list price ($2k rent vs $128k).
- Cap rate 7.1% vs local median 4.3% in Boynton Beach — top-decile yield for the area; either an underpriced asset or a hidden risk that comps aren't pricing in. Stress-test before assuming the spread holds.
Location & tenants
- Location reads 72/100 on livability (#351 in FL) — a middle-class / working-renter tenant base. Strengths: housing A+, health & safety B+, cost of living B; Watch: amenities D+, crime D-, commute F.
- Palm Beach (suburban): math 46% / reading 53% proficiency, ranked #34 of 73 in FL (top 47%) — families likely to look elsewhere, expect single-tenant / working-renter base with shorter leases.
- Market conditions: Rents rising (+3.6%/yr); 536 active listings in the ZIP; 40 comparable units currently listed for rent nearby; rentals at typical pace (median 20d on market — plan ~3-4 weeks tenant-placement turnaround); 3,974 units permitted in Palm Beach County in 2024 (1,012 in 5+ unit buildings).
- This rent runs 36% of the median local income ($68k/yr) — at the standard rent-burdened threshold; future hikes will face affordability resistance.
Forward outlook
- Local home prices are declining (-3.0%/yr); year-one equity from $884 of loan paydown is wiped out by about $4k of value loss. Plan a longer hold.
- Palm Beach County population projected at +30% by 2050 — long-run rental-demand tailwind backs the buy-and-hold thesis.
Negotiation context
- Only 11 days on market — expect competitive offers; lowballing is unlikely to land.
- 2 sale attempts since 20y ago with the ask held roughly flat each time — persistent listings suggest the price (not the market) is what's stuck; bring a comps-based counter.
Risks & watch-outs
- Watch-outs: HOA is 31% of rent.
- Climate carrying-cost: severe wind risk, 99% chance of damaging wind over 30y; extreme-heat days projected 7→26/yr by 2055 (HVAC capex compounding) — expect insurance premiums to compound above CPI over the hold.
Questions for the listing agent
- Built in 1974 — when were the roof, HVAC, electrical panel, plumbing, and water heater last replaced?
- What does the HOA fee cover, when was the last increase, and are there any pending special assessments or reserve-fund shortfalls?
- Any open or pending special assessments — roof, HVAC, plumbing, elevator, façade? What's the per-unit balance and payoff schedule, and is the seller paying it off at close or rolling it to the buyer?
- Is there a deadline driving the sale (1031 exchange, divorce, estate, relocation)? That informs how much negotiation room exists.
- Crime grade is D in this area — have there been break-ins, vandalism, or insurance claims at this property in the last 3 years? What carrier currently insures it and at what premium?
- What's the average days-on-market for RENTAL listings here right now (not sales)? A rising rental-DOM trend means longer vacancies and softer asking-rent achievability than the comps imply.
- What's the recent tenant-quality profile in this submarket — average credit score on applications, eviction rate, late-payment / NSF rate, and stable-employment percentage? A property-management company in the area should have these aggregated.
- How much new apartment / multifamily construction is in the pipeline within 1–3 miles? Heavy new supply (>2% of stock underway) typically softens rents 12–24 months out; light construction supports rent growth.
Investment metrics
- 1% rule
- 1.59% ✓
- Cap rate
- 7.13%
- Cash-on-cash
- 2.98%
- DSCR
- 1.13
- GRM
- 5.2
CMA / ARV
No comps found within radius.
Projected returns pro-forma
-3.0% appreciation · 3.64% rent growth · sell at horizon
- IRR
- -10.1%
- Equity multiple
- 0.63×
- Total profit
- $-13,327
- Equity at exit
- $19,070
- IRR
- 1.1%
- Equity multiple
- 1.08×
- Total profit
- $2,879
- Equity at exit
- $11,058
Cash invested: $35,812 (down + closing). Projections, not guarantees.
Landlord ↔ Tenant lean methodology
- Overall (STATE)
- 87 Strongly Landlord-Friendly
- State Florida
- 87 Strongly Landlord-Friendly · R+3
- County
- — inherits STATE
- City
- — inherits STATE
ZIP-level market 33435
- Rents YoY
- 3.6%
- Active inventory
- 536
- Price-to-rent
- 5.2×
Monthly cashflow live
- Estimated rent
- $2,036 high interval (Pro) →
- Mortgage (P&I)
- −$671
- Tax est. 1.5%
- −$160 /mo · $1,918/yr
- Insurance
- −$53
- HOA est. from 2 same-building comps
- −$636
- Vacancy / Maint / Mgmt
- −$428
- Net cashflow
- $89
Break-even live
UW: 25.0% down · 7.5% · 30yr · 1.5% tax · 5.0% vac · 8.0% maint · 8.0% mgmt
Financing live
Cash to close
- Down payment
- $31,975
- Closing costs
- $3,837
- Reserves months
- —
- Total cash needed
- —
Loan-product check · same deal, 3 products live
Conventional
25% down · 7.5% · 30yr
- Down + closing
- —
- Monthly P&I
- —
- Monthly cashflow
- —
- DSCR
- —
- Eligible?
- —
Personal DTI + credit; lowest rate.
DSCR
20% down · 8.5% · 30yr
- Down + closing
- —
- Monthly P&I
- —
- Monthly cashflow
- —
- DSCR
- —
- Eligible?
- —
No personal income docs; deal must DSCR.
Hard money
10% down · 12.0% · 12mo
- Down + closing
- —
- Monthly P&I
- —
- Monthly cashflow
- —
- DSCR
- —
- Eligible?
- —
Short-term bridge; refi at stabilization.
Rent comps 40 comps
| Address | Beds | Baths | Sqft | Rent | $/sqft | DOM | Units | Dist |
|---|---|---|---|---|---|---|---|---|
| 2601 3rd Ct NE #202 Boynton Beach, FL | 2.0 | 2.0 | 982 | $1,500 | $1.53 | 18d | 1 | 0.02mi |
| 2515 NE 2nd Ct #202 Boynton Beach, FL | 2.0 | 2.0 | 960 | $1,499 | $1.56 | 24d | 1 | 0.05mi |
| 2615 NE 3rd Ct #4030 Boynton Beach, FL | 2.0 | 2.0 | 960 | $1,699 | $1.77 | 4d | 1 | 0.06mi |
| 330 NE 26th Ave Unit 108 Boynton Beach, FL | 1.0 | 1.5 | 754 | $1,375 | $1.82 | 24d | 1 | 0.11mi |
| 330 NE 26th Ave Unit 108 Boynton Beach, FL | 1.0 | 1.5 | 754 | $1,600 | $2.12 | 2d | 1 | 0.11mi |
| 300 NE 26th Ave #1040 Boynton Beach, FL | 2.0 | 2.0 | 1080 | $1,559 | $1.44 | 24d | 1 | 0.13mi |
| 2615 NE 1st Ct #403 Boynton Beach, FL | 2.0 | 2.0 | 960 | $2,100 | $2.19 | 24d | 1 | 0.16mi |
| 2615 NE 1st Ct Boynton Beach, FL | 2.0 | 2.0 | 960 | $1,850 | $1.93 | 18d | 2 | 0.16mi |
| 230 NE 26th Ave #1070 Boynton Beach, FL | 1.0 | 1.5 | 754 | $1,620 | $2.15 | 11d | 1 | 0.21mi |
| 2213 NE 1st Ct #103 Boynton Beach, FL | 1.0 | 1.5 | 624 | $1,350 | $2.16 | 24d | 1 | 0.21mi |
| 230 NE 26th Ave Boynton Beach, FL | 1.0–2.0 | 1.5–2.0 | 857 | $1,650 | $1.93 | 17d | 2 | 0.21mi |
| 2400 NE 1st Ln #206 Boynton Beach, FL | 1.0 | 1.5 | 754 | $1,800 | $2.39 | 14d | 1 | 0.26mi |
| 30 Crossings Cir Unit H Boynton Beach, FL | 2.0 | 2.0 | 864 | $2,400 | $2.78 | 18d | 1 | 0.27mi |
| 130 NE 26th Ave #307 Boynton Beach, FL | 2.0 | 2.0 | 982 | $3,500 | $3.56 | 24d | 1 | 0.27mi |
| 2202 NE 3rd St Boynton Beach, FL | 3.0 | 2.0 | 902 | $3,000 | $3.33 | 16d | 1 | 0.28mi |
| 17 Crossings Cir Unit E Boynton Beach, FL | 2.0 | 2.0 | 864 | $1,900 | $2.20 | 24d | 1 | 0.29mi |
| 7 Crossings Cir Boynton Beach, FL | 2.0 | 1.5 | 864 | $2,500 | $2.89 | 24d | 1 | 0.29mi |
| 4 Crossings Cir Unit B Boynton Beach, FL | 2.0 | 1.5 | 864 | $1,950 | $2.26 | 24d | 1 | 0.29mi |
| 14 Crossings Cir Unit E Boynton Beach, FL | 2.0 | 2.0 | 953 | $2,300 | $2.41 | 24d | 1 | 0.31mi |
| 27 Crossings Cir Unit H Boynton Beach, FL | 2.0 | 2.0 | 864 | $1,900 | $2.20 | 14d | 1 | 0.31mi |
| 2202 NE 4th St #10 Boynton Beach, FL | 2.0 | 1.0 | 757 | $1,900 | $2.51 | 2d | 1 | 0.34mi |
| 24 Crossings Cir Unit H Boynton Beach, FL | 2.0 | 2.0 | 864 | $2,050 | $2.37 | 24d | 1 | 0.36mi |
| 2100 N Seacrest Blvd Boynton Beach, FL | 3.0 | 1.0 | 1056 | $2,900 | $2.75 | 16d | 1 | 0.37mi |
| 108 NE 20th Ave #206 Boynton Beach, FL | 2.0 | 2.0 | 860 | $1,800 | $2.09 | 19d | 1 | 0.37mi |
| 117 Waterside Dr #117 Hypoluxo, FL | 2.0 | 2.0 | 768 | $2,000 | $2.60 | 24d | 1 | 0.41mi |
| 176 Waterside Dr Hypoluxo, FL | 3.0 | 2.0 | 1024 | $2,500 | $2.44 | 19d | 1 | 0.41mi |
| 661 Waterside Dr Hypoluxo, FL | 2.0 | 2.0 | 768 | $2,000 | $2.60 | 24d | 1 | 0.43mi |
| 977 Miner Rd Lantana, FL | 3.0 | 1.0 | 1100 | $3,195 | $2.90 | 2d | 1 | 0.46mi |
| 311 NE 17th Ave #204 Boynton Beach, FL | 2.0 | 2.0 | 1100 | $1,650 | $1.50 | 24d | 1 | 0.48mi |
| 410 NE 17th Ave #101 Boynton Beach, FL | 2.0 | 1.5 | 1080 | $1,500 | $1.39 | 7d | 1 | 0.51mi |
| 1214 Highview Rd Lantana, FL | 3.0 | 2.0 | 768 | $2,300 | $2.99 | 1d | 1 | 0.52mi |
| 2008 S Federal Hwy Unit C207 Boynton Beach, FL | 2.0 | 2.0 | 963 | $2,000 | $2.08 | 24d | 1 | 0.53mi |
| 640 Oak St Boynton Beach, FL | 2.0 | 1.0 | 765 | $2,690 | $3.52 | 7d | 1 | 0.62mi |
| 1820 New Palm Way #201 Boynton Beach, FL | 2.0 | 2.0 | 873 | $3,500 | $4.01 | 24d | 1 | 0.71mi |
| 3265 E Palm Dr Boynton Beach, FL | 3.0 | 2.0 | 744 | $2,600 | $3.49 | 24d | 1 | 0.71mi |
| 1632 N Federal Hwy Boynton Beach, FL | 1.0–3.0 | 1.0–2.0 | 1098 | $2,580 | $2.35 | 1d | 20 | 0.74mi |
| 1097 Wilkinson Rd Unit B Lantana, FL | 2.0 | 1.0 | 855 | $2,200 | $2.57 | 1d | 1 | 0.75mi |
| 1097 Wilkinson Rd Unit B Lantana, FL | 2.0 | 1.0 | 855 | $2,200 | $2.57 | 2d | 1 | 0.75mi |
| 25 S Loafing St Unit 25 Hypoluxo, FL | 2.0 | 1.0 | 552 | $1,500 | $2.72 | 24d | 1 | 0.77mi |
| 25 S Loafing St Unit 25 Hypoluxo, FL | 2.0 | 1.0 | 552 | $1,500 | $2.72 | 2d | 1 | 0.77mi |
HOA detail condo
- Monthly dues
- $0 · $0/yr
- Likely covers
- waterinternetcable
- Assessments
- None detected in remarks — confirm with the listing agent.
Listing history 9 events
-
2026-06-18days on market $127,900 Active 11 DOM
-
2026-06-17days on market $127,900 Active 10 DOM
-
2026-06-16days on market $127,900 Active 9 DOM
-
2026-06-16price $127,900 Active 8 DOM
-
2026-06-15days on market $129,900 Active 8 DOM
-
2026-06-13days on market $129,900 Active 6 DOM
-
2026-06-09days on market $129,900 Active 2 DOM
-
2026-06-08remarks 340-char remark
-
2026-06-08$129,900 Active 1 DOM
ⓘ Source: listings_history table (triggers on properties + properties_extension) + one-shot
backfill from property_details.listing_events for pre-trigger history.
Climate risk First Street
- Flood 3/10 Moderate FEMA zone X (unshaded) · 20% chance over 30 yrs
- Wildfire 1/10 Low
- Heat 9/10 Extreme 7 d/yr ≥105°F today · 26 d/yr by 30 yrs out
- Wind 10/10 Extreme 99% chance of damaging wind over 30 yrs
- Air quality 2/10 Low 0 unhealthy d/yr today · 2 by 30 yrs out
Nearby sold comps map
Loading sold comps map…
Walkable amenities ~0.75 mi
Loading nearby amenities…
Taxation est. · year 1
- Rental income
- $24,436
- − Mortgage interest
- −$7,164
- − Property taxes
- −$1,918
- − Insurance
- −$640
- − Repairs & maintenance
- −$1,955
- − Management
- −$1,955
- − HOA
- −$7,632
- − Depreciation
- −$3,721
- Taxable loss
- −$549
- Est. tax savings @ 24.0%
- +$132
- After-tax cash flow
- $1,198/yr
For passive investors: Depreciation is non-cash, so a rental often shows a tax loss while cash-flowing — sheltering income. Rental losses are passive: they offset passive income freely, and up to $25,000/yr can offset ordinary (W-2) income if you actively participate and your MAGI is under $100k (phasing out to $0 by $150k); unused losses carry forward. On sale, claimed depreciation is recaptured at up to 25%, and gains may owe capital-gains tax (a 1031 exchange can defer both). Figures are a year-1 estimate at your 24.0% rate — not tax advice; consult a CPA.
Condition & rehab AI · 2 photos
This well-maintained and recently renovated condo is in good condition with a good condition score of 80. It has a good exterior and interior appearance, and the kitchen and bathrooms are in good condition. The home is ready for a new owner and would benefit from some cosmetic updates to further enhance its value.
Value-add opportunities
- Both Painting the exterior and interior walls — Fresh paint can enhance the curb appeal and interior aesthetics.
- Both Landscaping the front yard — A well-maintained front yard can improve the home's curb appeal and rental value.
- Both Updating the flooring in the bathrooms — Modern flooring can improve the look and feel of the bathrooms, enhancing both resale and rental value.
Renovation cost estimate screening
Value-add ROI direction
- Both Painting the exterior and interior walls — Fresh paint can enhance the curb appeal and interior aesthetics. ↑
- Both Landscaping the front yard — A well-maintained front yard can improve the home's curb appeal and rental value. ↑
- Both Updating the flooring in the bathrooms — Modern flooring can improve the look and feel of the bathrooms, enhancing both resale and rental value. ↑
ⓘ Cost ranges are severity-bucket heuristics (US national rule-of-thumb). Get contractor quotes + a written scope before underwriting a rehab budget.
Schools (NCES district)
- District
- Palm Beach
- NCES district ID
- 1201500
- Math proficiency
- 46% ▼ -16.00%
- Reading proficiency
- 53% ▼ -4.00%
- Median HH income
- $53,943
- Composite
- 42.72/100
- National rank
- #3160
- State rank
- #34 of 73 in FL
Livability — Boynton Beach
- Score
- 72/100
- State rank
- #351
- US rank
- #6098
Category grades
Schools grade is shown separately in the Schools card above.
Census & demographics
- Census place
- Boynton Beach, FL
- County
- Palm Beach County · 1,438,312 people
- City population
- 148,060
- Metro
- Miami-Fort Lauderdale-Pompano Beach, FL
- Population (ZIP)
- 37,833
- Household income
- $67,979
- Rent vs Own
- Severe rent burden
- 1623.0
Population outlook (Palm Beach County) Hauer SSP2
- Today (2025)
- 1,637,487 people
- By 2030
- 1,743,255 · +6.5%
- By 2040
- 1,948,712 · +19.0%
- By 2050
- 2,132,979 · +30.3%
- By 2075
- 2,530,027 · +54.5%
- By 2100
- 2,706,979 · +65.3%
Race, ethnicity, and origin ACS 2023
- Neighborhood character
- Diverse neighborhood (Simpson 0.65)
- Race & ethnicity
- White 41% Black 40% Hispanic / Latino 15% Two or more races 10%
- Hispanic origin (detail)
- Mexican 3% Puerto Rican 3% Cuban 2% Dominican 1%
- Common ancestry
- Hispanic 23% Romanian 2% Lithuanian 2%
- Foreign-born
- 30% · Canada, Jamaica
- Languages at home
- 61% English-only · French/Haitian/Cajun 24% Spanish 11% Other Indo-European 2%
Political lean MEDSL · Palm Beach
- 2024 margin
- Toss-up / Even · D 50.0% · R 49.2%
- 2008→2024 swing
- -22.1pp toward R · 2008: 22.9pp · 2024: 0.8pp
- All cycles
- 2024: D+0.8 2020: D+12.8 2016: D+15.3 2012: D+17.0 2008: D+22.9
Not yet ingested
- Civics
- —
Market trends
- HPI YoY
- ▼ -345.86%
- Current HPI
- 371.0527
- Rent YoY
- ▲ 3.64%
- Metro
- Miami-Fort Lauderdale-Pompano Beach, FL
- State GDP YoY
- ▲ 3.28%
- F500 in state
- 36
Industry mix (Fortune 500 HQ in FL)
| Industry | F500 HQs | Revenue |
|---|---|---|
| Industrial Technology | 2 | $29B |
|
||
| Insurance | 2 | $17B |
|
||
| Retail | 1 | $60B |
|
||
| Technology Distribution | 1 | $58B |
|
||
| Homebuilding | 1 | $35B |
|
||
| Technology Manufacturing | 1 | $35B |
|
||
Price history
+85.6% since first listed3 events — show timeline
- 2026-06-08 Listed $129,900 FSBO.com
- 2014-10-15 Listing Removed — Beaches MLS
- 2006-10-05 Listed $70,000 Beaches MLS
Cash-flow waterfall
monthlySold comps — $/sqft
last 12 mo · ≤1 miLoading sold comps…