 Duplex
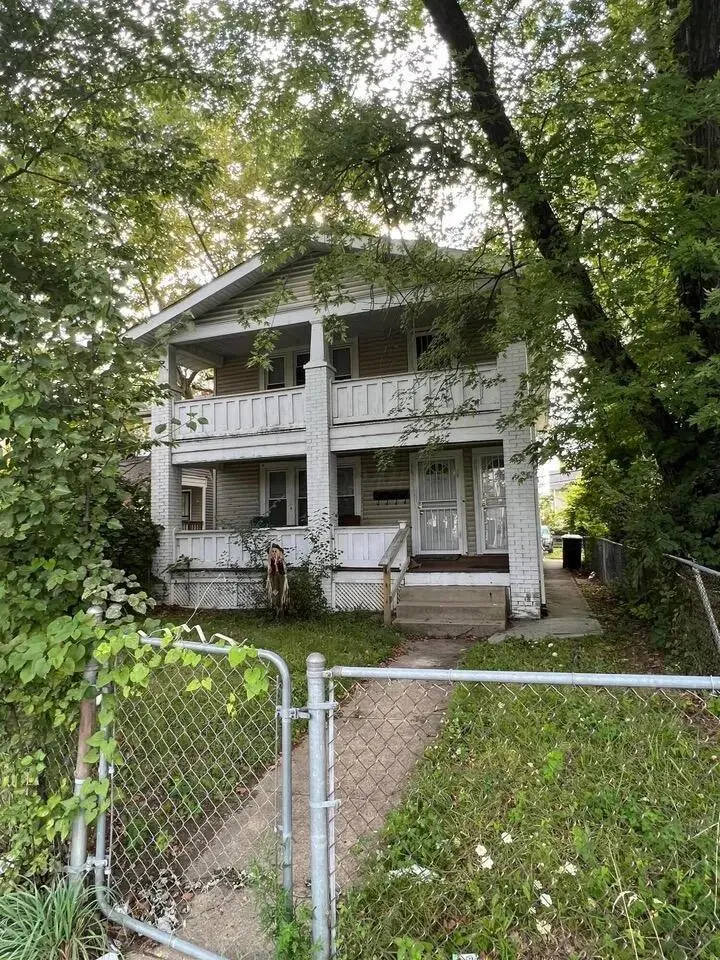
1673 Cleveland Ave · Columbus, OH
Flood risk 1/10 · Minimal
- FEMA flood zone
- X (unshaded)
- Chance of flooding over 30 yrs
- 0.0%
- Est. flood insurance / yr
- $473 – $860
Fire risk 1/10 · Minimal
- Est. fire insurance / yr
- $713 – $1,323
Heat risk 3/10 · Minor
- Hot days now (above 100°F)
- 7 days/yr
- Hot days in 30 yrs
- 16 days/yr
Wind risk 2/10 · Minimal
- Chance of severe wind over 30 yrs
- 1.0%
Air-quality risk 3/10 · Minor
- Unhealthy air days now
- 2 days/yr
- Unhealthy air days in 30 yrs
- 4 days/yr
Risk factors via First Street. Map © Google.
Why this score? — see what drove the B- grade
The composite is a weighted blend of 9 inputs, each scored 0–100. Each bar is that input's sub-score; the figure is the points it added to the 100-point composite (weight × sub-score).
- Cash flow +29.1/30.0
- DSCR +10.0/10.0
- ARV discount +9.8/15.0
- 1% rule +8.7/10.0
- Livability +4.0/5.0
- Rent growth +3.4/5.0
- Condition / age +2.5/5.0
- Schools +1.7/10.0
- Appreciation +0.0/10.0
$189,900
🖨 Deal sheet 📄 Offer letter ✓ Due diligence
Multi-family units
County records classify this as Multi-Family (2-4 Unit). Listing-text estimate: 2 units. confirmed
Listing remarks MLS
INVESTMENT OPPORTUNITY!! This 2-unit Duplex features 3 Bedrooms, 1 full bathroom and 2208 sqft. Selling As-Is. Curb Offers Only. DO NOT disturb tenants. Agents, please see A2A remarks
Key facts
- 4,356 sq ft lot
- 2 parking spots
- Built 1922
Neighborhood map
What this means for you Summary
Snapshot
- This is a 2 × 3-bed/1-bath units multifamily listed at $190k.
Deal economics
- At list price, monthly cash flow is $659 ($8k/yr) — positive. Per door: $329/mo.
- The deal already cash-flows at list — no discount required.
- Meets the 1% rule at list price ($3k rent vs $190k).
- Recommended offer: $167k (12.0% below list) — sets the bar for market timing.
- Cap rate 10.5% vs local median 3.8% in Columbus — top-decile yield for the area; either an underpriced asset or a hidden risk that comps aren't pricing in. Stress-test before assuming the spread holds.
Location & tenants
- Location reads 81/100 on livability (#97 in OH, #1,491 nationally) — a professional / high-income tenant draw. Strengths: commute A+, cost of living A+, housing A+; Watch: employment C-, crime F.
- Columbus City School District (urban): math 15% / reading 26% proficiency, ranked #626 of 656 in OH (top 95%) — low school quality limits family demand, transient renter base, plan for 1-2y turnover; 72% free/reduced lunch — lower-income household profile, screen leases tightly.
- Market conditions: Rents rising (+3.4%/yr); 166 active listings in the ZIP; 6 comparable units currently listed for rent nearby; rentals lingering (median 44d on market — plan ~5-8 weeks vacancy on turnover, expect pricing pressure); 83% of comp listings sitting > 30 days — soft ceiling on asking rent; lower-income renter base — watch delinquency; 8,139 units permitted in Franklin County in 2024 (5,940 in 5+ unit buildings).
- At $2,595/mo this rent would consume 73% of the median local household income ($43k/yr) (locally 1282% of renters already pay >50% of income on rent) — very limited rent-growth headroom before tenants either downsize or default.
Forward outlook
- Local home prices are declining (-3.0%/yr); year-one equity from $1k of loan paydown is wiped out by about $6k of value loss. Plan a longer hold.
- Franklin County population projected at +34% by 2050 — long-run rental-demand tailwind backs the buy-and-hold thesis.
- At projected returns (-3.0% appreciation + 3.4% rent growth), your $53k cash investment doubles in ~8 years — after that, you're playing with house money.
Negotiation context
- It's been on market 136 days — a 12% lower offer ($167k) is reasonable based on typical stale-listing flexibility.
- 4 sale attempts since 4y ago with the ask held roughly flat each time — persistent listings suggest the price (not the market) is what's stuck; bring a comps-based counter.
Risks & watch-outs
- Watch-outs: built in 1922 — expect roof / HVAC / electrical / plumbing capex.
Questions for the listing agent
- It's been on market 136 days. Have you received any prior offers? Is the seller open to a 12% concession, seller financing, or rate buy-down credit?
- Can we see the unit-by-unit rent roll, current vacancy, and any below-market leases? What's the average tenancy length?
- What capital expenditures (roof, boiler, parking lot, exteriors) have been made in the last 5 years, and what's planned in the next 2?
- Built in 1922 — when were the roof, HVAC, electrical panel, plumbing, and water heater last replaced?
- Why hasn't it sold? Are there any deal-killer items the seller is aware of (foundation, flood, title, zoning, code violations)?
- Is there a deadline driving the sale (1031 exchange, divorce, estate, relocation)? That informs how much negotiation room exists.
- Crime grade is F in this area — have there been break-ins, vandalism, or insurance claims at this property in the last 3 years? What carrier currently insures it and at what premium?
- What's the average days-on-market for RENTAL listings here right now (not sales)? A rising rental-DOM trend means longer vacancies and softer asking-rent achievability than the comps imply.
- What's the recent tenant-quality profile in this submarket — average credit score on applications, eviction rate, late-payment / NSF rate, and stable-employment percentage? A property-management company in the area should have these aggregated.
- How much new apartment / multifamily construction is in the pipeline within 1–3 miles? Heavy new supply (>2% of stock underway) typically softens rents 12–24 months out; light construction supports rent growth.
Investment metrics
- 1% rule
- 1.37% ✓
- Cap rate
- 10.46%
- Cash-on-cash
- 14.86%
- DSCR
- 1.66
- GRM
- 6.1
CMA / ARV
- ARV (median comp)
- $199,930
- List price
- $189,900
- Delta
- -5.02%
- Verdict
- FAIR
- Comps
- 20 within 1.0 mi
Show comp detail 12 sales within ~0.75 mi
| Address | Dist | Beds/Ba | Sqft | Sold | Price | $/sf | Match |
|---|---|---|---|---|---|---|---|
| 1315 E 18th Ave | 0.21mi | 6/— | 2,240 (+1%) | 1mo | $239,900 | $107 | 87 |
| 1088-1090 E 14th Ave | 0.16mi | 6/— | 2,240 (+1%) | 4mo | $235,000 | $105 | 86 |
| 1092 E 15th Ave | 0.12mi | 6/— | 2,376 (+8%) | 4mo | $238,000 | $100 | 78 |
| 1082-1084 E 17th Ave | 0.13mi | 6/— | 2,352 (+6%) | 7mo | $179,000 | $76 | 77 |
| 1361-1363 E 18th Ave | 0.28mi | 6/— | 2,240 (+1%) | 10mo | $230,000 | $103 | 76 |
| 1089 E 21st Ave | 0.31mi | 6/— | 2,240 (+1%) | 9mo | $250,000 | $112 | 75 |
| 1273-1275 E 18th Ave | 0.16mi | 6/— | 2,408 (+9%) | 6mo | $120,000 | $50 | 73 |
| 914-916 E 17th Ave | 0.38mi | 6/— | 2,352 (+6%) | 3mo | $175,000 | $74 | 69 |
| 1294-1296 E 23rd Ave | 0.42mi | 6/— | 2,268 (+3%) | 9mo | $202,500 | $89 | 69 |
| 1261-1263 E 23rd Ave | 0.38mi | 6/— | 2,352 (+6%) | 4mo | $230,000 | $98 | 68 |
| 849-851 E 12th Ave #851 | 0.51mi | 6/— | 2,184 (-1%) | 11mo | $142,000 | $65 | 65 |
| 1254 E 20th Ave #1256 | 0.25mi | 6/— | 2,492 (+13%) | 11mo | $269,000 | $108 | 58 |
Match score weights: distance 35% · size 25% · config 20% · recency 20%. Top-matched comps best support the ARV.
Projected returns pro-forma
-3.0% appreciation · 3.41% rent growth · sell at horizon
- IRR
- 5.9%
- Equity multiple
- 1.23×
- Total profit
- $12,341
- Equity at exit
- $28,315
- IRR
- 15.7%
- Equity multiple
- 2.31×
- Total profit
- $69,569
- Equity at exit
- $16,419
Cash invested: $53,172 (down + closing). Projections, not guarantees.
Landlord ↔ Tenant lean methodology
- Overall (STATE)
- 73 Landlord-Friendly
- State Ohio
- 73 Landlord-Friendly · R+6
- County
- — inherits STATE
- City
- — inherits STATE
ZIP-level market 43211
- Home prices YoY
- -27.3%
- Rents YoY
- 3.4%
- Active inventory
- 166
- Price-to-rent
- 12.2×
Monthly cashflow live
- Estimated rent
- $2,595 high interval (Pro) →
- Mortgage (P&I)
- −$996
- Tax from tax record
- −$316 /mo · $3,797/yr
- Insurance
- −$79
- HOA
- −$0
- Vacancy / Maint / Mgmt
- −$545
- Net cashflow
- $659
Break-even live
2-unit breakdown (identical units grouped — click to expand)
| Units | Beds | Baths | Est. rent |
|---|---|---|---|
| 2× units | 3 | 1 | $2,596 |
| #1 | 3 | 1 | $1,298 |
| #2 | 3 | 1 | $1,298 |
| Total (2 units) | $2,595 | ||
UW: 25.0% down · 7.5% · 30yr · 1.5% tax · 5.0% vac · 8.0% maint · 8.0% mgmt
Financing live
Cash to close
- Down payment
- $47,475
- Closing costs
- $5,697
- Reserves months
- —
- Total cash needed
- —
Loan-product check · same deal, 3 products live
Conventional
25% down · 7.5% · 30yr
- Down + closing
- —
- Monthly P&I
- —
- Monthly cashflow
- —
- DSCR
- —
- Eligible?
- —
Personal DTI + credit; lowest rate.
DSCR
20% down · 8.5% · 30yr
- Down + closing
- —
- Monthly P&I
- —
- Monthly cashflow
- —
- DSCR
- —
- Eligible?
- —
No personal income docs; deal must DSCR.
Hard money
10% down · 12.0% · 12mo
- Down + closing
- —
- Monthly P&I
- —
- Monthly cashflow
- —
- DSCR
- —
- Eligible?
- —
Short-term bridge; refi at stabilization.
Rent comps 6 comps
| Address | Beds | Baths | Sqft | Rent | $/sqft | DOM | Units | Dist |
|---|---|---|---|---|---|---|---|---|
| 2453 McGuffey Rd Columbus, OH | 5.0 | 3.0 | 1782 | $2,200 | $1.23 | 43d | 1 | 1.13mi |
| 321 E 17th Ave Columbus, OH | 6.0 | 3.0 | 2300 | $3,200 | $1.39 | 43d | 1 | 1.25mi |
| 2027 N 4th St Columbus, OH | 5.0 | 2.0 | 1660 | $2,000 | $1.20 | 43d | 1 | 1.25mi |
| 356 E 20th Ave Columbus, OH | 5.0 | 3.0 | 2547 | $3,000 | $1.18 | 43d | 1 | 1.27mi |
| 2040 Iuka Ave Columbus, OH | 1.0–5.0 | 1.0–2.5 | 3000 | $3,250 | $1.08 | 14d | 3 | 1.40mi |
| 2158 Indiana Ave Columbus, OH | 5.0 | 2.0 | 1698 | $2,000 | $1.18 | 43d | 1 | 1.45mi |
Listing history 22 events
-
2026-06-18days on market $189,900 Active 136 DOM
-
2026-06-17days on market $189,900 Active 135 DOM
-
2026-06-16days on market $189,900 Active 134 DOM
-
2026-06-15days on market $189,900 Active 133 DOM
-
2026-06-13days on market $189,900 Active 131 DOM
-
2026-06-13days on market $189,900 Active 130 DOM
-
2026-06-09days on market $189,900 Active 127 DOM
-
2026-06-08days on market $189,900 Active 126 DOM
-
2026-06-07days on market $189,900 Active 125 DOM
-
2026-06-05days on market $189,900 Active 122 DOM
-
2026-06-03days on market $189,900 Active 121 DOM
-
2026-06-02days on market $189,900 Active 120 DOM
-
2026-06-01days on market $189,900 Active 119 DOM
-
2026-05-31days on market $189,900 Active 118 DOM
-
2026-02-11status Active 183-char remark
Show marketing remark (183 chars)
INVESTMENT OPPORTUNITY!! This 2-unit Duplex features 3 Bedrooms, 1 full bathroom and 2208 sqft. Selling As-Is. Curb Offers Only. DO NOT disturb tenants. Agents, please see A2A remarks
-
2026-02-05historical Contingent 183-char remark
Show marketing remark (183 chars)
INVESTMENT OPPORTUNITY!! This 2-unit Duplex features 3 Bedrooms, 1 full bathroom and 2208 sqft. Selling As-Is. Curb Offers Only. DO NOT disturb tenants. Agents, please see A2A remarks
-
2026-02-02$189,900 Active 183-char remark
Show marketing remark (183 chars)
INVESTMENT OPPORTUNITY!! This 2-unit Duplex features 3 Bedrooms, 1 full bathroom and 2208 sqft. Selling As-Is. Curb Offers Only. DO NOT disturb tenants. Agents, please see A2A remarks
-
2022-10-17soldstatus $270,000
-
2022-10-07status Active 213-char remark
Show marketing remark (213 chars)
INVESTMENT OPPORTUNITY!! This 2-unit Duplex features 3 Bedrooms, 1 full bathroom and 2208 sqft. Property does need some TLC! Selling As-Is. Curb Offers Only. DO NOT disturb tenants. Agents, please see A2A remarks
-
2022-10-07soldstatus $135,000 Closed 213-char remark
Show marketing remark (213 chars)
INVESTMENT OPPORTUNITY!! This 2-unit Duplex features 3 Bedrooms, 1 full bathroom and 2208 sqft. Property does need some TLC! Selling As-Is. Curb Offers Only. DO NOT disturb tenants. Agents, please see A2A remarks
-
2022-09-14historical Contingent Finance and Inspection 213-char remark
Show marketing remark (213 chars)
INVESTMENT OPPORTUNITY!! This 2-unit Duplex features 3 Bedrooms, 1 full bathroom and 2208 sqft. Property does need some TLC! Selling As-Is. Curb Offers Only. DO NOT disturb tenants. Agents, please see A2A remarks
-
2022-09-14$138,000 Active 213-char remark
Show marketing remark (213 chars)
INVESTMENT OPPORTUNITY!! This 2-unit Duplex features 3 Bedrooms, 1 full bathroom and 2208 sqft. Property does need some TLC! Selling As-Is. Curb Offers Only. DO NOT disturb tenants. Agents, please see A2A remarks
ⓘ Source: listings_history table (triggers on properties + properties_extension) + one-shot
backfill from property_details.listing_events for pre-trigger history.
Tax reassessment forecast OH · Partial reset (capped growth)
- Current annual tax
- $3,797 · $316/mo
- Projected year-2 tax
- $3,797 · $316/mo
- Expected delta
- $0/yr ($0/mo · -0.0%)
ⓘ Screening estimate from a state-policy table — verify with the county assessor before closing.
Climate risk First Street
- Flood 1/10 Low FEMA zone X (unshaded) · 0% chance over 30 yrs
- Wildfire 1/10 Low
- Heat 3/10 Moderate 7 d/yr ≥100°F today · 16 d/yr by 30 yrs out
- Wind 2/10 Low 100% chance of damaging wind over 30 yrs
- Air quality 3/10 Moderate 2 unhealthy d/yr today · 4 by 30 yrs out
Nearby sold comps map
Loading sold comps map…
Walkable amenities ~0.75 mi
Loading nearby amenities…
Taxation est. · year 1
- Rental income
- $31,140
- − Mortgage interest
- −$10,637
- − Property taxes
- −$3,797
- − Insurance
- −$950
- − Repairs & maintenance
- −$2,491
- − Management
- −$2,491
- − Depreciation
- −$5,524
- Taxable income
- $5,250
- Est. tax owed @ 24.0%
- −$1,260
- After-tax cash flow
- $6,644/yr
For passive investors: Depreciation is non-cash, so a rental often shows a tax loss while cash-flowing — sheltering income. Rental losses are passive: they offset passive income freely, and up to $25,000/yr can offset ordinary (W-2) income if you actively participate and your MAGI is under $100k (phasing out to $0 by $150k); unused losses carry forward. On sale, claimed depreciation is recaptured at up to 25%, and gains may owe capital-gains tax (a 1031 exchange can defer both). Figures are a year-1 estimate at your 24.0% rate — not tax advice; consult a CPA.
Schools (NCES district)
- District
- Columbus City School District
- NCES district ID
- 3904380
- Math proficiency
- 15% ▼ -17.00%
- Reading proficiency
- 26% ▼ -12.00%
- Median HH income
- $38,483
- Composite
- 17.19/100
- National rank
- #9105
- State rank
- #626 of 656 in OH
Livability — Columbus
- Score
- 81/100
- State rank
- #97
- US rank
- #1491
Category grades
Schools grade is shown separately in the Schools card above.
Census & demographics
- Census place
- Columbus, OH
- County
- Franklin County · 1,351,780 people
- City population
- 612,189
- Metro
- Columbus, OH
- Population (ZIP)
- 22,313
- Household income
- $42,579
- Rent vs Own
- Severe rent burden
- 1282.0
Population outlook (Franklin County) Hauer SSP2
- Today (2025)
- 1,456,139 people
- By 2030
- 1,556,890 · +6.9%
- By 2040
- 1,757,349 · +20.7%
- By 2050
- 1,950,539 · +34.0%
- By 2075
- 2,376,171 · +63.2%
- By 2100
- 2,636,796 · +81.1%
Race, ethnicity, and origin ACS 2023
- Neighborhood character
- Diverse neighborhood (Simpson 0.60)
- Race & ethnicity
- Black 58% White 21% Hispanic / Latino 13% Two or more races 12% Asian 2%
- Hispanic origin (detail)
- Mexican 8% Dominican 1%
- Common ancestry
- Italian 1%
- Foreign-born
- 10% · Canada, India
- Languages at home
- 84% English-only · Spanish 11% Other Indo-European 2% Arabic 1%
Political lean MEDSL · Franklin
- 2024 margin
- Strong D (+28.4) · D 63.7% · R 35.3% · Other 1.0%
- 2008→2024 swing
- +7.7pp toward D · 2008: 20.7pp · 2024: 28.4pp
- All cycles
- 2024: D+28.4 2020: D+31.4 2016: D+25.9 2012: D+21.7 2008: D+20.7
Not yet ingested
- Civics
- —
Market trends
- HPI YoY
- ▼ -94.10%
- Current HPI
- 250.3885
- Rent YoY
- ▲ 3.41%
- Metro
- Columbus, OH
- State GDP YoY
- ▲ 1.98%
- F500 in state
- 48
Industry mix (Fortune 500 HQ in OH)
| Industry | F500 HQs | Revenue |
|---|---|---|
| Insurance | 3 | $145B |
|
||
| Industrial Machinery | 3 | $49B |
|
||
| Financial Services | 3 | $24B |
|
||
| Consumer Goods | 2 | $93B |
|
||
| Aerospace / Defense | 2 | $47B |
|
||
| Utilities | 2 | $33B |
|
||
Price history
+37.6% since first listed8 events — show timeline
- 2026-02-11 Relisted — CBRMLS
- 2026-02-05 Contingent — CBRMLS
- 2026-02-02 Listed $189,900 CBRMLS
- 2022-10-17 Sold (Public Records) $270,000 Public Records
- 2022-10-07 Relisted — CBRMLS
- 2022-10-07 Sold (MLS) $135,000 CBRMLS
- 2022-09-14 Contingent — CBRMLS
- 2022-09-14 Listed $138,000 CBRMLS
Property tax history
+25.1%/yrLatest (2024): $3,797 · +1.3% YoY. Source: county tax records.
Cash-flow waterfall
monthlySold comps — $/sqft
last 12 mo · ≤1 miLoading sold comps…