4847 Whitmore · Nipinnawasee, CA
Flood risk 9/10 · Severe
- FEMA flood zone
- X (unshaded)
- Chance of flooding over 30 yrs
- 0.99%
- Est. flood insurance / yr
- $507 – $1,088
Fire risk 8/10 · Major
- Est. fire insurance / yr
- $659 – $1,223
Heat risk 5/10 · Moderate
- Hot days now (above 102°F)
- 10 days/yr
- Hot days in 30 yrs
- 26 days/yr
Wind risk 1/10 · Minimal
- Chance of severe wind over 30 yrs
- —
Air-quality risk 10/10 · Severe
- Unhealthy air days now
- 48 days/yr
- Unhealthy air days in 30 yrs
- 55 days/yr
Risk factors via First Street. Map © Google.
Why this score? — see what drove the C+ grade
The composite is a weighted blend of 9 inputs, each scored 0–100. Each bar is that input's sub-score; the figure is the points it added to the 100-point composite (weight × sub-score).
- Cash flow +28.7/30.0
- DSCR +10.0/10.0
- ARV discount +7.5/15.0
- 1% rule +6.9/10.0
- Schools +3.0/10.0
- Rent growth +2.5/5.0
- Condition / age +2.5/5.0
- Livability +2.3/5.0
- Appreciation +0.0/10.0
$174,000
🖨 Deal sheet 📄 Offer letter ✓ Due diligence
Listing remarks MLS
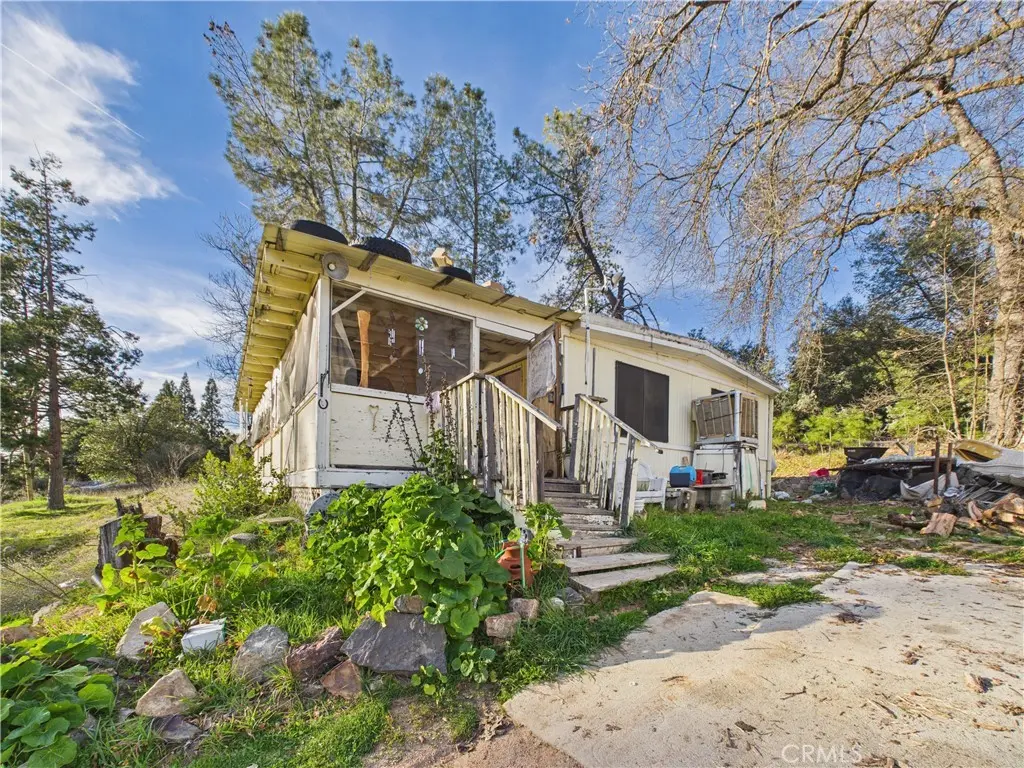
Investor special — priced to sell! 3 bed / 2 bath mobile home, approx. 1,440 sq ft, on approximately 1.21ac, offered AS-IS. This fixer-upper needs significant TLC and currently contains a large amount of trash and debris — bring your trash trailer and tools. Property also includes a garage. Great opportunity for investors or a buyer looking for a starter home to rehab and add value. Don’t miss it — schedule a showing today! Seller is VERY motivated bring ALL Offers!
Key facts
- 1.29 acre lot
- 2 garage spots
- Built 1973
Neighborhood map
What this means for you Summary
Snapshot
- This is a 3-bed/2.0-bath single-family listed at $174k.
Deal economics
- At list price, monthly cash flow is $515 ($6k/yr) — positive.
- The deal already cash-flows at list — no discount required.
- Meets the 1% rule at list price ($2k rent vs $174k).
- Recommended offer: $153k (12.0% below list) — sets the bar for market timing.
Location & tenants
- Location reads 46/100 on livability (#1,264 in CA) — a working-class tenant base; expect higher turnover. Strengths: employment B+; Watch: schools F, crime F, amenities F.
- Mariposa County Unified (rural): math 27% / reading 42% proficiency, ranked #282 of 517 in CA (top 54%) — families likely to look elsewhere, expect single-tenant / working-renter base with shorter leases.
- Market conditions: 167 active listings in the ZIP; 89 units permitted in Mariposa County in 2024 (0 in 5+ unit buildings).
Forward outlook
- Local home prices are declining (-3.0%/yr); year-one equity from $1k of loan paydown is wiped out by about $5k of value loss. Plan a longer hold.
- Mariposa County population projected at -23% by 2050 — secular population decline; favor cash flow + early exit over multi-decade hold.
- At projected returns (-3.0% appreciation + 3.0% rent growth), your $49k cash investment doubles in ~9 years — after that, you're playing with house money.
Negotiation context
- It's been on market 132 days — a 12% lower offer ($153k) is reasonable based on typical stale-listing flexibility.
- Current owner paid $65k; list at $174k implies a 168% gain — meaningful room to come down on a strong offer.
Risks & watch-outs
- Watch-outs: flood insurance adds $66/mo.
- Climate carrying-cost: severe flood risk; severe wildfire risk; extreme-heat days projected 10→26/yr by 2055 (HVAC capex compounding) — expect insurance premiums to compound above CPI over the hold.
Questions for the listing agent
- It's been on market 132 days. Have you received any prior offers? Is the seller open to a 12% concession, seller financing, or rate buy-down credit?
- Built in 1973 — when were the roof, HVAC, electrical panel, plumbing, and water heater last replaced?
- What's the actual annual flood-insurance premium (NFIP or private), and is the property in a SFHA with mandatory coverage?
- Why hasn't it sold? Are there any deal-killer items the seller is aware of (foundation, flood, title, zoning, code violations)?
- Is there a deadline driving the sale (1031 exchange, divorce, estate, relocation)? That informs how much negotiation room exists.
- Schools are F-rated, which usually means shorter tenancies and higher turnover. Who's the typical renter profile here, and what's been the actual vacancy rate?
- Crime grade is F in this area — have there been break-ins, vandalism, or insurance claims at this property in the last 3 years? What carrier currently insures it and at what premium?
- What's the average days-on-market for RENTAL listings here right now (not sales)? A rising rental-DOM trend means longer vacancies and softer asking-rent achievability than the comps imply.
- What's the recent tenant-quality profile in this submarket — average credit score on applications, eviction rate, late-payment / NSF rate, and stable-employment percentage? A property-management company in the area should have these aggregated.
- How much new for-sale + rental construction is in the pipeline within 1–3 miles? Heavy new supply typically softens prices + rents 12–24 months out; constrained supply supports both.
Investment metrics
- 1% rule
- 1.19% ✓
- Cap rate
- 10.30%
- Cash-on-cash
- 14.31%
- DSCR
- 1.64
- GRM
- 7.0
CMA / ARV
No comps found within radius.
Projected returns pro-forma
-3.0% appreciation · 3.0% rent growth · sell at horizon
- IRR
- 2.4%
- Equity multiple
- 1.09×
- Total profit
- $4,558
- Equity at exit
- $25,944
- IRR
- 12.0%
- Equity multiple
- 1.95×
- Total profit
- $46,083
- Equity at exit
- $15,044
Cash invested: $48,720 (down + closing). Projections, not guarantees.
Landlord ↔ Tenant lean methodology
- Overall (STATE)
- 18 Strongly Tenant-Friendly
- State California
- 18 Strongly Tenant-Friendly · D+13
- County
- — inherits STATE
- City
- — inherits STATE
ZIP-level market 95338
- Active inventory
- 167
- Price-to-rent
- 7.0×
Monthly cashflow live
- Estimated rent
- $2,064 medium interval (Pro) →
- Mortgage (P&I)
- −$912
- Tax from tax record
- −$64 /mo · $770/yr
- Insurance
- −$72
- Flood insurance flood zone
- −$66 /mo · $798/yr
- HOA
- −$0
- Vacancy / Maint / Mgmt
- −$433
- Net cashflow
- $515
Break-even live
UW: 25.0% down · 7.5% · 30yr · 1.5% tax · 5.0% vac · 8.0% maint · 8.0% mgmt
Financing live
Cash to close
- Down payment
- $43,500
- Closing costs
- $5,220
- Reserves months
- —
- Total cash needed
- —
Loan-product check · same deal, 3 products live
Conventional
25% down · 7.5% · 30yr
- Down + closing
- —
- Monthly P&I
- —
- Monthly cashflow
- —
- DSCR
- —
- Eligible?
- —
Personal DTI + credit; lowest rate.
DSCR
20% down · 8.5% · 30yr
- Down + closing
- —
- Monthly P&I
- —
- Monthly cashflow
- —
- DSCR
- —
- Eligible?
- —
No personal income docs; deal must DSCR.
Hard money
10% down · 12.0% · 12mo
- Down + closing
- —
- Monthly P&I
- —
- Monthly cashflow
- —
- DSCR
- —
- Eligible?
- —
Short-term bridge; refi at stabilization.
Listing history 20 events
-
2026-06-19days on market $174,000 Active 132 DOM
-
2026-06-18days on market $174,000 Active 131 DOM
-
2026-06-17days on market $174,000 Active 130 DOM
-
2026-06-16days on market $174,000 Active 129 DOM
-
2026-06-15days on market $174,000 Active 128 DOM
-
2026-06-14days on market $174,000 Active 126 DOM
-
2026-06-13days on market $174,000 Active 125 DOM
-
2026-06-10days on market $174,000 Active 123 DOM
-
2026-06-09days on market $174,000 Active 122 DOM
-
2026-06-08days on market $174,000 Active 121 DOM
-
2026-06-07days on market $174,000 Active 120 DOM
-
2026-06-05days on market $174,000 Active 117 DOM
-
2026-06-03days on market $174,000 Active 116 DOM
-
2026-06-02days on market $174,000 Active 115 DOM
-
2026-06-01days on market $174,000 Active 114 DOM
-
2026-05-31days on market $174,000 Active 113 DOM
-
2026-05-30days on market $174,000 Active 112 DOM
-
2026-03-08price $174,000 494-char remark
Show marketing remark (494 chars)
Investor special — priced to sell! 3 bed / 2 bath mobile home, approx. 1,440 sq ft, on approximately 1.21ac, offered AS-IS. This fixer-upper needs significant TLC and currently contains a large amount of trash and debris — bring your trash trailer and tools. Property also includes a garage. Great opportunity for investors or a buyer looking for a starter home to rehab and add value. Don’t miss it — schedule a showing today! Seller is VERY motivated bring ALL Offers!
-
2026-02-07$189,000 Active 494-char remark
Show marketing remark (494 chars)
Investor special — priced to sell! 3 bed / 2 bath mobile home, approx. 1,440 sq ft, on approximately 1.21ac, offered AS-IS. This fixer-upper needs significant TLC and currently contains a large amount of trash and debris — bring your trash trailer and tools. Property also includes a garage. Great opportunity for investors or a buyer looking for a starter home to rehab and add value. Don’t miss it — schedule a showing today! Seller is VERY motivated bring ALL Offers!
-
2002-09-13soldstatus $65,000
ⓘ Source: listings_history table (triggers on properties + properties_extension) + one-shot
backfill from property_details.listing_events for pre-trigger history.
Tax reassessment forecast CA · Resets to sale price
- Current annual tax
- $770 · $64/mo
- Projected year-2 tax
- $1,322 · $110/mo
- Expected delta
- +$553/yr (+$46/mo · 71.8%)
ⓘ Screening estimate from a state-policy table — verify with the county assessor before closing.
Climate risk First Street
- Flood 9/10 Extreme FEMA zone X (unshaded) · 99% chance over 30 yrs
- Wildfire 8/10 Severe
- Heat 5/10 Major 10 d/yr ≥102°F today · 26 d/yr by 30 yrs out
- Wind 1/10 Low
- Air quality 10/10 Extreme 48 unhealthy d/yr today · 55 by 30 yrs out
Nearby sold comps map
Loading sold comps map…
Walkable amenities ~0.75 mi
Loading nearby amenities…
Taxation est. · year 1
- Rental income
- $24,763
- − Mortgage interest
- −$9,747
- − Property taxes
- −$770
- − Insurance
- −$1,667
- − Repairs & maintenance
- −$1,981
- − Management
- −$1,981
- − Depreciation
- −$5,062
- Taxable income
- $3,555
- Est. tax owed @ 24.0%
- −$853
- After-tax cash flow
- $5,322/yr
For passive investors: Depreciation is non-cash, so a rental often shows a tax loss while cash-flowing — sheltering income. Rental losses are passive: they offset passive income freely, and up to $25,000/yr can offset ordinary (W-2) income if you actively participate and your MAGI is under $100k (phasing out to $0 by $150k); unused losses carry forward. On sale, claimed depreciation is recaptured at up to 25%, and gains may owe capital-gains tax (a 1031 exchange can defer both). Figures are a year-1 estimate at your 24.0% rate — not tax advice; consult a CPA.
Schools (NCES district)
- District
- Mariposa County Unified
- NCES district ID
- 0623940
- Math proficiency
- 27% ▼ -12.00%
- Reading proficiency
- 42% ▼ -5.00%
- Median HH income
- $48,669
- Composite
- 29.75/100
- National rank
- #6438
- State rank
- #282 of 517 in CA
Livability — Nipinnawasee
- Score
- 46/100
- State rank
- #1264
- US rank
- #26405
Category grades
Schools grade is shown separately in the Schools card above.
Census & demographics
- City population
- 1,248
- Population (ZIP)
- 10,164
Population outlook (Mariposa County) Hauer SSP2
- Today (2025)
- 15,956 people
- By 2030
- 15,078 · -5.5%
- By 2040
- 13,413 · -15.9%
- By 2050
- 12,232 · -23.3%
- By 2075
- 11,143 · -30.2%
- By 2100
- 10,187 · -36.2%
Race, ethnicity, and origin ACS 2023
- Neighborhood character
- Predominantly White (81%)
- Race & ethnicity
- White 81% Two or more races 9% Hispanic / Latino 9% Native American 2% Asian 2%
- Hispanic origin (detail)
- Mexican 7%
- Common ancestry
- Lithuanian 5% Italian 4% Russian 2%
- Foreign-born
- 4% · Canada, China
- Languages at home
- 95% English-only · Spanish 2% French/Haitian/Cajun 1% Chinese 1%
Political lean MEDSL · Mariposa
- 2024 margin
- Strong R (+21.1) · D 38.1% · R 59.1% · Other 2.8%
- 2008→2024 swing
- -8.6pp toward R · 2008: -12.4pp · 2024: -21.1pp
- All cycles
- 2024: R+21.1 2020: R+18.1 2016: R+23.2 2012: R+17.4 2008: R+12.4
Not yet ingested
- Civics
- —
Market trends
- HPI YoY
- ▼ -151.82%
- Current HPI
- 140.3045
- Rent YoY
- —
- Metro
- —
- State GDP YoY
- ▲ 3.21%
- F500 in state
- 116
Industry mix (Fortune 500 HQ in CA)
| Industry | F500 HQs | Revenue |
|---|---|---|
| Technology | 27 | $1,492B |
|
||
| Financial Services | 3 | $174B |
|
||
| Retail | 3 | $44B |
|
||
| Insurance | 3 | $26B |
|
||
| Media / Entertainment | 2 | $115B |
|
||
| Pharmaceuticals / Biotech | 2 | $62B |
|
||
Price history
+167.7% since first listed3 events — show timeline
- 2026-03-08 Price Changed $174,000 CRMLS
- 2026-02-07 Listed $189,000 CRMLS
- 2002-09-13 Sold (Public Records) $65,000 Public Records
Property tax history
+1.3%/yrLatest (2025): $770 · +2.8% YoY. Source: county tax records.
Cash-flow waterfall
monthlySold comps — $/sqft
last 12 mo · ≤1 miLoading sold comps…