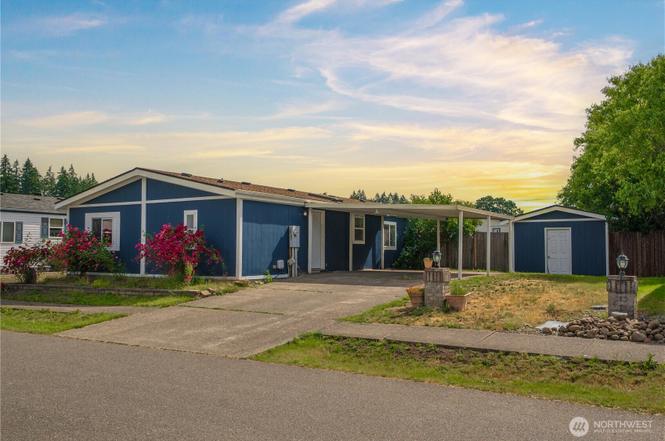
20307 77th Ave E #32 · Frederickson, WA
Flood risk 1/10 · Minimal
- FEMA flood zone
- X (unshaded)
- Chance of flooding over 30 yrs
- 0.0%
- Est. flood insurance / yr
- $507 – $1,088
Fire risk 1/10 · Minimal
- Est. fire insurance / yr
- $604 – $1,122
Heat risk 3/10 · Minor
- Hot days now (above 87°F)
- 7 days/yr
- Hot days in 30 yrs
- 15 days/yr
Wind risk 1/10 · Minimal
- Chance of severe wind over 30 yrs
- —
Air-quality risk 7/10 · Major
- Unhealthy air days now
- 10 days/yr
- Unhealthy air days in 30 yrs
- 10 days/yr
Risk factors via First Street. Map © Google.
Why this score? — see what drove the B- grade
The composite is a weighted blend of 9 inputs, each scored 0–100. Each bar is that input's sub-score; the figure is the points it added to the 100-point composite (weight × sub-score).
- Cash flow +30.0/30.0
- DSCR +10.0/10.0
- 1% rule +9.9/10.0
- Schools +4.9/10.0
- Livability +3.7/5.0
- Rent growth +3.6/5.0
- Condition / age +2.5/5.0
- ARV discount +2.0/15.0
- Appreciation +0.0/10.0
$210,000
🖨 Deal sheet 📄 Offer letter ✓ Due diligence
Listing remarks
Move-in ready and beautifully refreshed! This 4-bedroom home features a private primary suite with en-suite bath, thoughtfully separated from the remaining bedrooms for added privacy. Enjoy major upgrades including a newer roof and electrical panel, new flooring, new carpet, and fresh interior and exterior paint. The oversized fully fenced yard offers endless possibilities for gardening, recreation, or relaxing outdoors, while the large storage shed and two covered carport spaces provide plenty of practical storage and parking. Conveniently located within walking distance of schools in a friendly, established community.
Key facts
- New carpet
- Newer roof
- New flooring
Tags
Property features AI
Finance
- Other: Property type: Residential manufactured home; Double wide body type
- Financial info: Land lease: $854 (monthly); Listing terms: Cash or Conventional
- HOA & community: Located in Cascade Green manufactured home park; Park amenities include sidewalks; Land lease required
Exterior
- Parking: Carport
- Utilities: Electric power; Public water; Public sewer
- Home design: Manufactured double-wide home; One level; Entry level: Main
- Construction: Composition roof; Tie-down foundation; Manufactured after 06/15/1976
- Exterior features: Paved lot; Sidewalks; Has view
Interior
- Kitchen: Kitchen with eating space
- Bedrooms: 4 bedrooms
- Flooring: Laminate flooring; Vinyl plank flooring; Carpet
- Bathrooms: 2 full bathrooms; Primary bath with direct access to tub
- Heating & cooling: Forced air heating; Forced air cooling
- Interior features: Kitchen with eating space; Living room; Utility room; Jetted/soaking tub; Walk-in closet
- Laundry & utility: Utility room
Neighborhood map
What this means for you Summary
Snapshot
- This is a 3-bed/2.0-bath manufactured listed at $210k.
Deal economics
- At list price, monthly cash flow is $1k ($13k/yr) — positive.
- The deal already cash-flows at list — no discount required.
- Meets the 1% rule at list price ($3k rent vs $210k).
- Cap rate 12.7% vs local median 3.5% in Frederickson — top-decile yield for the area; either an underpriced asset or a hidden risk that comps aren't pricing in. Stress-test before assuming the spread holds.
Location & tenants
- Location reads 73/100 on livability (#197 in WA) — a middle-class / working-renter tenant base. Strengths: employment A+, housing A+, health & safety A+; Watch: crime D+, amenities D-, commute F.
- Bethel School District (suburban): math 47% / reading 59% proficiency, ranked #103 of 291 in WA (top 35%) — acceptable for families but not a draw, mixed tenant base, ~2y average lease.
- Zoned schools: Pioneer Valley Elementary (512 students, 51% FRL); Bethel High School (1,739 students, 53% FRL) — zoned schools average 52% FRL vs 36% district-wide (15 pts higher); higher-poverty schools than district average — tighter screening recommended.
- Market conditions: Rents rising fast (+4.2%/yr); 383 active listings in the ZIP; 3 comparable units currently listed for rent nearby; rentals at typical pace (median 17d on market — plan ~3-4 weeks tenant-placement turnaround); solid renter incomes; 3,209 units permitted in Pierce County in 2024 (1,269 in 5+ unit buildings).
- This rent runs 35% of the median local income ($107k/yr) — at the standard rent-burdened threshold; future hikes will face affordability resistance.
Forward outlook
- Local home prices are declining (-3.0%/yr); year-one equity from $1k of loan paydown is wiped out by about $6k of value loss. Plan a longer hold.
- Pierce County population projected at +26% by 2050 — long-run rental-demand tailwind backs the buy-and-hold thesis.
- At projected returns (-3.0% appreciation + 4.2% rent growth), your $59k cash investment doubles in ~6 years — after that, you're playing with house money.
Negotiation context
- Only 1 days on market — expect competitive offers; lowballing is unlikely to land.
Questions for the listing agent
- Is there a deadline driving the sale (1031 exchange, divorce, estate, relocation)? That informs how much negotiation room exists.
- Schools are F-rated, which usually means shorter tenancies and higher turnover. Who's the typical renter profile here, and what's been the actual vacancy rate?
- Crime grade is D in this area — have there been break-ins, vandalism, or insurance claims at this property in the last 3 years? What carrier currently insures it and at what premium?
- What's the average days-on-market for RENTAL listings here right now (not sales)? A rising rental-DOM trend means longer vacancies and softer asking-rent achievability than the comps imply.
- What's the recent tenant-quality profile in this submarket — average credit score on applications, eviction rate, late-payment / NSF rate, and stable-employment percentage? A property-management company in the area should have these aggregated.
- How much new for-sale + rental construction is in the pipeline within 1–3 miles? Heavy new supply typically softens prices + rents 12–24 months out; constrained supply supports both.
Investment metrics
- 1% rule
- 1.49% ✓
- Cap rate
- 12.67%
- Cash-on-cash
- 22.79%
- DSCR
- 2.01
- GRM
- 5.6
CMA / ARV
- ARV (on-the-fly)
- $187,110
- Comps found
- 12
Show comp detail 12 sales within ~0.75 mi
| Address | Dist | Beds/Ba | Sqft | Sold | Price | $/sf | Match |
|---|---|---|---|---|---|---|---|
| 7725 203rd Street Ct E #27 | 0.04mi | 4/2.0 (+1) | 1,782 (0%) | 10mo | $198,000 | $111 | 84 |
| 20315 77th Ave E #31 | 0.04mi | 3/2.0 | 1,847 (+4%) | 17mo | $184,000 | $100 | 78 |
| 20306 77th Ave E | 0.02mi | 3/2.5 | 1,716 (-4%) | 18mo | $180,000 | $105 | 76 |
| 8009 195th St E #89 | 0.55mi | 3/2.0 | 1,772 (-1%) | 5mo | $125,000 | $71 | 69 |
| 8102 195th St E #95 | 0.61mi | 3/2.0 | 1,778 (-0%) | 5mo | $180,000 | $101 | 66 |
| 8215 192nd Street Ct E #34 | 0.74mi | 4/2.0 (+1) | 1,782 (0%) | 4mo | $190,000 | $107 | 57 |
| 8004 195th St E #91 | 0.51mi | 3/2.0 | 1,726 (-3%) | 18mo | $149,900 | $87 | 56 |
| 8004 192nd Street Ct E #10 | 0.64mi | 4/2.0 (+1) | 1,782 (0%) | 11mo | $230,000 | $129 | 56 |
| 8310 207th St E | 0.47mi | 3/2.0 | 1,614 (-9%) | 9mo | $500,000 | $310 | 55 |
| 8104 194th St E #51 | 0.60mi | 4/2.0 (+1) | 1,778 (-0%) | 15mo | $145,000 | $82 | 54 |
| 8417 195th St E #121 | 0.70mi | 4/2.0 (+1) | 1,782 (0%) | 16mo | $175,000 | $98 | 49 |
| 7218 191st Street Ct E | 0.73mi | 4/2.0 (+1) | 1,848 (+4%) | 14mo | $480,000 | $260 | 43 |
Match score weights: distance 35% · size 25% · config 20% · recency 20%. Top-matched comps best support the ARV.
Projected returns pro-forma
-3.0% appreciation · 4.24% rent growth · sell at horizon
- IRR
- 17.0%
- Equity multiple
- 1.70×
- Total profit
- $41,041
- Equity at exit
- $31,312
- IRR
- 26.4%
- Equity multiple
- 3.45×
- Total profit
- $143,907
- Equity at exit
- $18,157
Cash invested: $58,800 (down + closing). Projections, not guarantees.
Landlord ↔ Tenant lean methodology
- Overall (STATE)
- 28 Tenant-Leaning
- State Washington
- 28 Tenant-Leaning · D+8
- County
- — inherits STATE
- City
- — inherits STATE
ZIP-level market 98387
- Rents YoY
- 4.2%
- Active inventory
- 383
- Price-to-rent
- 5.6×
Monthly cashflow live
- Estimated rent
- $3,128 medium interval (Pro) →
- Mortgage (P&I)
- −$1,101
- Tax from tax record
- −$166 /mo · $1,986/yr
- Insurance
- −$88
- HOA
- −$0
- Vacancy / Maint / Mgmt
- −$657
- Net cashflow
- $1,117
Break-even live
UW: 25.0% down · 7.5% · 30yr · 1.5% tax · 5.0% vac · 8.0% maint · 8.0% mgmt
Financing live
Cash to close
- Down payment
- $52,500
- Closing costs
- $6,300
- Reserves months
- —
- Total cash needed
- —
Loan-product check · same deal, 3 products live
Conventional
25% down · 7.5% · 30yr
- Down + closing
- —
- Monthly P&I
- —
- Monthly cashflow
- —
- DSCR
- —
- Eligible?
- —
Personal DTI + credit; lowest rate.
DSCR
20% down · 8.5% · 30yr
- Down + closing
- —
- Monthly P&I
- —
- Monthly cashflow
- —
- DSCR
- —
- Eligible?
- —
No personal income docs; deal must DSCR.
Hard money
10% down · 12.0% · 12mo
- Down + closing
- —
- Monthly P&I
- —
- Monthly cashflow
- —
- DSCR
- —
- Eligible?
- —
Short-term bridge; refi at stabilization.
Rent comps 3 comps
| Address | Beds | Baths | Sqft | Rent | $/sqft | DOM | Units | Dist |
|---|---|---|---|---|---|---|---|---|
| 20519 80th Ave E Spanaway, WA | 4.0 | 2.5 | 2031 | $2,925 | $1.44 | 4d | 1 | 0.24mi |
| 19605 84th Ave E Spanaway, WA | 3.0 | 2.5 | 1916 | $3,050 | $1.59 | 24d | 1 | 0.65mi |
| 19906 100th Avenue Ct E Graham, WA | 3.0 | 2.0 | 1322 | $2,749 | $2.08 | 16d | 1 | 1.44mi |
Listing history 2 events
-
2026-06-17remarks 627-char remark
-
2026-06-17$210,000 Active 1 DOM
ⓘ Source: listings_history table (triggers on properties + properties_extension) + one-shot
backfill from property_details.listing_events for pre-trigger history.
Tax reassessment forecast WA · Resets to sale price
- Current annual tax
- $1,986 · $166/mo
- Projected year-2 tax
- $2,058 · $172/mo
- Expected delta
- +$72/yr (+$6/mo · 3.6%)
ⓘ Screening estimate from a state-policy table — verify with the county assessor before closing.
Climate risk First Street
- Flood 1/10 Low FEMA zone X (unshaded) · 0% chance over 30 yrs
- Wildfire 1/10 Low
- Heat 3/10 Moderate 7 d/yr ≥87°F today · 15 d/yr by 30 yrs out
- Wind 1/10 Low
- Air quality 7/10 Severe 10 unhealthy d/yr today · 10 by 30 yrs out
Nearby sold comps map
Loading sold comps map…
Walkable amenities ~0.75 mi
Loading nearby amenities…
Taxation est. · year 1
- Rental income
- $37,536
- − Mortgage interest
- −$11,763
- − Property taxes
- −$1,986
- − Insurance
- −$1,050
- − Repairs & maintenance
- −$3,003
- − Management
- −$3,003
- − Depreciation
- −$6,109
- Taxable income
- $10,622
- Est. tax owed @ 24.0%
- −$2,549
- After-tax cash flow
- $10,853/yr
For passive investors: Depreciation is non-cash, so a rental often shows a tax loss while cash-flowing — sheltering income. Rental losses are passive: they offset passive income freely, and up to $25,000/yr can offset ordinary (W-2) income if you actively participate and your MAGI is under $100k (phasing out to $0 by $150k); unused losses carry forward. On sale, claimed depreciation is recaptured at up to 25%, and gains may owe capital-gains tax (a 1031 exchange can defer both). Figures are a year-1 estimate at your 24.0% rate — not tax advice; consult a CPA.
Schools (NCES district)
- District
- Bethel School District
- NCES district ID
- 5300480
- Math proficiency
- 47% ▬ 0.00%
- Reading proficiency
- 59% ▲ 2.00%
- Median HH income
- $65,872
- Composite
- 48.66/100
- National rank
- #4568
- State rank
- #103 of 291 in WA
Livability — Frederickson
- Score
- 73/100
- State rank
- #197
- US rank
- #5426
Category grades
Schools grade is shown separately in the Schools card above.
Census & demographics
- Census place
- Frederickson, WA
- County
- Pierce County · 788,257 people
- City population
- 32,195
- Metro
- Seattle-Tacoma-Bellevue, WA
- Population (ZIP)
- 50,774
- Household income
- $106,872
- Rent vs Own
- Severe rent burden
- 807.0
Population outlook (Pierce County) Hauer SSP2
- Today (2025)
- 956,648 people
- By 2030
- 1,010,862 · +5.7%
- By 2040
- 1,113,170 · +16.4%
- By 2050
- 1,206,524 · +26.1%
- By 2075
- 1,436,425 · +50.2%
- By 2100
- 1,563,654 · +63.5%
Race, ethnicity, and origin ACS 2023
- Neighborhood character
- Diverse neighborhood (Simpson 0.68)
- Race & ethnicity
- White 53% Two or more races 18% Hispanic / Latino 16% Black 10% Asian 6% Pacific Islander 4%
- Hispanic origin (detail)
- Mexican 10% Puerto Rican 2%
- Common ancestry
- Portuguese 3% Italian 3% Slovak 2%
- Foreign-born
- 11% · Canada, South Korea
- Languages at home
- 82% English-only · Spanish 7% Russian/Polish/Slavic 2% Other Asian/Pacific 2%
Political lean MEDSL · Pierce
- 2024 margin
- D (+10.8) · D 53.9% · R 43.1% · Other 3.0%
- 2008→2024 swing
- -1.4pp toward R · 2008: 12.2pp · 2024: 10.8pp
- All cycles
- 2024: D+10.8 2020: D+11.2 2016: D+7.5 2012: D+11.0 2008: D+12.2
Not yet ingested
- Civics
- —
Market trends
- HPI YoY
- ▼ -208.94%
- Current HPI
- 308.0462
- Rent YoY
- ▲ 4.24%
- Metro
- Seattle-Tacoma-Bellevue, WA
- State GDP YoY
- ▲ 4.65%
- F500 in state
- 22
Industry mix (Fortune 500 HQ in WA)
| Industry | F500 HQs | Revenue |
|---|---|---|
| Retail | 2 | $269B |
|
||
| Technology / Retail | 1 | $638B |
|
||
| Technology | 1 | $245B |
|
||
| Telecommunications | 1 | $38B |
|
||
| Food / Beverage | 1 | $36B |
|
||
| Automotive / Trucks | 1 | $34B |
|
||
Price history
1 event — show timeline
- 2026-06-17 Listed $210,000 NWMLS as Distributed by MLS Grid
Property tax history
+23.7%/yrLatest (2026): $1,986 · +5.3% YoY. Source: county tax records.
Cash-flow waterfall
monthlySold comps — $/sqft
last 12 mo · ≤1 miLoading sold comps…