20431 Teaka Ln · Fountain, FL
Flood risk 1/10 · Minimal
- FEMA flood zone
- X (unshaded)
- Chance of flooding over 30 yrs
- 0.0%
- Est. flood insurance / yr
- $507 – $1,088
Fire risk 7/10 · Major
- Est. fire insurance / yr
- $947 – $1,759
Heat risk 8/10 · Major
- Hot days now (above 106°F)
- 7 days/yr
- Hot days in 30 yrs
- 22 days/yr
Wind risk 9/10 · Severe
- Chance of severe wind over 30 yrs
- 99.0%
Air-quality risk 1/10 · Minimal
- Unhealthy air days now
- 0 days/yr
- Unhealthy air days in 30 yrs
- 0 days/yr
Risk factors via First Street. Map © Google.
Why this score? — see what drove the D grade
The composite is a weighted blend of 9 inputs, each scored 0–100. Each bar is that input's sub-score; the figure is the points it added to the 100-point composite (weight × sub-score).
- Cash flow +8.7/30.0
- Appreciation +7.7/10.0
- ARV discount +7.5/15.0
- Schools +4.3/10.0
- 1% rule +2.7/10.0
- Rent growth +2.5/5.0
- Livability +2.5/5.0
- Condition / age +2.5/5.0
- DSCR +2.4/10.0
$179,900
🖨 Deal sheet 📄 Offer letter ✓ Due diligence
Listing remarks MLS
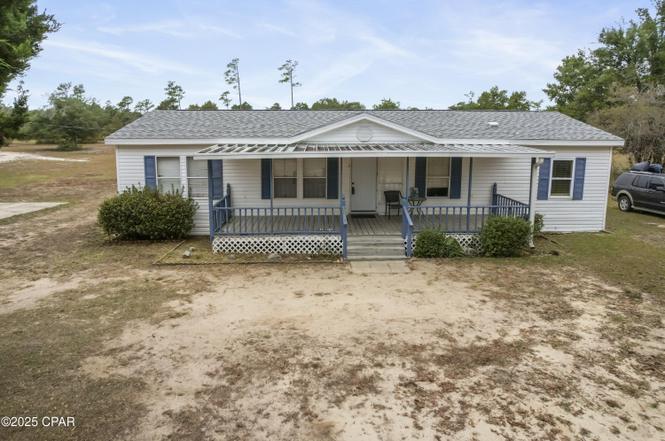
BEAUTIFUL 3 BEDROOM, 2 BATH, CAVALIER 1993, MANUFACTURED HOME ON 6.43 ACRES. CHAIN FENCE AROUND PROPERTY. EXCEPTIONALLY NICE. ALSO HAS A DETACHED CARPORT AND AN ABOVE GROUND POOL 15X30 WITH LARGE DECK 10X20. HAS EXTRA R
Key facts
- Master suite
- 6 acres
- Two living areas
Tags
Property features AI
Finance
- Other: Partially furnished units (multi-unit information)
- HOA & community: Short-term rentals allowed
Exterior
- Home design: Double wide mobile home; Single-story (first-floor living)
- Construction: Vinyl siding; Composition / shingle roof
- Exterior features: Covered porch; Shed(s); Chain link fencing; Dirt road access
Interior
- Kitchen: Electric oven; Electric range
- Bedrooms: Two bedrooms on the first floor
- Bathrooms: 2 full bathrooms
- Interior features: Covered porch
- Laundry & utility: First-floor laundry; Electric water heater
Neighborhood map
What this means for you Summary
Snapshot
- This is a 3-bed/2.0-bath manufactured listed at $180k.
Deal economics
- At list price, monthly cash flow is $-151 ($-2k/yr) — negative.
- To cash-flow at today's rent, offer at most $158k (12.1% below list).
- To meet the 1% rule (rent ≥ 1% of price), the offer needs to be $138k (23.1% below list).
- Recommended offer: $138k (23.1% below list) — sets the bar for 1% rule.
Location & tenants
- Location reads: area grade D — affects rentability + tenant quality, not the cash-flow math above.
- Bay (suburban): math 51% / reading 51% proficiency, ranked #29 of 73 in FL (top 40%) — acceptable for families but not a draw, mixed tenant base, ~2y average lease.
- Market conditions: 146 active listings in the ZIP; 2,473 units permitted in Bay County in 2024 (559 in 5+ unit buildings).
Forward outlook
- In year one you build about $11k of equity ($1k loan paydown + $10k appreciation (5.5% local appreciation)).
- Bay County population projected at +24% by 2050 — long-run rental-demand tailwind backs the buy-and-hold thesis.
- By year 4, paydown + projected appreciation supports a ~$38k cash-out refi (75% LTV) — recoverable capital for the next deal without selling this one.
Negotiation context
- It's been on market 186 days — a 12% lower offer ($158k) is reasonable based on typical stale-listing flexibility.
- 2 sale attempts since 29y ago; this cycle's ask has dropped $20k (10%) from the opening price — seller is motivated, your offer sets the floor, not the list.
- Current owner paid $64k; list at $180k implies a 181% gain — meaningful room to come down on a strong offer.
Risks & watch-outs
- Climate carrying-cost: severe wind risk, 99% chance of damaging wind over 30y; major wildfire risk; extreme-heat days projected 7→22/yr by 2055 (HVAC capex compounding) — expect insurance premiums to compound above CPI over the hold.
Questions for the listing agent
- What do current leases actually rent for vs. the listed asking? Can we see a recent rent roll and the last 12 months of T-12 income?
- It's been on market 186 days. Have you received any prior offers? Is the seller open to a 23% concession, seller financing, or rate buy-down credit?
- Why hasn't it sold? Are there any deal-killer items the seller is aware of (foundation, flood, title, zoning, code violations)?
- Is there a deadline driving the sale (1031 exchange, divorce, estate, relocation)? That informs how much negotiation room exists.
- The area grade is low — what's the realistic commute time and amenity access for the typical tenant pool here? Any planned neighborhood developments (good or bad) we should know about?
- What's the average days-on-market for RENTAL listings here right now (not sales)? A rising rental-DOM trend means longer vacancies and softer asking-rent achievability than the comps imply.
- What's the recent tenant-quality profile in this submarket — average credit score on applications, eviction rate, late-payment / NSF rate, and stable-employment percentage? A property-management company in the area should have these aggregated.
- How much new for-sale + rental construction is in the pipeline within 1–3 miles? Heavy new supply typically softens prices + rents 12–24 months out; constrained supply supports both.
Investment metrics
- 1% rule
- 0.77% ✗
- Cap rate
- 5.29%
- Cash-on-cash
- -3.60%
- DSCR
- 0.84
- GRM
- 10.8
CMA / ARV
No comps found within radius.
Projected returns pro-forma
5.5% appreciation · 3.0% rent growth · sell at horizon
- IRR
- 11.2%
- Equity multiple
- 1.74×
- Total profit
- $37,036
- Equity at exit
- $107,438
- IRR
- 12.3%
- Equity multiple
- 3.34×
- Total profit
- $118,075
- Equity at exit
- $190,132
Cash invested: $50,372 (down + closing). Projections, not guarantees.
Landlord ↔ Tenant lean methodology
- Overall (STATE)
- 87 Strongly Landlord-Friendly
- State Florida
- 87 Strongly Landlord-Friendly · R+3
- County
- — inherits STATE
- City
- — inherits STATE
ZIP-level market 32438
- Home prices YoY
- 2.7%
- Active inventory
- 146
- Price-to-rent
- 10.8×
Monthly cashflow live
- Estimated rent
- $1,383 medium interval (Pro) →
- Mortgage (P&I)
- −$943
- Tax est. 1.5%
- −$225 /mo · $2,698/yr
- Insurance
- −$75
- HOA
- −$0
- Vacancy / Maint / Mgmt
- −$290
- Net cashflow
- $-151
Break-even live
UW: 25.0% down · 7.5% · 30yr · 1.5% tax · 5.0% vac · 8.0% maint · 8.0% mgmt
Financing live
Cash to close
- Down payment
- $44,975
- Closing costs
- $5,397
- Reserves months
- —
- Total cash needed
- —
Loan-product check · same deal, 3 products live
Conventional
25% down · 7.5% · 30yr
- Down + closing
- —
- Monthly P&I
- —
- Monthly cashflow
- —
- DSCR
- —
- Eligible?
- —
Personal DTI + credit; lowest rate.
DSCR
20% down · 8.5% · 30yr
- Down + closing
- —
- Monthly P&I
- —
- Monthly cashflow
- —
- DSCR
- —
- Eligible?
- —
No personal income docs; deal must DSCR.
Hard money
10% down · 12.0% · 12mo
- Down + closing
- —
- Monthly P&I
- —
- Monthly cashflow
- —
- DSCR
- —
- Eligible?
- —
Short-term bridge; refi at stabilization.
Listing history 8 events
-
2026-05-04status Pending
-
2026-03-02price $179,900
-
2025-12-02price $189,900
-
2025-10-30$199,900 Active
-
1997-07-24soldstatus $64,000 219-char remark
Show marketing remark (219 chars)
BEAUTIFUL 3 BEDROOM, 2 BATH, CAVALIER 1993, MANUFACTURED HOME ON 6.43 ACRES. CHAIN FENCE AROUND PROPERTY. EXCEPTIONALLY NICE. ALSO HAS A DETACHED CARPORT AND AN ABOVE GROUND POOL 15X30 WITH LARGE DECK 10X20. HAS EXTRA R
-
1997-07-01soldstatus $64,000
-
1997-04-03$68,000 219-char remark
Show marketing remark (219 chars)
BEAUTIFUL 3 BEDROOM, 2 BATH, CAVALIER 1993, MANUFACTURED HOME ON 6.43 ACRES. CHAIN FENCE AROUND PROPERTY. EXCEPTIONALLY NICE. ALSO HAS A DETACHED CARPORT AND AN ABOVE GROUND POOL 15X30 WITH LARGE DECK 10X20. HAS EXTRA R
-
1993-04-01soldstatus $14,200
ⓘ Source: listings_history table (triggers on properties + properties_extension) + one-shot
backfill from property_details.listing_events for pre-trigger history.
Climate risk First Street
- Flood 1/10 Low FEMA zone X (unshaded) · 0% chance over 30 yrs
- Wildfire 7/10 Severe
- Heat 8/10 Severe 7 d/yr ≥106°F today · 22 d/yr by 30 yrs out
- Wind 9/10 Extreme 99% chance of damaging wind over 30 yrs
- Air quality 1/10 Low 0 unhealthy d/yr today · 0 by 30 yrs out
Nearby sold comps map
Loading sold comps map…
Walkable amenities ~0.75 mi
Loading nearby amenities…
Taxation est. · year 1
- Rental income
- $16,593
- − Mortgage interest
- −$10,077
- − Property taxes
- −$2,698
- − Insurance
- −$900
- − Repairs & maintenance
- −$1,327
- − Management
- −$1,327
- − Depreciation
- −$5,233
- Taxable loss
- −$4,971
- Est. tax savings @ 24.0%
- +$1,193
- After-tax cash flow
- $-618/yr
For passive investors: Depreciation is non-cash, so a rental often shows a tax loss while cash-flowing — sheltering income. Rental losses are passive: they offset passive income freely, and up to $25,000/yr can offset ordinary (W-2) income if you actively participate and your MAGI is under $100k (phasing out to $0 by $150k); unused losses carry forward. On sale, claimed depreciation is recaptured at up to 25%, and gains may owe capital-gains tax (a 1031 exchange can defer both). Figures are a year-1 estimate at your 24.0% rate — not tax advice; consult a CPA.
Schools (NCES district)
- District
- Bay
- NCES district ID
- 1200090
- Math proficiency
- 51% ▼ -8.00%
- Reading proficiency
- 51% ▼ -7.00%
- Median HH income
- $47,740
- Composite
- 43.41/100
- National rank
- #3014
- State rank
- #29 of 73 in FL
Livability — Fountain
No livability data for this city. (Only ~50 U.S. cities are tracked.)
Census & demographics
- Population (ZIP)
- 4,839
Population outlook (Bay County) Hauer SSP2
- Today (2025)
- 206,264 people
- By 2030
- 217,740 · +5.6%
- By 2040
- 238,738 · +15.7%
- By 2050
- 255,545 · +23.9%
- By 2075
- 288,295 · +39.8%
- By 2100
- 288,638 · +39.9%
Race, ethnicity, and origin ACS 2023
- Neighborhood character
- Predominantly White (80%)
- Race & ethnicity
- White 80% Two or more races 14% Hispanic / Latino 10% Native American 1%
- Hispanic origin (detail)
- Mexican 6%
- Common ancestry
- Slovak 3% Portuguese 1%
- Foreign-born
- 5% · Canada, Dominican Republic
- Languages at home
- 90% English-only · Spanish 5% Arabic 3% Tagalog/Filipino 1%
Political lean MEDSL · Bay
- 2024 margin
- Solid R (+47.4) · D 25.8% · R 73.1% · Other 1.1%
- 2008→2024 swing
- -6.6pp toward R · 2008: -40.7pp · 2024: -47.4pp
- All cycles
- 2024: R+47.4 2020: R+43.5 2016: R+46.3 2012: R+43.6 2008: R+40.7
Not yet ingested
- Civics
- —
Market trends
- HPI YoY
- ▲ 5.50%
- Current HPI
- 209.7768
- Rent YoY
- —
- Metro
- —
- State GDP YoY
- ▲ 3.28%
- F500 in state
- 36
Industry mix (Fortune 500 HQ in FL)
| Industry | F500 HQs | Revenue |
|---|---|---|
| Industrial Technology | 2 | $29B |
|
||
| Insurance | 2 | $17B |
|
||
| Retail | 1 | $60B |
|
||
| Technology Distribution | 1 | $58B |
|
||
| Homebuilding | 1 | $35B |
|
||
| Technology Manufacturing | 1 | $35B |
|
||
Price history
+1166.9% since first listed8 events — show timeline
- 2026-05-04 Pending — CPARMLS
- 2026-03-02 Price Changed $179,900 CPARMLS
- 2025-12-02 Price Changed $189,900 CPARMLS
- 2025-10-30 Listed $199,900 CPARMLS
- 1997-07-24 Sold (MLS) $64,000 CPARMLS
- 1997-07-01 Sold (Public Records) $64,000 Public Records
- 1997-04-03 Listed $68,000 CPARMLS
- 1993-04-01 Sold (Public Records) $14,200 Public Records
Property tax history
+0.0%/yrLatest (2025): $220 · +6.8% YoY. Source: county tax records.
Cash-flow waterfall
monthlySold comps — $/sqft
last 12 mo · ≤1 miLoading sold comps…