3522 W Hundred Rd · Chester, VA
Flood risk 1/10 · Minimal
- FEMA flood zone
- X (unshaded)
- Chance of flooding over 30 yrs
- 0.0%
- Est. flood insurance / yr
- $507 – $1,088
Fire risk 3/10 · Minor
- Est. fire insurance / yr
- $666 – $1,236
Heat risk 7/10 · Major
- Hot days now (above 107°F)
- 7 days/yr
- Hot days in 30 yrs
- 16 days/yr
Wind risk 6/10 · Moderate
- Chance of severe wind over 30 yrs
- 27.0%
Air-quality risk 2/10 · Minimal
- Unhealthy air days now
- 1 days/yr
- Unhealthy air days in 30 yrs
- 1 days/yr
Risk factors via First Street. Map © Google.
Why this score? — see what drove the D grade
The composite is a weighted blend of 9 inputs, each scored 0–100. Each bar is that input's sub-score; the figure is the points it added to the 100-point composite (weight × sub-score).
- Cash flow +12.8/30.0
- ARV discount +7.5/15.0
- Schools +5.2/10.0
- DSCR +3.8/10.0
- Livability +3.7/5.0
- Rent growth +3.0/5.0
- 1% rule +2.6/10.0
- Condition / age +2.5/5.0
- Appreciation +0.0/10.0
$269,950
🖨 Deal sheet 📄 Offer letter ✓ Due diligence
Listing remarks MLS
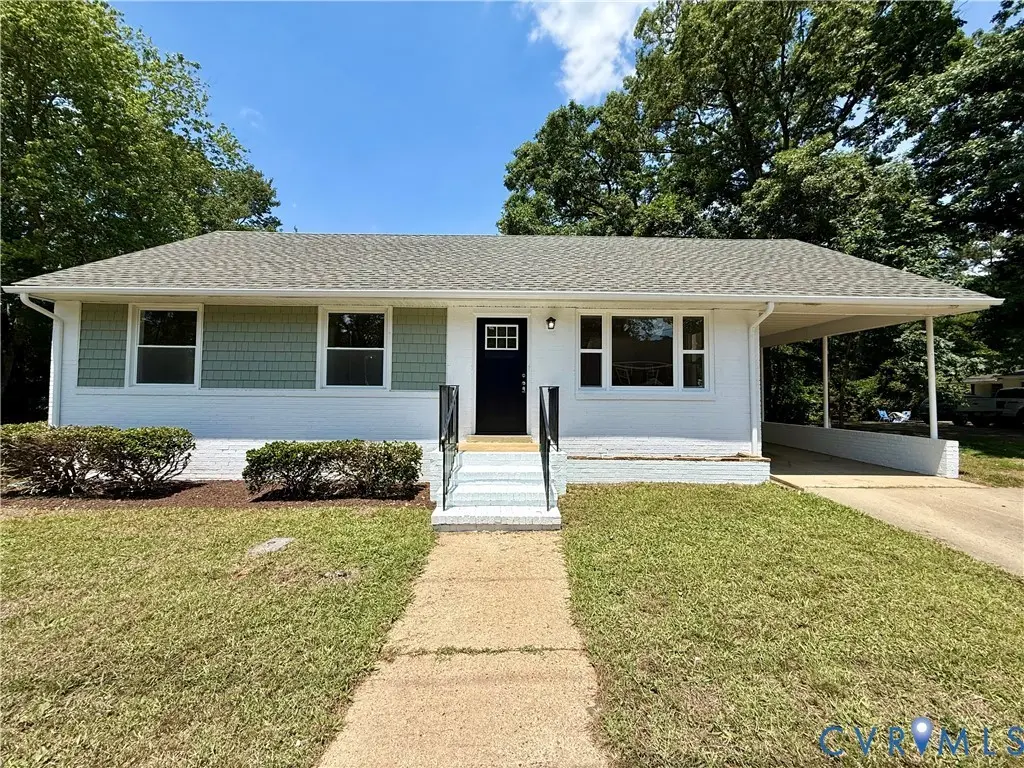
Fully renovated move in ready brick rancher located in prime area of Chester. Brand new granite countertops, refinished hardwood floors, new paint throughout, new vinyl floors in the kitchen, and much more. Detached storage shed as well as a carport and paved concrete parking pad in the rear. 3 bedrooms, 1 full bath. Washer, dryer, and refrigerator included. Zoned for business or residential makes it great for owner occupants or office space.
Key facts
- Renovated bathroom
- New carpet
- New appliances
Tags
Property features AI
Finance
- Other: Approximately 0.384-acre lot; Approximately 1,040 above-grade finished area
Exterior
- Utilities: Public water; Public sewer
- Home design: Single-story home; Resale property; Shingle roof
- Construction: Brick, frame and vinyl siding construction
- Exterior features: Deck
Interior
- Kitchen: Kitchen on the first floor
- Bedrooms: Three bedrooms, all on the first floor
- Flooring: Carpet; Vinyl
- Bathrooms: 1 full bathroom
- Heating & cooling: Electric heating with heat pump; Central air conditioning
- Interior features: Crawl space basement; Carpet and vinyl flooring
- Laundry & utility: Electric water heater
Neighborhood map
What this means for you Summary
Snapshot
- This is a 3-bed/1.0-bath other listed at $270k.
Deal economics
- At list price, monthly cash flow is $-26 ($-308/yr) — negative.
- To cash-flow at today's rent, offer at most $265k (1.7% below list).
- To meet the 1% rule (rent ≥ 1% of price), the offer needs to be $205k (24.1% below list).
- Recommended offer: $205k (24.1% below list) — sets the bar for 1% rule.
- Cap rate 6.2% vs local median 3.6% in Chester — top-decile yield for the area; either an underpriced asset or a hidden risk that comps aren't pricing in. Stress-test before assuming the spread holds.
Location & tenants
- Location reads 73/100 on livability (#170 in VA) — a middle-class / working-renter tenant base. Strengths: housing A+, health & safety A+, schools A-; Watch: amenities F, commute F.
- Chesterfield County Public School District (suburban): math 52% / reading 64% proficiency, ranked #57 of 131 in VA (top 44%) — acceptable for families but not a draw, mixed tenant base, ~2y average lease.
- Market conditions: Rents rising (+2.0%/yr); 215 active listings in the ZIP; 5 comparable units currently listed for rent nearby; rentals at typical pace (median 24d on market — plan ~3-4 weeks tenant-placement turnaround); 40% of comp listings sitting > 30 days — soft ceiling on asking rent; solid renter incomes; 2,307 units permitted in Chesterfield County in 2024 (462 in 5+ unit buildings).
Forward outlook
- Local home prices are declining (-3.0%/yr); year-one equity from $2k of loan paydown is wiped out by about $8k of value loss. Plan a longer hold.
- Chesterfield County population projected at +20% by 2050 — long-run rental-demand tailwind backs the buy-and-hold thesis.
Negotiation context
- Only 2 days on market — expect competitive offers; lowballing is unlikely to land.
- 2 sale attempts since 9y ago with the ask held roughly flat each time — persistent listings suggest the price (not the market) is what's stuck; bring a comps-based counter.
- Current owner paid $148k; list at $270k implies a 82% gain — meaningful room to come down on a strong offer.
Risks & watch-outs
- Watch-outs: built in 1958 — expect roof / HVAC / electrical / plumbing capex.
- Climate carrying-cost: major wind risk, 27% chance of damaging wind over 30y; extreme-heat days projected 7→16/yr by 2055 (HVAC capex compounding) — expect insurance premiums to compound above CPI over the hold.
Questions for the listing agent
- What do current leases actually rent for vs. the listed asking? Can we see a recent rent roll and the last 12 months of T-12 income?
- Built in 1958 — when were the roof, HVAC, electrical panel, plumbing, and water heater last replaced?
- Is there a deadline driving the sale (1031 exchange, divorce, estate, relocation)? That informs how much negotiation room exists.
- Schools are A-rated — typically a magnet for longer-tenancy family renters. What's the average tenant stay here, and is there a school-zone premium baked into asking?
- The area grade is low — what's the realistic commute time and amenity access for the typical tenant pool here? Any planned neighborhood developments (good or bad) we should know about?
- What's the average days-on-market for RENTAL listings here right now (not sales)? A rising rental-DOM trend means longer vacancies and softer asking-rent achievability than the comps imply.
- What's the recent tenant-quality profile in this submarket — average credit score on applications, eviction rate, late-payment / NSF rate, and stable-employment percentage? A property-management company in the area should have these aggregated.
- How much new for-sale + rental construction is in the pipeline within 1–3 miles? Heavy new supply typically softens prices + rents 12–24 months out; constrained supply supports both.
Investment metrics
- 1% rule
- 0.76% ✗
- Cap rate
- 6.18%
- Cash-on-cash
- -0.41%
- DSCR
- 0.98
- GRM
- 11.0
CMA / ARV
No comps found within radius.
Projected returns pro-forma
-3.0% appreciation · 2.05% rent growth · sell at horizon
- IRR
- -18.0%
- Equity multiple
- 0.37×
- Total profit
- $-47,426
- Equity at exit
- $40,250
- IRR
- -12.0%
- Equity multiple
- 0.32×
- Total profit
- $-51,643
- Equity at exit
- $23,340
Cash invested: $75,586 (down + closing). Projections, not guarantees.
Landlord ↔ Tenant lean methodology
- Overall (STATE)
- 55 Moderately Landlord-Leaning
- State Virginia
- 55 Moderately Landlord-Leaning · D+2
- County
- — inherits STATE
- City
- — inherits STATE
ZIP-level market 23831
- Rents YoY
- 2.0%
- Active inventory
- 215
- Price-to-rent
- 11.0×
Monthly cashflow live
- Estimated rent
- $2,049 high interval (Pro) →
- Mortgage (P&I)
- −$1,416
- Tax from tax record
- −$116 /mo · $1,396/yr
- Insurance
- −$112
- HOA
- −$0
- Vacancy / Maint / Mgmt
- −$430
- Net cashflow
- $-26
Break-even live
UW: 25.0% down · 7.5% · 30yr · 1.5% tax · 5.0% vac · 8.0% maint · 8.0% mgmt
Financing live
Cash to close
- Down payment
- $67,488
- Closing costs
- $8,098
- Reserves months
- —
- Total cash needed
- —
Loan-product check · same deal, 3 products live
Conventional
25% down · 7.5% · 30yr
- Down + closing
- —
- Monthly P&I
- —
- Monthly cashflow
- —
- DSCR
- —
- Eligible?
- —
Personal DTI + credit; lowest rate.
DSCR
20% down · 8.5% · 30yr
- Down + closing
- —
- Monthly P&I
- —
- Monthly cashflow
- —
- DSCR
- —
- Eligible?
- —
No personal income docs; deal must DSCR.
Hard money
10% down · 12.0% · 12mo
- Down + closing
- —
- Monthly P&I
- —
- Monthly cashflow
- —
- DSCR
- —
- Eligible?
- —
Short-term bridge; refi at stabilization.
Rent comps 5 comps
| Address | Beds | Baths | Sqft | Rent | $/sqft | DOM | Units | Dist |
|---|---|---|---|---|---|---|---|---|
| 11701 Chester Village Dr Chester, VA | 2.0 | 1.0 | 958 | $1,758 | $1.83 | 1d | 5 | 0.71mi |
| 11625 Chester Station Dr Chester, VA | 3.0 | 2.0 | 1440 | $2,100 | $1.46 | 23d | 1 | 0.72mi |
| 2716 Goyne Loop Chester, VA | 2.0 | 1.5 | 1280 | $1,850 | $1.45 | 43d | 1 | 0.82mi |
| 11101 Timonium Dr Chester, VA | 4.0 | 1.5 | 1428 | $2,600 | $1.82 | 43d | 1 | 1.04mi |
| 11424 Elokomin Ave Chester, VA | 2.0–3.0 | 1.0–2.0 | 1074 | $1,780 | $1.66 | 23d | 7 | 1.16mi |
Listing history 3 events
-
2026-06-15statusdays on market $269,950 Pending 2 DOM
-
2026-06-13remarks 674-char remark
-
2026-06-13$269,950 Active 1 DOM
ⓘ Source: listings_history table (triggers on properties + properties_extension) + one-shot
backfill from property_details.listing_events for pre-trigger history.
Tax reassessment forecast VA · Resets to sale price
- Current annual tax
- $1,396 · $116/mo
- Projected year-2 tax
- $2,214 · $184/mo
- Expected delta
- +$818/yr (+$68/mo · 58.6%)
ⓘ Screening estimate from a state-policy table — verify with the county assessor before closing.
Climate risk First Street
- Flood 1/10 Low FEMA zone X (unshaded) · 0% chance over 30 yrs
- Wildfire 3/10 Moderate
- Heat 7/10 Severe 7 d/yr ≥107°F today · 16 d/yr by 30 yrs out
- Wind 6/10 Major 27% chance of damaging wind over 30 yrs
- Air quality 2/10 Low 1 unhealthy d/yr today · 1 by 30 yrs out
Nearby sold comps map
Loading sold comps map…
Walkable amenities ~0.75 mi
Loading nearby amenities…
Taxation est. · year 1
- Rental income
- $24,588
- − Mortgage interest
- −$15,121
- − Property taxes
- −$1,396
- − Insurance
- −$1,350
- − Repairs & maintenance
- −$1,967
- − Management
- −$1,967
- − Depreciation
- −$7,853
- Taxable loss
- −$5,066
- Est. tax savings @ 24.0%
- +$1,216
- After-tax cash flow
- $907/yr
For passive investors: Depreciation is non-cash, so a rental often shows a tax loss while cash-flowing — sheltering income. Rental losses are passive: they offset passive income freely, and up to $25,000/yr can offset ordinary (W-2) income if you actively participate and your MAGI is under $100k (phasing out to $0 by $150k); unused losses carry forward. On sale, claimed depreciation is recaptured at up to 25%, and gains may owe capital-gains tax (a 1031 exchange can defer both). Figures are a year-1 estimate at your 24.0% rate — not tax advice; consult a CPA.
Schools (NCES district)
- District
- Chesterfield County Public School District
- NCES district ID
- 5100840
- Math proficiency
- 52% ▼ -30.00%
- Reading proficiency
- 64% ▼ -15.00%
- Median HH income
- $72,821
- Composite
- 51.56/100
- National rank
- #1712
- State rank
- #57 of 131 in VA
Livability — Chester
- Score
- 73/100
- State rank
- #170
- US rank
- #5369
Category grades
Schools grade is shown separately in the Schools card above.
Census & demographics
- Census place
- Chester, VA
- County
- Chesterfield County · 406,988 people
- City population
- 54,827
- Metro
- Richmond, VA
- Population (ZIP)
- 39,529
- Household income
- $95,750
- Rent vs Own
- Severe rent burden
- 952.0
Population outlook (Chesterfield County) Hauer SSP2
- Today (2025)
- 377,190 people
- By 2030
- 395,710 · +4.9%
- By 2040
- 427,694 · +13.4%
- By 2050
- 452,706 · +20.0%
- By 2075
- 505,533 · +34.0%
- By 2100
- 521,282 · +38.2%
Race, ethnicity, and origin ACS 2023
- Neighborhood character
- Diverse neighborhood (Simpson 0.62)
- Race & ethnicity
- White 53% Black 30% Hispanic / Latino 10% Two or more races 7% Asian 3%
- Hispanic origin (detail)
- Mexican 1% Puerto Rican 3%
- Common ancestry
- Italian 1% Slovak 1% Romanian 1%
- Foreign-born
- 7% · Canada, China, South Korea
- Languages at home
- 90% English-only · Spanish 6% German/W. Germanic 1% Other Indo-European 1%
Political lean MEDSL · Chesterfield
- 2024 margin
- Lean D (+9.0) · D 53.8% · R 44.8% · Other 1.4%
- 2008→2024 swing
- +16.4pp toward D · 2008: -7.5pp · 2024: 9.0pp
- All cycles
- 2024: D+9.0 2020: D+6.7 2016: R+2.2 2012: R+7.1 2008: R+7.5
Not yet ingested
- Civics
- —
Market trends
- HPI YoY
- ▼ -212.93%
- Current HPI
- 252.2448
- Rent YoY
- ▲ 2.05%
- Metro
- Richmond, VA
- State GDP YoY
- ▲ 2.40%
- F500 in state
- 50
Industry mix (Fortune 500 HQ in VA)
| Industry | F500 HQs | Revenue |
|---|---|---|
| Aerospace / Defense | 4 | $236B |
|
||
| Technology / Defense | 3 | $32B |
|
||
| Financial Services | 2 | $176B |
|
||
| Utilities | 2 | $27B |
|
||
| Insurance | 2 | $25B |
|
||
| Technology | 2 | $15B |
|
||
Price history
+499.9% since first listed7 events — show timeline
- 2026-06-12 Listed $269,950 CVRMLS
- 2017-11-08 Sold (Public Records) $148,000 Public Records
- 2017-11-07 Sold (MLS) $148,000 CVRMLS
- 2017-10-08 Pending — CVRMLS
- 2017-10-03 Listed $150,000 CVRMLS
- 1999-10-01 Sold (Public Records) $98,600 Public Records
- 1985-10-07 Sold (Public Records) $45,000 Public Records
Property tax history
+1.1%/yrLatest (2025): $1,396 · -0.5% YoY. Source: county tax records.
Cash-flow waterfall
monthlySold comps — $/sqft
last 12 mo · ≤1 miLoading sold comps…