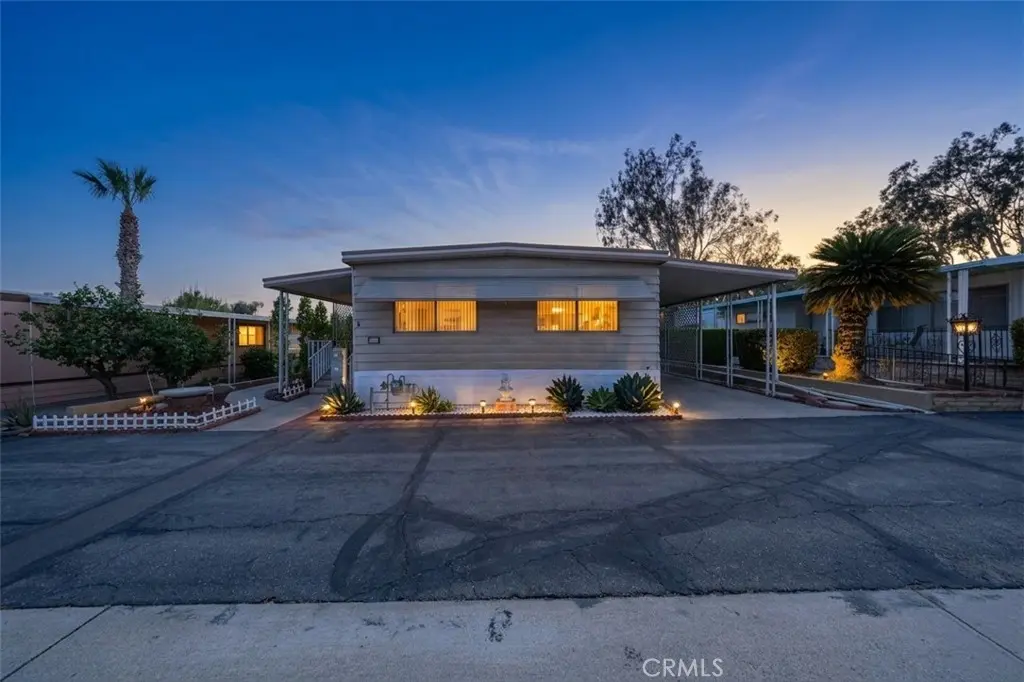
8651 Foothill Blvd #18 · Rancho Cucamonga, CA
Flood risk 3/10 · Minor
- FEMA flood zone
- X (unshaded)
- Chance of flooding over 30 yrs
- 0.2%
- Est. flood insurance / yr
- $507 – $1,088
Fire risk 1/10 · Minimal
- Est. fire insurance / yr
- $659 – $1,223
Heat risk 7/10 · Major
- Hot days now (above 100°F)
- 6 days/yr
- Hot days in 30 yrs
- 17 days/yr
Wind risk 1/10 · Minimal
- Chance of severe wind over 30 yrs
- —
Air-quality risk 9/10 · Severe
- Unhealthy air days now
- 23 days/yr
- Unhealthy air days in 30 yrs
- 28 days/yr
Risk factors via First Street. Map © Google.
Why this score? — see what drove the B grade
The composite is a weighted blend of 9 inputs, each scored 0–100. Each bar is that input's sub-score; the figure is the points it added to the 100-point composite (weight × sub-score).
- Cash flow +30.0/30.0
- ARV discount +10.4/15.0
- 1% rule +10.0/10.0
- DSCR +10.0/10.0
- Condition / age +4.0/5.0
- Livability +3.5/5.0
- Rent growth +2.7/5.0
- Schools +2.3/10.0
- Appreciation +0.0/10.0
$132,500
🖨 Deal sheet 📄 Offer letter ✓ Due diligence
Listing remarks
Welcome to this residence featuring two spacious primary suites, perfect for comfortable living and located in a sought-after 55+ community. Inside, you'll find an updated kitchen, fresh interior paint and newer flooring throughout, creating a clean and inviting atmosphere. Step outside to enjoy the neatly landscaped yard and a serene, peaceful setting. A screened-in patio offers flexible space for storage, hobbies, or a craft room. For added accessibility, this home comes equipped with a wheelchair lift located at the side entrance, conveniently positioned under the covered parking area. Community amenities include a pool, spa, and clubhouse. Closely located is San Antonio Hospital, shoppi
Key facts
- Community amenities
- Spa
- Updated kitchen
Tags
Property features AI
Finance
- Other: Parcel number provided; Elevation measured in feet; Lot characterized as 0-1 unit/acre
- Financial info: Land lease (monthly) — $1,255 (seller provided); Rent includes trash, water and sewer
- HOA & community: Senior community; Park name: Casa Volante; Community features include street lighting; Pets allowed with breed restrictions; Manager approval required
Exterior
- Parking: Covered carport (attached); Concrete driveway; Two parking spaces
- Utilities: District/public water; Sewer paid / connected; Natural gas connected; Electricity connected; Cable available; Telephone in street
- Home design: Single-story; Entry at side; Entry level 1; Turnkey condition; Mobile home (Royal Chateau model, 24' x 59'); Mobile home remains
- Construction: Raised foundation
- Exterior features: Enclosed patio; Patio; Community pool; Shed; Wheelchair access; East-facing; Has a view
Interior
- Kitchen: Gas cooktop; Gas oven; Built-in range; Range/stove hood; Microwave; Refrigerator; Garbage disposal; Gas water heater
- Bedrooms: All bedrooms on main floor; Two primary bedrooms; Main floor primary suite
- Flooring: Laminate flooring
- Bathrooms: Two full bathrooms; Walk-in shower
- Heating & cooling: Central heating (furnace); Central cooling
- Interior features: Ceiling fan; Laminate counters; Window screens; Community spa
- Laundry & utility: Laundry room inside; Gas dryer hookup; Individual laundry room
Neighborhood map
What this means for you Summary
Snapshot
- This is a 2-bed/2.0-bath manufactured listed at $132k. Condition is rated good.
Deal economics
- At list price, monthly cash flow is $1k ($17k/yr) — positive.
- The deal already cash-flows at list — no discount required.
- Meets the 1% rule at list price ($3k rent vs $132k).
- Cap rate 19.1% vs local median 2.7% in Rancho Cucamonga — top-decile yield for the area; either an underpriced asset or a hidden risk that comps aren't pricing in. Stress-test before assuming the spread holds.
Location & tenants
- Location reads 70/100 on livability (#237 in CA) — a middle-class / working-renter tenant base. Strengths: employment A+, commute A, housing A-; Watch: amenities D+, health & safety D, cost of living F.
- Central Elementary (suburban): math 25% / reading 25% proficiency, ranked #379 of 517 in CA (top 73%) — low school quality limits family demand, transient renter base, plan for 1-2y turnover.
- Market conditions: Rents flat; 146 active listings in the ZIP; 26 comparable units currently listed for rent nearby; rentals leasing fast (median 2d on market — plan ~1-2 weeks tenant-placement turnaround); solid renter incomes; 5,458 units permitted in San Bernardino County in 2024 (1,500 in 5+ unit buildings).
- This rent runs 38% of the median local income ($92k/yr) — at the standard rent-burdened threshold; future hikes will face affordability resistance.
Forward outlook
- Local home prices are declining (-3.0%/yr); year-one equity from $916 of loan paydown is wiped out by about $4k of value loss. Plan a longer hold.
- San Bernardino County population projected at +15% by 2050 — modest demand growth; plan on rents tracking national, not racing it.
- At projected returns (-3.0% appreciation + 0.8% rent growth), your $37k cash investment doubles in ~3 years — after that, you're playing with house money.
Negotiation context
- Only 11 days on market — expect competitive offers; lowballing is unlikely to land.
- 4 sale attempts since 3y ago with the ask held roughly flat each time — persistent listings suggest the price (not the market) is what's stuck; bring a comps-based counter.
- Current owner paid $95k; 39% above their basis — modest negotiation headroom, anchor on the comps not their cost.
Risks & watch-outs
- Climate carrying-cost: extreme-heat days projected 6→17/yr by 2055 (HVAC capex compounding) — expect insurance premiums to compound above CPI over the hold.
Questions for the listing agent
- Built in 1971 — when were the roof, HVAC, electrical panel, plumbing, and water heater last replaced?
- Is there a deadline driving the sale (1031 exchange, divorce, estate, relocation)? That informs how much negotiation room exists.
- Schools are B-rated — typically a magnet for longer-tenancy family renters. What's the average tenant stay here, and is there a school-zone premium baked into asking?
- What's the average days-on-market for RENTAL listings here right now (not sales)? A rising rental-DOM trend means longer vacancies and softer asking-rent achievability than the comps imply.
- What's the recent tenant-quality profile in this submarket — average credit score on applications, eviction rate, late-payment / NSF rate, and stable-employment percentage? A property-management company in the area should have these aggregated.
- How much new for-sale + rental construction is in the pipeline within 1–3 miles? Heavy new supply typically softens prices + rents 12–24 months out; constrained supply supports both.
Investment metrics
- 1% rule
- 2.22% ✓
- Cap rate
- 19.06%
- Cash-on-cash
- 45.58%
- DSCR
- 3.03
- GRM
- 3.8
CMA / ARV
- ARV (on-the-fly)
- $141,600
- Comps found
- 12
Show comp detail 12 sales within ~0.75 mi
| Address | Dist | Beds/Ba | Sqft | Sold | Price | $/sf | Match |
|---|---|---|---|---|---|---|---|
| 8651 Foothill Blvd #92 | 0.06mi | 2/2.0 | 1,440 (+2%) | 0mo | $156,000 | $108 | 94 |
| 8651 Foothill Blvd #99 | 0.06mi | 2/2.0 | 1,440 (+2%) | 2mo | $140,000 | $97 | 93 |
| 8651 Foothill Blvd #157 | 0.06mi | 2/2.0 | 1,440 (+2%) | 3mo | $142,000 | $99 | 92 |
| 8651 Foothill Blvd #159 | 0.06mi | 2/2.0 | 1,488 (+5%) | 5mo | $145,000 | $97 | 85 |
| 8651 Foothill Blvd #190 | 0.06mi | 2/2.0 | 1,440 (+2%) | 14mo | $145,000 | $101 | 83 |
| 8651 Foothill Blvd #82 | 0.06mi | 2/2.0 | 1,554 (+10%) | 1mo | $280,000 | $180 | 80 |
| 8389 Baker Ave #61 | 0.13mi | 3/2.0 (+1) | 1,425 (+1%) | 9mo | $175,000 | $123 | 80 |
| 8651 Foothill Blvd #187 | 0.06mi | 2/2.0 | 1,464 (+3%) | 14mo | $100,000 | $68 | 80 |
| 8651 Foothill Blvd #8 | 0.06mi | 2/2.0 | 1,562 (+10%) | 14mo | $175,000 | $112 | 68 |
| 1350 San Bernardino #86 | 0.74mi | 3/2.0 (+1) | 1,440 (+2%) | 7mo | $140,000 | $97 | 52 |
| 1350 San Bernardino Rd #187 | 0.74mi | 3/2.0 (+1) | 1,344 (-5%) | 1mo | $135,000 | $100 | 51 |
| 1350 San Bernardino Rd #132 | 0.74mi | 3/2.0 (+1) | 1,224 (-14%) | 3mo | $120,000 | $98 | 36 |
Match score weights: distance 35% · size 25% · config 20% · recency 20%. Top-matched comps best support the ARV.
Projected returns pro-forma
-3.0% appreciation · 0.84% rent growth · sell at horizon
- IRR
- 40.3%
- Equity multiple
- 2.67×
- Total profit
- $62,071
- Equity at exit
- $19,756
- IRR
- 45.5%
- Equity multiple
- 4.91×
- Total profit
- $145,207
- Equity at exit
- $11,456
Cash invested: $37,100 (down + closing). Projections, not guarantees.
Landlord ↔ Tenant lean methodology
- Overall (STATE)
- 18 Strongly Tenant-Friendly
- State California
- 18 Strongly Tenant-Friendly · D+13
- County
- — inherits STATE
- City
- — inherits STATE
ZIP-level market 91730
- Rents YoY
- 0.8%
- Active inventory
- 146
- Price-to-rent
- 3.8×
Monthly cashflow live
- Estimated rent
- $2,943 high interval (Pro) →
- Mortgage (P&I)
- −$695
- Tax est. 1.5%
- −$166 /mo · $1,988/yr
- Insurance
- −$55
- HOA
- −$0
- Vacancy / Maint / Mgmt
- −$618
- Net cashflow
- $1,409
Break-even live
UW: 25.0% down · 7.5% · 30yr · 1.5% tax · 5.0% vac · 8.0% maint · 8.0% mgmt
Financing live
Cash to close
- Down payment
- $33,125
- Closing costs
- $3,975
- Reserves months
- —
- Total cash needed
- —
Loan-product check · same deal, 3 products live
Conventional
25% down · 7.5% · 30yr
- Down + closing
- —
- Monthly P&I
- —
- Monthly cashflow
- —
- DSCR
- —
- Eligible?
- —
Personal DTI + credit; lowest rate.
DSCR
20% down · 8.5% · 30yr
- Down + closing
- —
- Monthly P&I
- —
- Monthly cashflow
- —
- DSCR
- —
- Eligible?
- —
No personal income docs; deal must DSCR.
Hard money
10% down · 12.0% · 12mo
- Down + closing
- —
- Monthly P&I
- —
- Monthly cashflow
- —
- DSCR
- —
- Eligible?
- —
Short-term bridge; refi at stabilization.
Rent comps 26 comps
| Address | Beds | Baths | Sqft | Rent | $/sqft | DOM | Units | Dist |
|---|---|---|---|---|---|---|---|---|
| 8248 Inglenook Pl Rancho Cucamonga, CA | 2.0 | 2.5 | 984 | $2,400 | $2.44 | 1d | 1 | 0.04mi |
| 8491 Gabrielino Ct Unit 69 Rancho Cucamonga, CA | 3.0 | 2.5 | 1417 | $3,850 | $2.72 | 1d | 1 | 0.19mi |
| 8650 Cava Dr Rancho Cucamonga, CA | 3.0 | 2.5 | 1763 | $3,200 | $1.82 | 15d | 1 | 0.24mi |
| 8567 Cava Dr Rancho Cucamonga, CA | 3.0 | 2.5 | 1763 | $3,600 | $2.04 | 1d | 1 | 0.24mi |
| 8300 Gabriel Dr Unit B Rancho Cucamonga, CA | 3.0 | 2.0 | 1140 | $3,450 | $3.03 | 1d | 1 | 0.26mi |
| 8250 Vineyard Ave Rancho Cucamonga, CA | 2.0–3.0 | 2.0 | 1059 | $2,599 | $2.45 | 1d | 14 | 0.32mi |
| 8231 Tapia Via Dr Rancho Cucamonga, CA | 2.0 | 1.0 | 918 | $2,075 | $2.26 | 10d | 1 | 0.41mi |
| 8167 Vineyard Ave #61 Rancho Cucamonga, CA | 3.0 | 2.5 | 1221 | $2,750 | $2.25 | 24d | 1 | 0.42mi |
| 8167 Vineyard Ave #2 Rancho Cucamonga, CA | 2.0 | 1.5 | 932 | $2,200 | $2.36 | 1d | 1 | 0.43mi |
| 8210 Rancheria Dr Unit 8 Rancho Cucamonga, CA | 3.0 | 2.0 | 1200 | $2,895 | $2.41 | 1d | 1 | 0.46mi |
| 8325 Vineyard Ave Unit 5 Rancho Cucamonga, CA | 2.0 | 2.0 | 882 | $2,400 | $2.72 | 1d | 1 | 0.47mi |
| 8255 Vineyard Ave Rancho Cucamonga, CA | 1.0–2.0 | 1.0–2.0 | 847 | $2,966 | $3.50 | 1d | 7 | 0.47mi |
| 8555 Sandalwood Ct Rancho Cucamonga, CA | 3.0 | 2.0 | 1400 | $3,375 | $2.41 | 1d | 1 | 0.53mi |
| 1413 San Bernardino Rd Upland, CA | 2.0 | 1.0–2.0 | 751 | $2,645 | $3.52 | 1d | 12 | 0.75mi |
| 8760 Church St Rancho Cucamonga, CA | 3.0 | 1.5 | 1151 | $3,395 | $2.95 | 10d | 1 | 0.75mi |
| 7522 Alta Cuesta Dr Rancho Cucamonga, CA | 2.0 | 2.0 | 1055 | $3,495 | $3.31 | 1d | 1 | 0.93mi |
| 1420 Felicita Ct Upland, CA | 3.0 | 2.0 | 1339 | $3,095 | $2.31 | 5d | 1 | 0.99mi |
| 8645 Calle Del Prado Rancho Cucamonga, CA | 2.0 | 2.0 | 875 | $2,000 | $2.29 | 10d | 1 | 1.00mi |
| 863 N 9th Ave Upland, CA | 3.0 | 2.0 | 1507 | $3,600 | $2.39 | 1d | 1 | 1.20mi |
| 306 N 10th Ave Apt -3 Upland, CA | 3.0 | 2.0 | 1450 | $3,000 | $2.07 | 43d | 1 | 1.22mi |
| 1548 N Lassen Ave Ontario, CA | 2.0 | 2.0 | 900 | $2,500 | $2.78 | 1d | 1 | 1.23mi |
| 380 N 9th Ave Upland, CA | 1.0 | 1.0 | 900 | $1,895 | $2.11 | 5d | 1 | 1.26mi |
| 890 N Campus Ave Apt B Upland, CA | 3.0 | 1.5 | 1380 | $2,900 | $2.10 | 20d | 1 | 1.33mi |
| 7374 Lariat Pl Rancho Cucamonga, CA | 2.0 | 2.0 | 1000 | $2,300 | $2.30 | 1d | 1 | 1.38mi |
| 7360 Lariat Pl Rancho Cucamonga, CA | 2.0 | 2.0 | 1000 | $2,350 | $2.35 | 1d | 1 | 1.39mi |
| 9247 Spur Dr Rancho Cucamonga, CA | 2.0 | 2.0 | 1000 | $2,350 | $2.35 | 15d | 1 | 1.40mi |
Listing history 9 events
-
2026-06-18days on market $132,500 Active 11 DOM
-
2026-06-17days on market $132,500 Active 10 DOM
-
2026-06-16days on market $132,500 Active 9 DOM
-
2026-06-15days on market $132,500 Active 8 DOM
-
2026-06-13days on market $132,500 Active 6 DOM
-
2026-06-13days on market $132,500 Active 5 DOM
-
2026-06-09days on market $132,500 Active 2 DOM
-
2026-06-08remarks 699-char remark
-
2026-06-08$132,500 Active 1 DOM
ⓘ Source: listings_history table (triggers on properties + properties_extension) + one-shot
backfill from property_details.listing_events for pre-trigger history.
Climate risk First Street
- Flood 3/10 Moderate FEMA zone X (unshaded) · 20% chance over 30 yrs
- Wildfire 1/10 Low
- Heat 7/10 Severe 6 d/yr ≥100°F today · 17 d/yr by 30 yrs out
- Wind 1/10 Low
- Air quality 9/10 Extreme 23 unhealthy d/yr today · 28 by 30 yrs out
Nearby sold comps map
Loading sold comps map…
Walkable amenities ~0.75 mi
Loading nearby amenities…
Taxation est. · year 1
- Rental income
- $35,316
- − Mortgage interest
- −$7,422
- − Property taxes
- −$1,988
- − Insurance
- −$662
- − Repairs & maintenance
- −$2,825
- − Management
- −$2,825
- − Depreciation
- −$3,855
- Taxable income
- $15,739
- Est. tax owed @ 24.0%
- −$3,777
- After-tax cash flow
- $13,134/yr
For passive investors: Depreciation is non-cash, so a rental often shows a tax loss while cash-flowing — sheltering income. Rental losses are passive: they offset passive income freely, and up to $25,000/yr can offset ordinary (W-2) income if you actively participate and your MAGI is under $100k (phasing out to $0 by $150k); unused losses carry forward. On sale, claimed depreciation is recaptured at up to 25%, and gains may owe capital-gains tax (a 1031 exchange can defer both). Figures are a year-1 estimate at your 24.0% rate — not tax advice; consult a CPA.
Condition & rehab AI · 12 photos
This manufactured home is in good condition with a good condition score of 80. It has a cosmetic rehab level and requires minor maintenance and repairs. The home has a good resale and rental value with high-ROI updates such as painting the exterior siding and installing smart home features.
Value-add opportunities
- Resale Paint exterior siding — Fresh paint can enhance curb appeal and home value
- Rental Replace outdoor lighting — Upgrading lighting can make the home more attractive to potential tenants
- Both Install smart home features — Smart home features can increase both resale and rental value
Renovation cost estimate screening
Value-add ROI direction
- Resale Paint exterior siding — Fresh paint can enhance curb appeal and home value ↑
- Rental Replace outdoor lighting — Upgrading lighting can make the home more attractive to potential tenants ↑
- Both Install smart home features — Smart home features can increase both resale and rental value ↑
ⓘ Cost ranges are severity-bucket heuristics (US national rule-of-thumb). Get contractor quotes + a written scope before underwriting a rehab budget.
Schools (NCES district)
- District
- Central Elementary
- NCES district ID
- 0607950
- Math proficiency
- 25% ▼ -18.00%
- Reading proficiency
- 25% ▼ -31.00%
- Median HH income
- $64,090
- Composite
- 23.41/100
- National rank
- #7895
- State rank
- #379 of 517 in CA
Livability — Rancho Cucamonga
- Score
- 70/100
- State rank
- #237
- US rank
- #7808
Category grades
Schools grade is shown separately in the Schools card above.
Census & demographics
- Census place
- Rancho Cucamonga, CA
- County
- San Bernardino County · 2,030,291 people
- City population
- 175,531
- Metro
- Riverside-San Bernardino-Ontario, CA
- Population (ZIP)
- 71,613
- Household income
- $92,237
- Rent vs Own
- Severe rent burden
- 4013.0
Population outlook (San Bernardino County) Hauer SSP2
- Today (2025)
- 2,300,329 people
- By 2030
- 2,378,907 · +3.4%
- By 2040
- 2,523,137 · +9.7%
- By 2050
- 2,642,388 · +14.9%
- By 2075
- 2,880,769 · +25.2%
- By 2100
- 2,909,436 · +26.5%
Race, ethnicity, and origin ACS 2023
- Neighborhood character
- Highly diverse neighborhood (Simpson 0.71)
- Race & ethnicity
- Hispanic / Latino 43% White 28% Two or more races 16% Asian 14% Black 10% Native American 2%
- Hispanic origin (detail)
- Mexican 33% Salvadoran 1%
- Common ancestry
- Lithuanian 1% Italian 1% Slovak 1%
- Foreign-born
- 23% · Canada, China, South Korea
- Languages at home
- 61% English-only · Spanish 22% Chinese 4% Tagalog/Filipino 4%
Political lean MEDSL · San Bernardino
- 2024 margin
- Toss-up / Even · D 47.5% · R 49.7% · Other 2.8%
- 2008→2024 swing
- -8.5pp toward R · 2008: 6.3pp · 2024: -2.1pp
- All cycles
- 2024: R+2.1 2020: D+10.7 2016: D+9.8 2012: D+5.4 2008: D+6.3
Not yet ingested
- Civics
- —
Market trends
- HPI YoY
- ▼ -554.10%
- Current HPI
- 404.3113
- Rent YoY
- ▲ 0.84%
- Metro
- Riverside-San Bernardino-Ontario, CA
- State GDP YoY
- ▲ 3.21%
- F500 in state
- 116
Industry mix (Fortune 500 HQ in CA)
| Industry | F500 HQs | Revenue |
|---|---|---|
| Technology | 27 | $1,492B |
|
||
| Financial Services | 3 | $174B |
|
||
| Retail | 3 | $44B |
|
||
| Insurance | 3 | $26B |
|
||
| Media / Entertainment | 2 | $115B |
|
||
| Pharmaceuticals / Biotech | 2 | $62B |
|
||
Price history
+27.4% since first listed15 events — show timeline
- 2026-06-07 Listed $132,500 CRMLS
- 2026-05-18 Listing Removed — CRMLS
- 2026-05-11 Price Changed $129,000 CRMLS
- 2026-04-19 Price Changed $124,500 CRMLS
- 2026-04-01 Relisted — CRMLS
- 2026-04-01 Price Changed $134,500 CRMLS
- 2026-03-20 Pending — CRMLS
- 2026-03-13 Price Changed $132,500 CRMLS
- 2026-02-12 Price Changed $135,500 CRMLS
- 2025-10-22 Price Changed $139,500 CRMLS
- 2025-10-01 Price Changed $142,500 CRMLS
- 2025-09-14 Listed $149,900 CRMLS
- 2023-05-26 Sold (MLS) $95,000 CRMLS
- 2023-05-19 Pending — CRMLS
- 2023-05-05 Listed $104,000 CRMLS
Cash-flow waterfall
monthlySold comps — $/sqft
last 12 mo · ≤1 miLoading sold comps…